

DNY59/iStock via Getty Images
Headline pace breaks lower
Headline CPI shows deceleration (Haver Analytics/FAO Economics)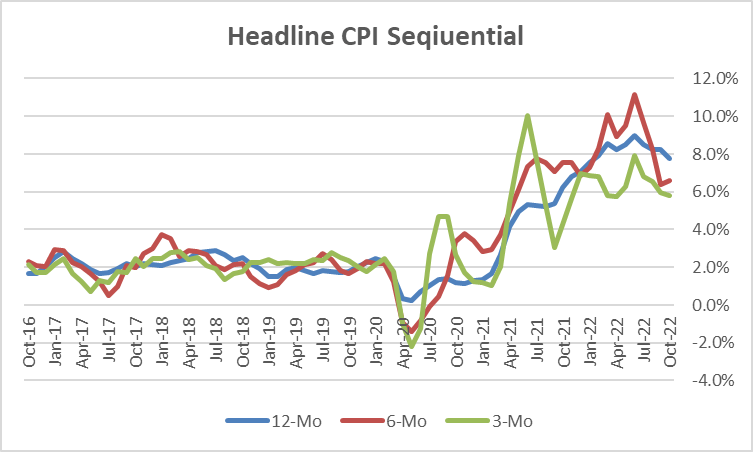
The CPI for October has slowed sharply compared to expectations, prompting a huge rally in the stock market. This is a very interesting development and it’s a good time to think about what numbers mean and how markets react to them. The monthly change in the CPI was not much different from what was expected but it was weaker with a slightly weaker core reading as well. The gain on the CPI headline was 0.4% compared with a 0.4% rise a month ago. One month ago, the core reading which is the CPI excluding food and energy, rose by 0.6% and it did that for two months in a row. This month it rose by 0.3%. Is this good news? Yes. Great news? Well, not hardly…
Do these sorts of surprises and decelerations in the core CPI justify such a strong market reaction? That’s the question we need to put on the table.
S&P gives thin gruel a Michelin 5-Star rating
In my book this report just does not cut it. This report is not a catalyst for the kind of market reaction that we saw. The sequential growth rate in the CPI falls from 7.8% over 12 months to a 6.6% pace over 6 months to a 3.8% annual rate over 3 months. For the core the same sequence of inflation rates is 6.3% over 12 months, 6.3% over 6 months and 5.8% over 3 months. This is not much deceleration.
Is inflation really decelerating? (Haver Analytics/FAO Economics)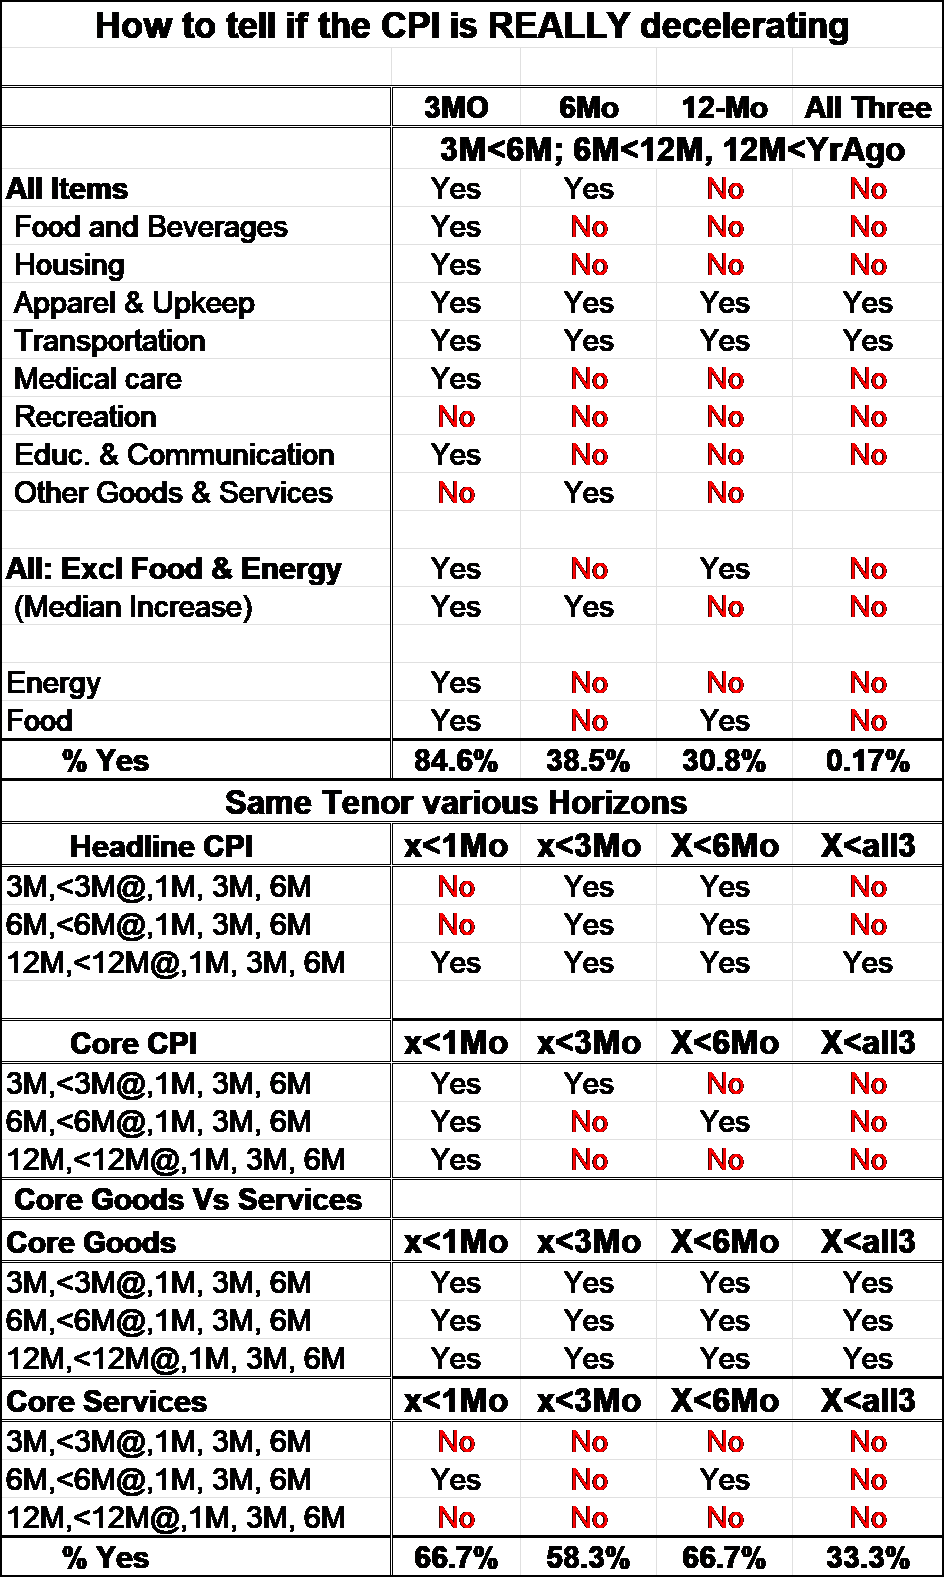
In fact, the data tell us that most of the deceleration is coming from the headline and the headline is volatile. Meanwhile, oil prices have slipped but OPEC is still trying to push prices back up. President Biden is sticking strongly with his green agenda and not allowing US production to offset any tightness in global oil markets. All that we’ve gotten from the President is for him to pump oil out of the Strategic Petroleum Reserve (SPR) to try to replace scarce energy on world markets. But that’s a dangerous game and it’s a game that cannot go on for very long. Energy prices are a huge contributor to inflation short-term and what we see going on with the headline energy prices are these trends: up at 19.3% annual rate over 12 months falling at a 9.2% annual rate over 6 months and falling at a 36.1% annual rate over 3- months. Meanwhile, from food we get a steady drum beat of inflation right around the 10% mark on all these horizons.
I have constructed the table on the left to help answer the question of whether what we see going on in this inflation report is a real trend and whether we should be reacting to it. The top panel of the chart looks at headline inflation, the food and energy components separately and the main CPI categories. The table produces results about sequential inflation on various timelines. Is 3-month inflation higher than 6-month inflation, is 6- month inflation higher than12-month inflation, is 12-month inflation higher than it was twelve-months before that?
At the bottom of the first panel you can see that the decline in inflation rate over 3 months compared to 6 months is very persuasive occurring in 85% of these categories. But over 6 months it declines in only 38% of the categories; over 12 months inflation declines compared to a year ago in only 31% of the categories. If inflation is truly decelerating it should decelerate continuously yet inflation is only decelerating on all these horizons in two groups constituting 17% of these categories. The two categories that have inflation consistently decelerating are apparel & upkeep and transportation.
The panel below that looks at headline and core inflation along with core goods and core services to focus a little bit more in on how inflation is behaving. For these measures I’m looking at the sequential pattern of a given tenor of inflation. In plain language that means I’m going to look at 3-month inflation and to see if it declined compared to what it was a month ago then I’m going to look at the three-month inflation rate and compare it to what it was three months ago; then I’m going to look at the same current 3-month inflation rate and see how it compares to what it was 6 months ago. So I execute this calculation for the 3-month inflation rate, the 6-month inflation rate and the 12-month inflation rate, for each on those same timelines (one month, three-months and 6 months) In all cases I keep the tenor of the calculation the same but I compared it over different spans to see what’s going on with inflation on that tenor.
This is simply another common sense way to evaluate inflation, to see if it’s declining or if it’s accelerating. When we add up the yes’es and No’s once again we find that over one-month decelerations are pervasively occurring in 66% of these categories. Comparing inflation on a given tenor to where it was 3 months ago we find it’s lower in 58% of the categories; comparing the same current pace to where it was 6- months ago, we find it’s lower in two-thirds of the categories. When we choose a fixed tenor and look at how it performs over a sequence of different periods we’re finding that inflation is decelerating consistently and more than half of the categories although it’s decelerating over all of the categories at the same time only about one-third of the time (far right-hand column). On the face of it, this seems impressive. This method makes the current three-month result the base for comparing all the previous timelines to -and remember the table above the best sequential score was for the three-month inflation rate.
What is the ‘good news’ driver?
A close look at this table shows us what’s really driving these results. For core goods we see that inflation is decelerating on all the timelines for all of all the measures. The good behavior of inflation is a goods sector phenomenon. However, unruly inflation is a phenomenon of the services sector where of the nine assessments across the three different tenors there are only two yes’s and there are seven No’s. That means, of course, that inflation is decelerating all the service sector measures for none of these tenors adding another layer of no’s for services.
These data are without weighting; the CPI, of course, is a weighted index and we know that the goods sector has a much smaller weight (less than 25%) than the services sector so while we’re getting all of the beneficial results from the goods sector the more powerful impact on the CPI is going to come from the services sector where we have a much higher proliferation of ‘no’ responses – meaning no deceleration.
Core shows inflation is stuck & high (Haver Analytics/FAO Economics)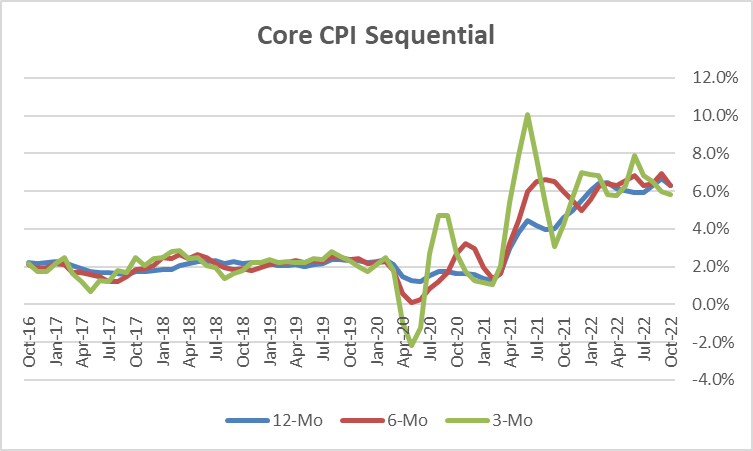
The sequential inflation rates from the core index tell the story really of inflation that has moved up and then pretty much flattened out.
Four Mo moving average of core is stuck (Haver Analytics/FAO Economics )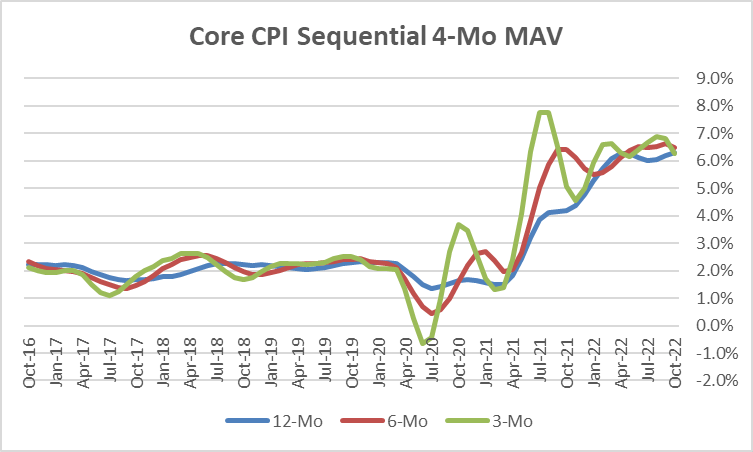
This result is even clearer if we take each of these series and plot it as a four-month moving average. You can see that they have clustered together on this basis for a number of months. Core inflation looks much more like it’s stuck than like it’s turning lower. Headline inflation is turning lower because of the volatile elements in the headline and we can’t really be sure what that means because they are volatile and the economy is stubbornly refusing to slow. .
The stock market whisperer
So what is the stock market telling us? Why did it explode so sharply on such poor and thin gruel for good news from the CPI? The answer to this is quite clear. The answer is it had very little to do with the CPI. And has a lot more to do with market psychology and with pent up demand in the stock market. The markets have been looking for the Fed to pivot for months even though the Federal Reserve – even today – had members talking to us telling us not to get hopes up about a change in Fed policy. Mary Daly from the San Francisco Fed has warned that the markets are likely speculating on the size of the next Fed rate hike not about whether the Fed is getting ready to pivot. The Fed does not have a rate cut planned; it simply is not on the menu. it’s not an appetizer, it’s not a main course, and it’s not the dessert. It’s simply not there.
But, money has been piling up on the sideline and since no place has really been safe from the ravages of Fed rate hikes, market participants continue to think that the game in town that has been the best game in town will continue to be the best game in town and that’s the stock market. Bitcoin and cyber currencies, a favorite theme for a lot of younger investors, have also been stung by recent market events and we’re seeing those investors scrambling to try to find an alternative.
Tech breaks neck, but buy it…what the heck?
Perhaps the best indication of what’s going on in the markets and how related to the CPI it is, is the performance of the tech sector. We’re just coming through a period where two very high profile tech/social media stocks have been blasted. Mark Zuckerberg has taken the fall for the drop in Meta’s (META) stock price admitting that he had taken the shift of demand during COVID to be permanent when it wasn’t. He’s poured a lot of money into the metaverse that hasn’t paid off and now when a market conditions are different, advertising revenues are falling, and entrepreneurial money is scarcer, he is finding times more difficult. And Twitter (TWTR), of course, is a change of ownership and very likely a change in the direction of the company in a very fundamental way. And one might think with such high profile tech/media stocks being hammered – implementing significant layoffs too boot- that might stand in the way of a tech stock rally. But now the tech sector is rallying like crazy on the CPI. Do you need any further evidence that this is all psychology and very little fundamental? When did tech shares and social media trade off the CPI?
The CPI shows no sign of being a watershed report
The first point in looking at the inflation is that inflation is still very much a problem. It’s broad, it’s stubborn, it’s stuck, and there’s very little evidence that it’s really turning lower. What is turning lower is the most volatile part of the index that is also susceptible to turning higher again on a whim because OPEC does control oil prices and they can cut back output should they so choose. We still have drought conditions and there may be further fallout from agricultural products to hit the grocery store shelves. It’s probably not a good time to bet that there will not be a wage price spiral because labor has gotten far behind the gains in prices. I will be surprised if unions don’t try to claw back some of what inflation has taken. It’s interesting to note that even with an extremely tight labor market and with firms having a hard time finding the skills that they want, wages have not stood up to inflation but that does that mean that they won’t in the future.
Wage gains lag price gains (Haver Analytics/FAO Economics)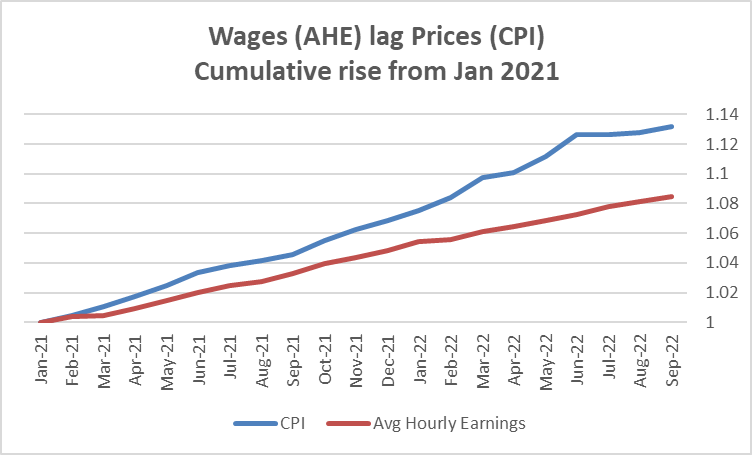
Do you care about earnings?
Perhaps the most difficult thing about trying to orchestrate a market rally from here is that economists generally think that recession lies ahead. And that means what lies ahead is going to be a period with weaker sales, rising unemployment, probably still lingering inflation, and the kinds of corporate earnings reports that don’t normally make buyers out of investors. That makes this a tough time to try to generate a sustainable rally in the stock market. Whenever we get into a situation like this people talk about how stocks or bonds – or whatever asset class is being discussed- may be willing to look through the valley to the other side. I think the people who talk like this are the people who own stocks and they are trying to sell them to you. Because markets, in fact, don’t act like that.
Like most economists I don’t have a clue where inflation is going- but at least I’ll admit it. The Federal Reserve is making a stab in the dark at where it thinks interest rates have to go in order to make policy restrictive. However, ‘restrictive policy’ means that interest rates have to be high enough relative to inflation to restrict something. And Jay Powell at his last press conference rejected the idea that the federal funds rate had to be above the 12-month inflation rate; he said he thought it needed to be related to something that’s a little more forward-looking but he didn’t give us a clue what that was. We still don’t really know what that thing is that Powell spoke about. Nor do we know what will happen to inflation or what the Fed really thinks. It has a set of ‘policy dots’ that it laid out but these have been so out of touch with reality and so slow to adjust to real-world conditions since late 2021, it’s hard to know if the numbers that the Fed has now put into the dot matrix actually mean anything or if they belong in the matrix with Keanu Reeves.
The CPI did have some good news…
I can understand that markets are happy that we had a breath of fresh air from the CPI. Even Federal Reserve officials have been somewhat cynical about commenting on this. Charles Evans the soon to be retiring President of the Chicago Fed said that the Federal Reserve can’t continue to hike the Fed funds rate 75 basis points every time the CPI comes in higher than expected. That point of view got a break this month when the CPI came in lower than expected. However, you can see from Evans’ comments the Fed is getting somewhat frustrated because what he set up was really a quite outrageous strawman to attack. Nobody thinks that the Fed needs to raise the Fed funds rate 75 basis points every time the inflation rate disappoints the Fed. But we know that the more disappointing the inflation rate is, the faster the Fed probably needs to move in order to get the funds rate up to a restrictive area- wherever that is… I’m beginning to think that area might be in Area 51 and is top secret. At any rate, it is alien to me.
Increasingly markets are pointing to federal funds rate levels of 4 ½% to 5%. There has been some talk of the federal funds rate needing to get to 6% to be restrictive. Federal funds rate and inflation forecasting seemed to be a lot like a pin the tail on the donkey game where you blindfold an economist, give them an arrow to pin on the target, turn them around two or three times, and then let them take a stab at attaching that arrow somewhere to the target and see where it lies.
What will the Fed do with this report? The obverse result…
One thing to bear in mind is that the Fed has been wary of how markets might react to economic data as well as to its own policy announcements. At its last meeting where it had language that suggested that the Fed was going to look at the cumulative increases in its policy and take account of the lags and monetary policy, when markets rallied on the release of that statement within 1/2 an hour Chair Powell was having his press conference and disabusing the markets of that interpretation. That sent them scurrying back into their respective corners where they had begun the day. When the markets view the inflation rate as good news and they rally strongly, they are taking some of the financial tightness out of the market that the Fed has been seeking to create in order to slow the economy. So, paradoxically, the more that the markets rally, the less that the Fed wants to slow the hike in rates! It’s very possible that the net reaction to the events of Thursday that saw a break in the CPI report and a sharp rally in the market will be that the Fed will see the day’s news as stimulative to the economy. Instead of seeing inflation as breaking lower, this market rally could increase the Fed’s desire for a 75bp hike instead of a 50 basis point rate hike to remove stimulus the market rally injected.
You can’t put the cart ahead of the horse
My view of this stock market rally is that it’s a vulnerable rally; it doesn’t really make much sense. It’s a relief rally because the CPI has broken; there is hope it will be an inflection point that will mark the Fed giving us somewhat smaller rate hikes than they did before – maybe the Fed will transition to 50 basis point rate hikes from 75 basis point rate hikes. But the Fed is raising rates and the Fed’s intention is to slow the economy down and when the Fed slows the economy down corporate earnings reports deteriorate and that makes it hard to rally the stock market too far ahead of the Fed’s actually achieving the slowdown that it desires. Everything comes in its own time and sequence. Do not even try to get out ahead of the Fed. The bottom line is you just can’t put the cart ahead of the horse. And while that’s an old-fashioned expression, I would advise people thinking about it for a few minutes. I realize that no one in markets is going to wait until the Fed actually cuts rates to generate a stock market rally; but I do think that the true bullish move in the stock market can’t come until we’ve seen a real break in the economy. And that hasn’t happened yet. Remember, if you are behind the curve you swing and miss. And if you are ahead of the fast ball you also swing and miss. Timing is everything.
Be the first to comment