

chonticha wat/iStock via Getty Images
The calm of the last 3 weeks has resulted in a risk-on environment. This, in turn, has led to a nice recovery rally in stocks. For the time being, volatility has subsided. However, we believe there are many underlying market risks that can still resurface without any warning.
From late 2015 to August 2020, the price of gold doubled, going from approximately $1040 to $2080. Gold then experienced a profit-taking $400 pullback.
Gold’s rally over the past 12 months failed to break through its $2080 price level. After retreating back to $200, gold seems to have found support at the $1900 level.
In reviewing the following spot gold chart, it appears we have broken out of an accumulation phase and seem to be preparing to move above the $2080 high.
XAUUSD – GOLD Spot/U.S. Dollar – Weekly Chart
Gold Spot/US Dollar Chart (Technical Traders – TradingView)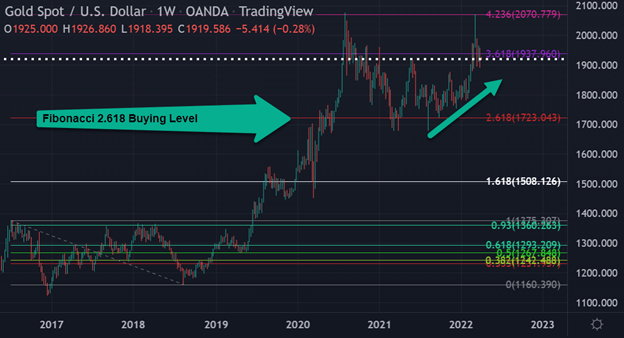
GLD ETF rallied +22% Over the last 12 months
GLD – SPDR Gold Shares is the largest physically-backed gold exchange-traded fund (ETF) in the world. According to its founder, State Street Global Advisor’s website, www.spdrgoldshares.com, “the economic forces that determine the price of gold are different from the economic forces that determine the price of many other asset classes such as equities, bonds or real estate.”
Utilizing the (www.tradingview.com) Fibonacci projection tool, we see that the GLD price accumulation from July 2016 through August 2018 resulted in a 2-year rally and a profit of $82 or an approximate gain of +73%.
Additionally, we see that the GLD top made in August 2020 was at the Fibonacci 4.618 level of $193.44. The 7-month correction in GLD found support at the Fibonacci 2.618 level of $157.98. The rally in GLD during the last 12 months also failed a second time at the Fibonacci 4.618 level.
GLD now appears to have broken out of its accumulation phase and seems to be preparing to trade above the $194 high.
GLD – SPDR Gold Shares – NYSE – Weekly Chart
GLD Chart (Technical Traders – TradingView)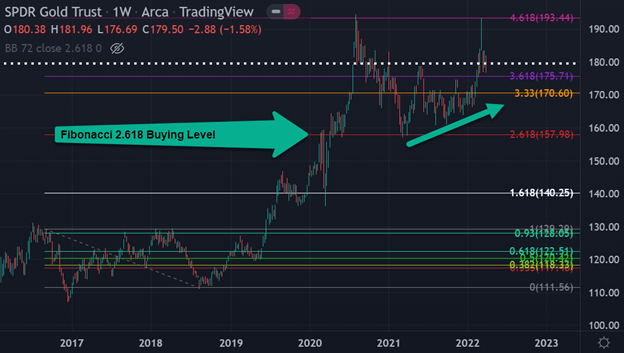
Newmont Mining Rises Above $75
Newmont (NEM), a gold mining company, is up +33.46% year to date compared to the S&P 500 -4.62%. According to www.newmont.com, “Newmont is the world’s leading gold company and a producer of copper, silver, zinc, and lead.”
Newmont’s bull market started back in September 2015. During the past 6-years, Newmont’s stock price has experienced several strong rallies that ranged from +$30 to +$40 each. Newmont’s recent price level is now four times greater than the low it made in 2016.
Utilizing the same Fibonacci tool, but this time measuring from the $15 lows to the $30 lows, we learn that Newmont had a strong reaction down after reaching the key $75 level.
However, this reaction found buying support at the Fibonacci 2.618 level of $52.67. Newmont has since rallied by $30, which has allowed its price to blow through its previous $75 top resistance level.
Newmont may be showing us that the gold spot and the GLD ETF will both make new highs.
NEM – Newmont ‘Gold Mining’ – NYSE – Daily Chart
NYSE Gold Mining Chart (Technical Traders – TradingView)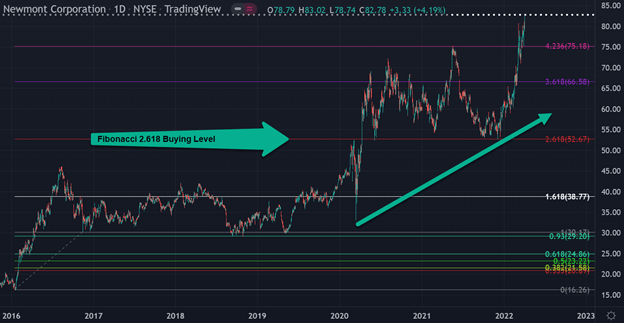
Knowledge, Wisdom, And Application Are Needed
It is important to understand that we are not saying the market has topped and is headed lower. This article is to shed light on some interesting analyses of which you should be aware. As technical traders, we follow price only, and when a new trend has been confirmed, we will change our positions accordingly.
Editor’s Note: The summary bullets for this article were chosen by Seeking Alpha editors.
Be the first to comment