

One of the most anticipated annual reports in the fund industry is the SPIVA U.S. Scorecard by S&P. It measures how active funds perform relative to their benchmarks.
The 2019 update came out this month. Even though a heck of a lot has changed since the end of the year, we can learn a lot from the results.
Not a Ton of Surprises, Except for…
Many of the results come as no surprise to industry watchers.
Nearly 70% of intermediate investment-grade bond funds outperformed their benchmark index. This makes sense given how investment-grade credit (commonly over-weighted in many core bond funds) sharply outperformed in 2019.
U.S. large-cap growth managers, many of whom over-weight the big tech companies, also had a strong showing – again expected, as the tech sector was up 50%.
As for those with the weakest showings, the juggernaut won once again: 70% of large-cap core managers lagged the S&P 500. It was the 12th consecutive year that the majority of funds in the category trailed the Index.
With that said, there are always a few surprises. Perhaps the biggest this year was that a jarring 97% of large value funds lagged the benchmark in 2019 – the worst showing of any style box in any year since at least 2001.
The poor performance of large value funds is not new. No U.S. equity style box has a worse average hit rate over the last 1-, 3-, 5- and 10-year periods. There are currently no time frames where even one out of every five active managers beat the Index. It’s the only category with such consistently poor results.
Percent of Managers Outperformed by Benchmark
Value Does Not Have to Mean Junk
Large value’s struggle was not alone, as value funds of all sizes have underperformed. Over each trailing time frame and in every market cap segment, growth managers have done better than their value counterparts.
The struggles of value investing have been written about ad nauseum in recent years; the compounded underperformance by value funds relative to already-underperforming benchmarks has been less scrutinized. Why are so many funds trailing an index that is trailing on its own?
One potential reason is because few value managers are implementing quality within their approaches. Many value strategies compare themselves to the Russell family of value indexes, where the only value metric utilized is the price-to-book ratio (P/B). In our view, this is a flawed and outdated calculation that does not effectively capture the worth of many of today’s business models.
The SPIVA report analyzes fund performance against S&P indexes, which in addition to P/B also uses price-to-earnings (P/E) and price-to-sales (P/S) ratios. This is a step up, especially considering the initial profitability requirement of the parent S&P 500 Index.
But we don’t view these simple valuation ratios as sufficient. Instead, we prefer to look at value through the lens of dividends, both in screening and weighting.
Why? Because there can be a lot of landmines in value investing – after all, there is usually a reason that inexpensive companies are inexpensive – and dividends are an organic way to inject quality into a value strategy.
Restricting holdings to dividend payers and giving the largest weight to companies with the cash flow to support the largest dividends further tilts the portfolio toward the highest-quality subset of value.
Consider our U.S. LargeCap Dividend Fund (NYSEARCA:DLN), a rules-based passive ETF.
A factor regression of DLN against both the S&P and Russell value indexes shows that, while all three have strong exposure to the value factor, only DLN has even a positive exposure to profitability, while Russell and S&P both load negative to the main proxy for quality.
Factor Regression for DLN vs. Value Indexes
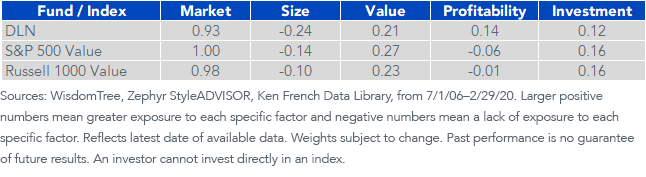
For definitions of terms in the table, please visit our glossary.
Active Managers, the Easter Bunny and Santa Claus
Back to the SPIVA report. To paraphrase Led Zeppelin, if 2019 was the good times, 2020 has been the bad times, and we have all certainly had our share.
This begs the timely question: What happens in down markets?
There is a common narrative that active managers may lag in bull markets but will do much better once the downturn arrives. This theory has mixed results. Looking at 2008, 2011, 2015 and 2018 (the four worst years for U.S. markets since the tech bubble), no more than 35% of all active U.S. equity managers outperformed in any of those years. There were some highlights, including in the much-maligned large value category: active did relatively well in 2008 (keyword: relatively), as PMs wisely avoided the toxic banks; 75% of funds outperformed that year. But the other three down years were essentially a coin flip for large value, with an average of just 46% of managers outperforming during these times.
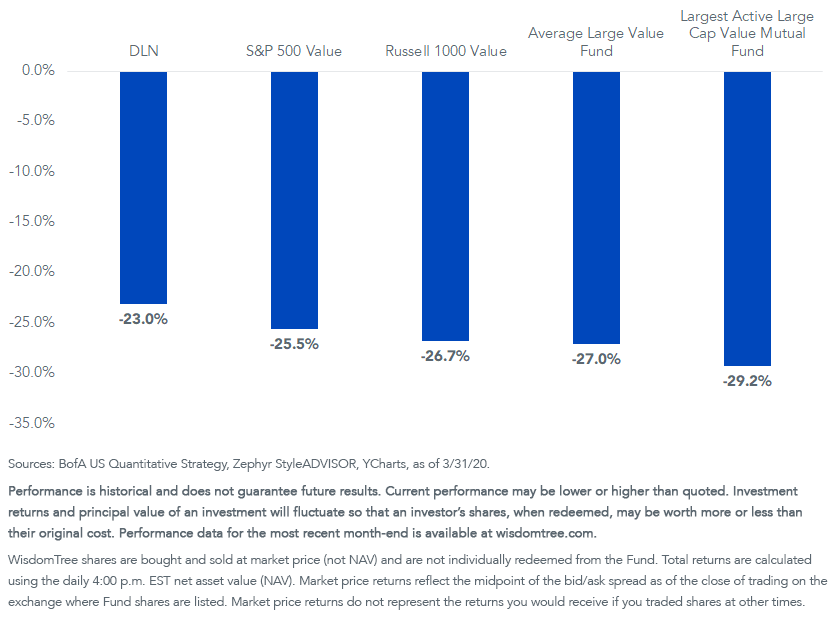
Fast forward to today. The trend of mixed returns from active funds in down markets hasn’t changed in Q1 2020. Only 33% of large value managers beat the S&P 500 Value Index in Q1, with the average fund lagging by 1.7%.1 Case in point: the largest actively managed large value mutual fund lagged the S&P 500 Value Index by nearly 4% on the downside in Q1.2
I believe Ben Johnson, director of global ETF research for Morningstar, said it best:
The idea that active managers as a group will on average outperform the market during bear markets belongs in the same category as the Easter Bunny and Santa Claus…It’s something we all want to believe in, and to some degree take comfort in, but ultimately, it’s fiction.3
If Not Active, What Does Well in Down Markets?
When considering what may outperform in a down market, framing the question of active versus passive misses the point. Instead of focusing on a fund’s structure, investors should think about the underlying investment philosophy.
While active funds have a spotty record of doing well in downturns, one approach that has shown to consistently do well in these types of environments is dividends.
During the down years of 2008, 2011, 2015 and 2018, DLN outperformed the S&P 500 Value Index each year, with an average outperformance at NAV of 4.6% per year. And once again proving its worth in real time, DLN outperformed at NAV by 2.5% in Q1. It’s a small sample size, and outperformance does not imply positive results, but it’s also indicative of the longer trend of top-quartile performance against large-cap value mutual funds, ETFs and benchmarks.
Returns in Q1 2020
For standardized performance of DLN, please click here.
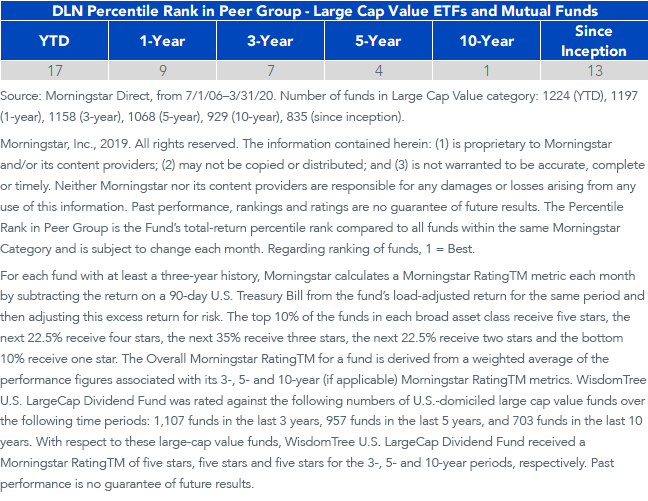
We’ve been writing about the potential for a value outperformance cycle for quite some time, and if we do see a market rebound after the Q1 drawdown, we would expect value to lead the charge. Further, there are now new tax loss harvesting opportunities in the category that have not been available in quite some time. Investors expecting a value resurgence or those unhappy with their existing allocation may be wise to look at DLN – a 5-star Morningstar Overall Rated (as of March 31, 2020) Fund that historically has been a consistent outperformer in a category that has shockingly few of them.
1Lipper Analytical Services; BofA US Quantitative Strategy, 4/3/20.
2YCharts, as of 3/31/20.
3FundFire, “Active Managers Did Poorly Last Year. Can Volatility Save Them?”, 4/8/20.
Important Risks Related to this Article
There are risks associated with investing, including possible loss of principal. Funds focusing their investments on certain sectors increase their vulnerability to any single economic or regulatory development. This may result in greater share price volatility. Please read the Fund’s prospectus for specific details regarding the Fund’s risk profile.
Joseph Tenaglia, CFA, Associate Director, Asset Allocation
Joseph Tenaglia joined WisdomTree as Asset Allocation Strategist in July 2016. As a member of the asset allocation team, he is responsible for building model portfolios and creating custom solutions for portfolio managers and advisors. He is also a member of the committee managing the firm’s ETF model portfolios and helps shape and communicate WisdomTree’s thoughts on the markets. Within the Investment Strategy group, Joseph maintains a particular focus on emerging markets. Prior to joining WisdomTree, Joseph worked at Emerging Global Advisors as an Emerging Markets Portfolio Specialist, where he sat on the firm’s Investment Strategy team, oversaw capital markets, and maintained relationships with client home office research and due diligence teams. He started his career at BNY Mellon. Joseph graduated in 2009 from Boston College. Joseph is a holder of the Chartered Financial Analyst designation.
Editor’s Note: The summary bullets for this article were chosen by Seeking Alpha editors.
Be the first to comment