

jetcityimage
It can be easy, especially in this environment, to underestimate how much the quality of a company can impact share price movements over a relatively short period of time. A great example of this can be seen by looking at W.W. Grainger (NYSE:GWW), a global provider of business-to-business maintenance, repair, and operating products and services. Even though shares of the company were not exactly trading on the cheap, the firm has held up well at a time when the broader market has declined significantly. Much of the reason for this seems to be related to management’s own guidance for the next few years. Truly, if the company can achieve these objectives, then the company deserves the kind of stability that it’s experiencing. But that doesn’t change the fact that, on the whole, the firm does appear to be nothing more than just a decent prospect for the long run.
Robust Performance Continues
Back in April of this year, I wrote an article that took a rather neutral stance on W.W. Grainger. In that article, I found myself impressed by the strength that the company had experienced in the prior few months. This was true from both a fundamental perspective and from a share price perspective. However, I felt as though the stock was more or less fairly valued, leading me to rate the firm a ‘hold’ prospect at that time. Since then, the company has continued to outperform my expectations. While the S&P 500 is down by 15.2%, shares of W.W. Grainger have dropped a more modest 0.5%.
Author – SEC EDGAR Data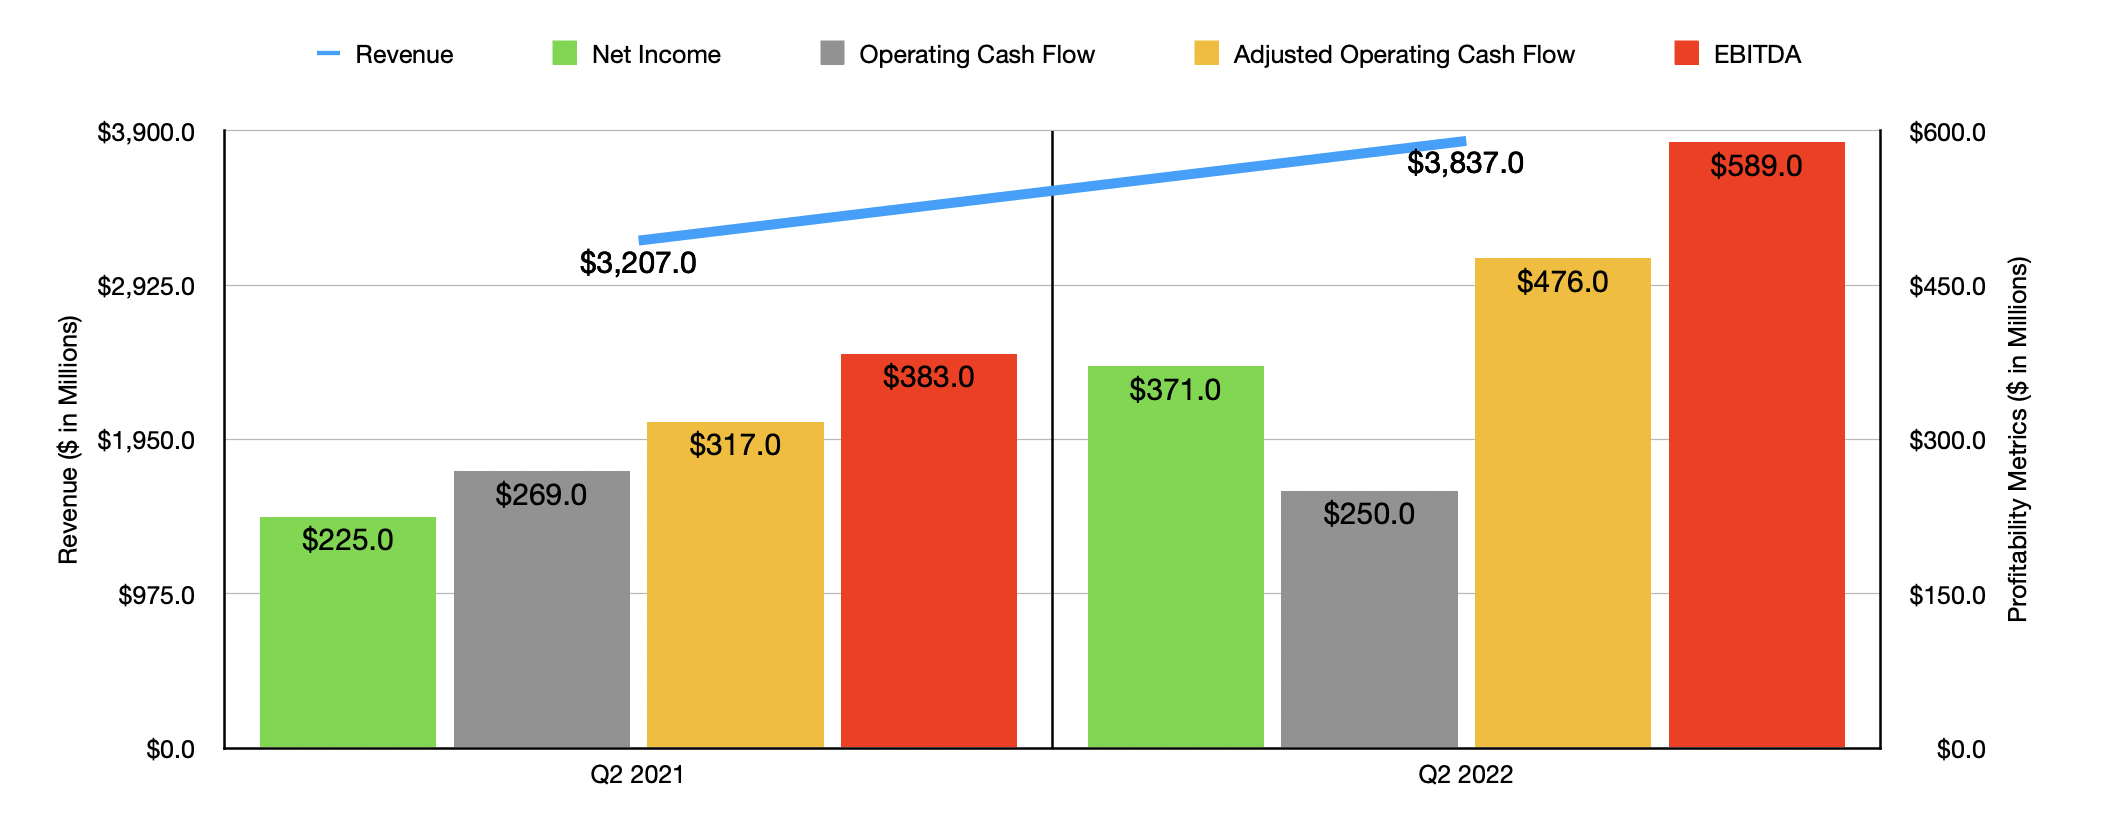
This kind of return disparity has not been without cause. To see what I mean, we need only look at financial results covering the second quarter of the company’s 2022 fiscal year. This is the only quarter for which we now have data that we didn’t have when I last wrote about it. During that quarter, revenue came in strong at $3.84 billion. That’s 19.6% higher than the $3.21 billion generated the same quarter one year earlier. According to management, this increase was driven primarily by growth in the High-Touch Solutions N.A. segment of the enterprise. Sales under the High-Touch Solutions N.A. segment jumped by 22.2%, climbing from $2.50 billion to $3.05 billion. Management attributed much of this to an 11.8% increase associated with volume and product mix. Pricing increases added 10.6% to the company’s top line.
With a strong increase in revenue came a robust increase in profitability. Net income for the company surged from $225 million to $371 million. A sizable portion of this increase was attributed to improved margins achieved by the firm. Its gross profit margin jumped from 35% to 37.6%, this increase, management said, was driven by pandemic-related inventory adjustments in the second quarter of 2021 that, back then, negatively affected profitability. Improved product mix also played a role this year. Other profitability metrics for the company followed suit. Although operating cash flow fell from $269 million to $250 million, this number actually increased from $317 million to $476 million if we adjust for changes in working capital. Meanwhile, EBITDA for the company also surged, rising from $383 million to $589 million.
Author – SEC EDGAR Data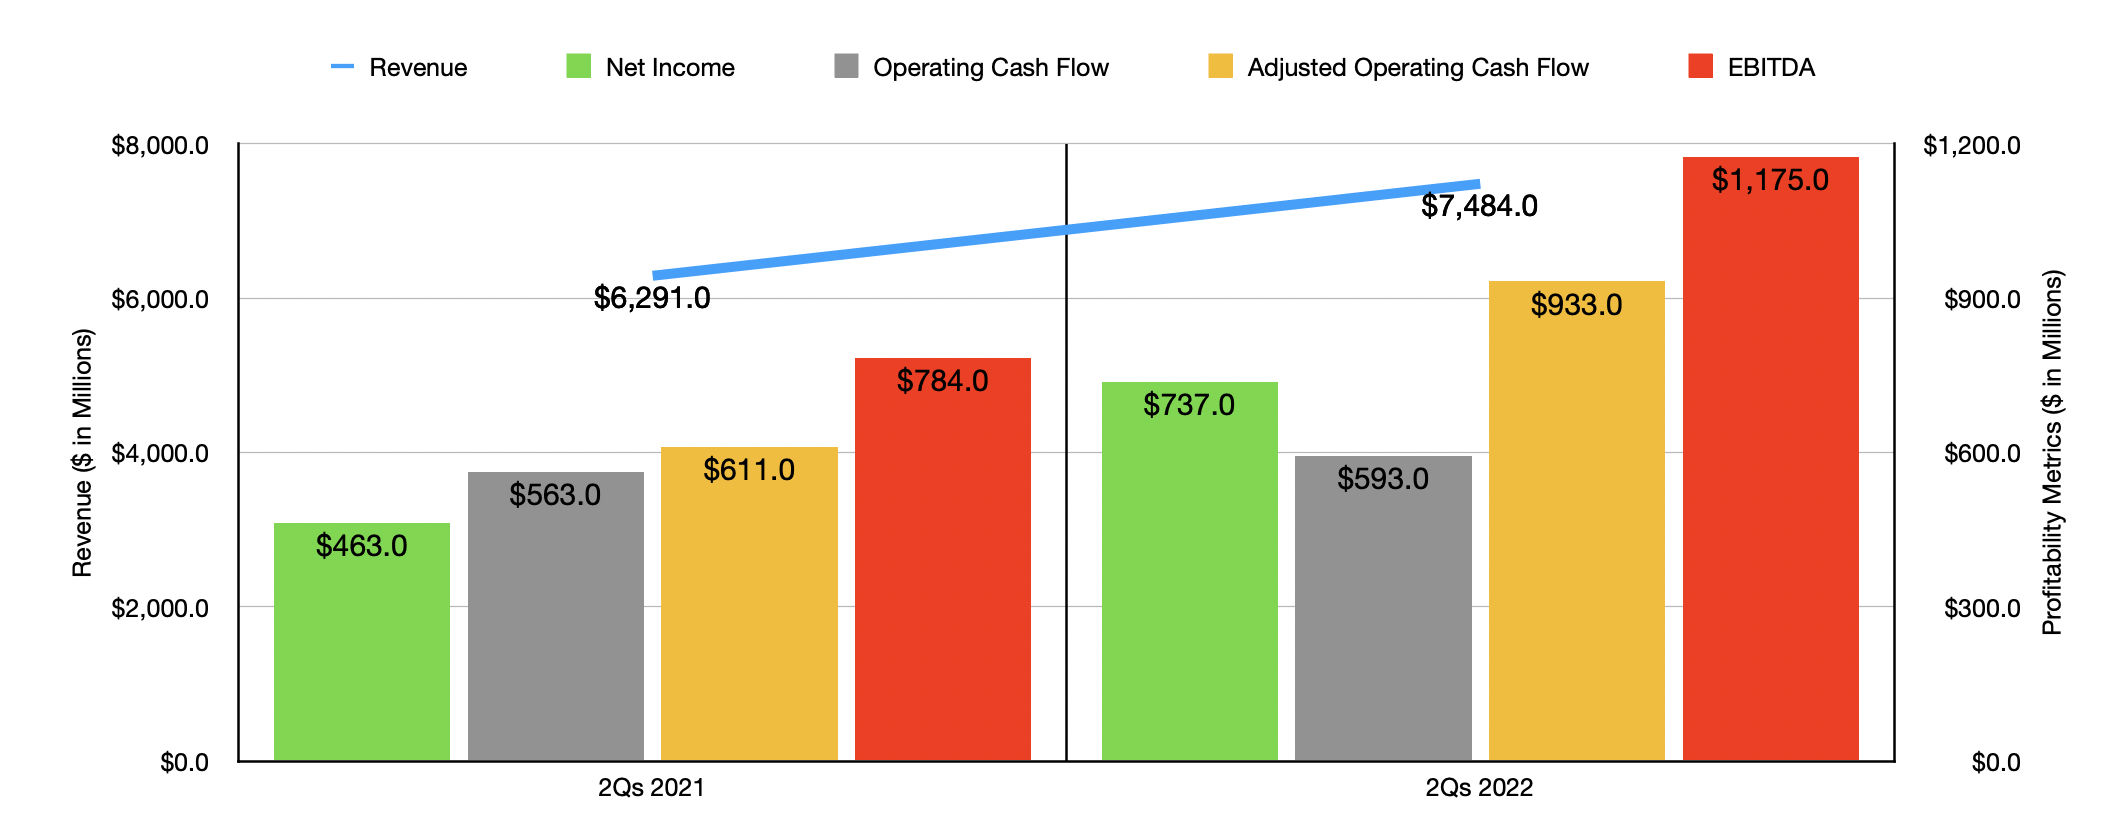
Such strong performance for the company in the latest quarter was instrumental in pushing up total results for the first half of the 2022 fiscal year as a whole. Revenue of $7.48 billion came in 19% higher than the $6.29 billion generated one year earlier. Net income rose from $463 million to $737 million. Operating cash flow went from $563 million to $593 million, while the adjusted figure for this rose from $611 million to $933 million. And finally, we have EBITDA, which increased from $784 million to $1.18 billion.
Author – SEC EDGAR Data
When it comes to the 2022 fiscal year and its entirety, management expects revenue to rise by between 14.5% and 16.5%. That would take total sales for the year, at the midpoint, up to $15.04 billion. Using midpoint figures, earnings per share should be around $28. That would translate to net income of $1.44 billion. Operating cash flow should be around $1.30 billion, while EBITDA, assuming an increase comparable to what should be expected of operating cash flow, should come in at $2.46 billion. Using these figures, we can calculate that the company is trading at a forward price to earnings multiple of 18.2, at a forward price to operating cash flow multiple of 20.1, and at a forward EV to EBITDA multiple of 11.6. These numbers compare favorably to the 25.1, 27.9, and 16.1, respectively, that we get using data from the 2021 fiscal year. As part of my analysis, I also compared the company to three similar firms. On a price-to-earnings basis, these companies range from a low of 23.2 to a high of 39.8. And using the price to operating cash flow approach, the range was between 25.8 and 48. In both cases, one of the three companies was cheaper than our prospect. Meanwhile, using the EV to EBITDA approach, the range was between 12.4 and 26.7, with two of the three companies cheaper than W.W. Grainger.
Although shares of W.W. Grainger look more or less fairly valued compared to similar firms, they do look rather pricey on an absolute basis. However, investors do seem to be more interested in the long run, as they probably should be. Management is currently forecasting continued revenue growth for the company of between 8% and 10% a year, taking sales up to between $19 billion and $20 billion by 2025. Earnings per share by that time, management said, should be around $40, implying net income of $2.05 billion. The company is also forecasting operating cash flow growth of 54% in aggregate, taking the metric to $2 billion by 2025. No guidance was given when it came to other profitability metrics. But if we assume that EBITDA will rise at the same rate, then we should anticipate a reading that year of $3.79 billion. If the company can achieve these targets, it would imply a forward price-to-earnings multiple of 12.7, a forward price to operating cash flow multiple of 13.1, and a forward EV to EBITDA multiple of 7.5. In this case, I would say that shares would look quite attractive. But investors would need to wait awhile for this to play out.
| Company | Price / Earnings | Price / Operating Cash Flow | EV / EBITDA |
| W.W. Grainger | 25.1 | 27.9 | 16.1 |
| Fastenal (FAST) | 39.7 | 48.0 | 26.7 |
| Ferguson (FERG) | 23.2 | 30.2 | 13.7 |
| Ashtead Group (OTCPK:ASHTY) | 33.5 | 25.8 | 12.4 |
Takeaway
Based on all the data provided, it looks to me as though W.W. Grainger is a solid company that is doing well and will likely continue to do well. If you want a stable enterprise and don’t mind the drawback being limited upside potential in the next couple of years, I would say that this is a solid opportunity to consider. But for those wanting capital appreciation, I do still think that the company has limited upside from here relative to what the broader market can achieve. Because of that, I’ve decided to keep my ‘hold’ rating on GWW stock for now.
Be the first to comment