

Lisa Maree Williams
Microsoft is a Joel Greenblatt Favorite
In a previous article, I noted that on an April 2022 episode of Richer Wiser Happier with William Green, Joel Greenblatt opined on what he believed were his top 3 “strongest companies he’s ever seen.” Amazon.com, Inc. (AMZN), Microsoft Corporation (NASDAQ: MSFT), and Google (GOOG, GOOGL) were the three that fell into that bucket. For those unfamiliar with Joel Greenblatt, he created the “Magic Formula” based on metrics for “good” based on ROIC and “cheap” based on earnings yield. The Little Book That Beats The Market outlines this.
The Magic formula screener is one that I use to invest my beta plus side of the portfolio along with the DJIA, geared at matching or beating the market by a thin margin, while also being diversified across several high-quality companies purchased 30-50 stocks at a time. Microsoft is a consistent ROIC out-performer, investing its debt and equity very efficiently, which is reflected in forward revenue and earnings. Although the overall tech sector has been beaten down, a few companies continue to be high quality, set it and forget it names to lock away in the safe. I currently quad-furcate my anti-bubble tech portfolio across 4 names, Amazon, Microsoft, Google, and Meta Platforms (META). These names remain the strongest in terms of balance sheet and the ability to internally compound their earnings. I am not, however, of the opinion that all tech is cheap. I am staying away from being long Invesco QQQ ETF (QQQ).
Microsoft at these levels is a buy from my analysis below. I will be evaluating Microsoft on a PEG ratio looking at the trailing 5 years’ EPS, EBITDA, its return on invested capital, free cash flow, and amazing balance sheet.
What they do
We generate revenue by offering a wide range of cloud-based and other services to people and businesses; licensing and supporting an array of software products; designing, manufacturing, and selling devices; and delivering relevant online advertising to a global audience. Our most significant expenses are related to compensating employees; designing, manufacturing, marketing, and selling our products and services; datacenter costs in support of our cloud-based services; and income taxes.-Microsoft 2022 10 K
Return on Invested Capital
Microsoft achieved a fiscal year ROIC of 32.16% versus an industry average of 16.38%. Getting a 32% return on capital invested is impressive in the face of a recessionary environment. Even though software/cloud computing by nature is a high-margin business, these are excellent numbers nonetheless. By this first metric, we can already see why Joel Greenblatt loved this name during his April interview when the price was closer to $300. If companies can maintain a high return on invested capital such as Microsoft has demonstrated, we can be confident that forward years’ revenue and earnings will continue to show growth.
Top and bottom lines are still growing
Microsoft is in the minority of tech companies at the moment that are still showing growth on the top and bottom lines:
yahoo finance
We can observe from the above, 2022 revenue grew $30 Billion YOY, a growth rate of about 18% with bottom line EPS growing at 19.46%.These are 2022 numbers that face high-interest rates and the retracement in earnings of several cyclical names in the stock market. Microsoft is still beating earnings consistently the last 4 quarters except for Q2 2022. That’s quality.
EPS trends MSFT (yahoo finance)
Peg ratios on a GAAP and Non-GAAP basis
My favorite way of looking at growth names in tech and turnaround stories is using Peter Lynch’s version of the PEG ratio. The PEG ratio assumptions he used at the Fidelity Magellan Fund were based on trailing earnings versus forward projections. Often I will look at the metric both on a GAAP and a non-GAAP basis to see if value is hidden “under the hood” so to speak. Sometimes EBIT or EBITDA reveal something when GAAP metrics do not tell the full story. In Microsoft’s case, they are growing their GAAP earnings at a faster clip than non-GAAP, unique for a tech company.
Looking at this metric from a GAAP perspective, earnings 5 years ago were $2.15 a share and finished 2022 at $9.7 a share, a CAGR of 35.17%. As the PEG ratio finds value when the P/E divided by the growth rate hits a sub-1 ratio, we can use the CAGR percentage, dropping the percent sign as our multiplier and TTM EPS as the multiplicand. Peter Lynch’s methodology also bumps up the multiplier by the dividend, which in Microsoft’s case is 1.1%(1.1). TTM EPS for Microsoft is $9.29, thus we have (35.17+1.1) X 9.29 = $336.95.
To account for a more recent perspective, I’ll drill down on just the last 3 years. In 2020, Microsoft had earnings per share of $5.82 and our terminal EPS will still be $9.7 in 2022. In the most recent 3 years’ growth, we get a smaller value of 18.56%. That would provide a low end of $190.7 ((18.56+1.1) X 9.7). The average of the two values is $263.83.
If we look at non-GAAP EBITDA per share we see growth similar to the previous 3 years in GAAP earnings but a higher multiplicand. Microsoft finished 2022 with $99.9 Billion in EBITDA and had $45.26 Billion 5 years ago. This is a CAGR in EBITDA of 17.16%. With 2022 EBITDA at $99.9 Billion and 7.4 Billion shares outstanding, this gives us an EBITDA per share of $13.5. Using 17.6+1.1 as our multiplier and $13.5 as the multiplicand, we get $252.45 a share fair value on a non-GAAP basis.
This analysis reveals that depreciation and amortization trends 5 years ago were increased versus recent trends. This resulted in a low starting number 5 years ago on the GAAP EPS trend versus the non-GAAP EBITDA trend, creating an accelerated and possibly over exaggerated growth. It seems that the true earnings growth rate is closer to 18%. With EBITDA $27 Billion higher than GAAP net income of $72.73 Billion for 2022, there is still hidden compounding under the hood. We’ll observe below that Microsoft is a big spender on R&D, thus we don’t want to short change them on the multiplicand adhering to a strictly GAAP basis.
Microsoft has shown staggered growth in the last 5 years on a GAAP basis, going from $2.15-$5.11 from 2018-2019, then slowing to $5.11-$5.82 from the years 2019-2020. However, they then stepped up a monster year in 2021 growing from $5.82 to $8.12. The staggered growth shows that Microsoft can grow in spurts, even at the large market capitalization. An average of the GAAP trailing 5-year value that incorporates an ultra-high growth rate of $336.95 and the non-GAAP trailing 5-year growth rate of $252.45 seems appropriate, leading to a high value of $294.7.
I agree with Peter Lynch when looking at PEG ratios, don’t be overly optimistic about earnings growth rates over 25%. Therefore I would discard the ultra-high growth rate price target of $336.95 which incorporates an earnings growth rate of 35.17%. Setting a low-end price of $252.45 (the PEG ratio based on trailing 5 years EBITDA growth) and a high-end of $294.7-(the blended ultra-high growth rate price target and trailing 3 year normalized CAGR growth rate price targets on a GAAP basis) seems more logical. Microsoft has demonstrated that it can beat 25% earnings growth over 5 years in staggered fashion. With a current trailing P/E ratio of 26, the stock is priced right around where we could expect it for max logical forward growth.
Research and Development
Research and Development Trends (macrotrends.net)
Like the other 3 in this group of tech titans, Microsoft is no slouch when it comes to R&D spending. Touching $25 Billion in R&D for 2022, this tax-sheltering vehicle is one of the determining factors that lead companies to achieving a high ROIC through new innovations and product improvement. With this expense needing to be capitalized going forward, it will be interesting to see the effect that it will have on GAAP earnings versus EBITDA.
The debt and cash trends
yahoo finance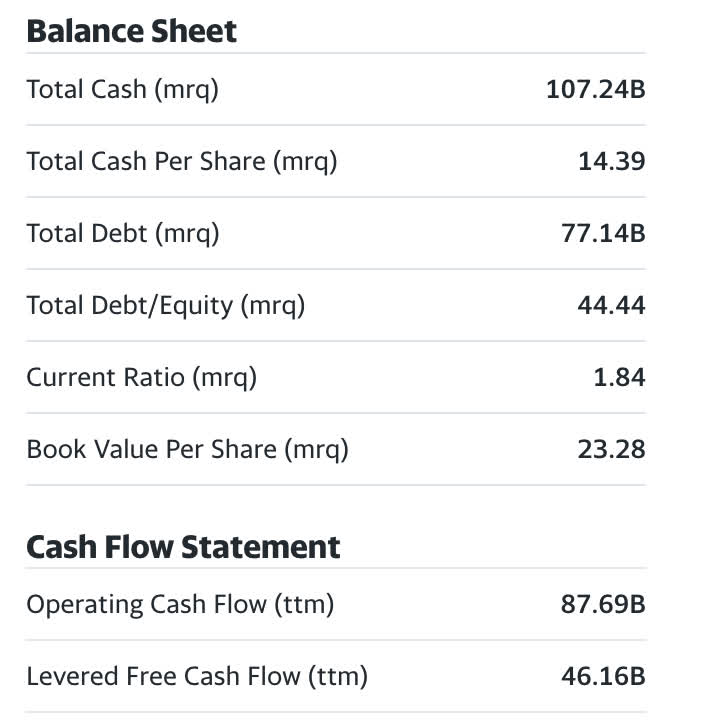
With $107 Billion in cash and cash equivalents, Microsoft is one of the best-capitalized companies in the entire stock market. With Google and Berkshire Hathaway (BRK.B, BRK.A) being the only other companies to cross the $100 Billion war chest watermark, this is not an easily achievable feat. Microsoft has a debt-to-equity ratio of only 44% and a current ratio of 1.84, boasting one of the strongest balance sheets in the entire stock market. If this was fantasy football, Microsoft would be a bell cow running back drafted in the first round!
yahoo finance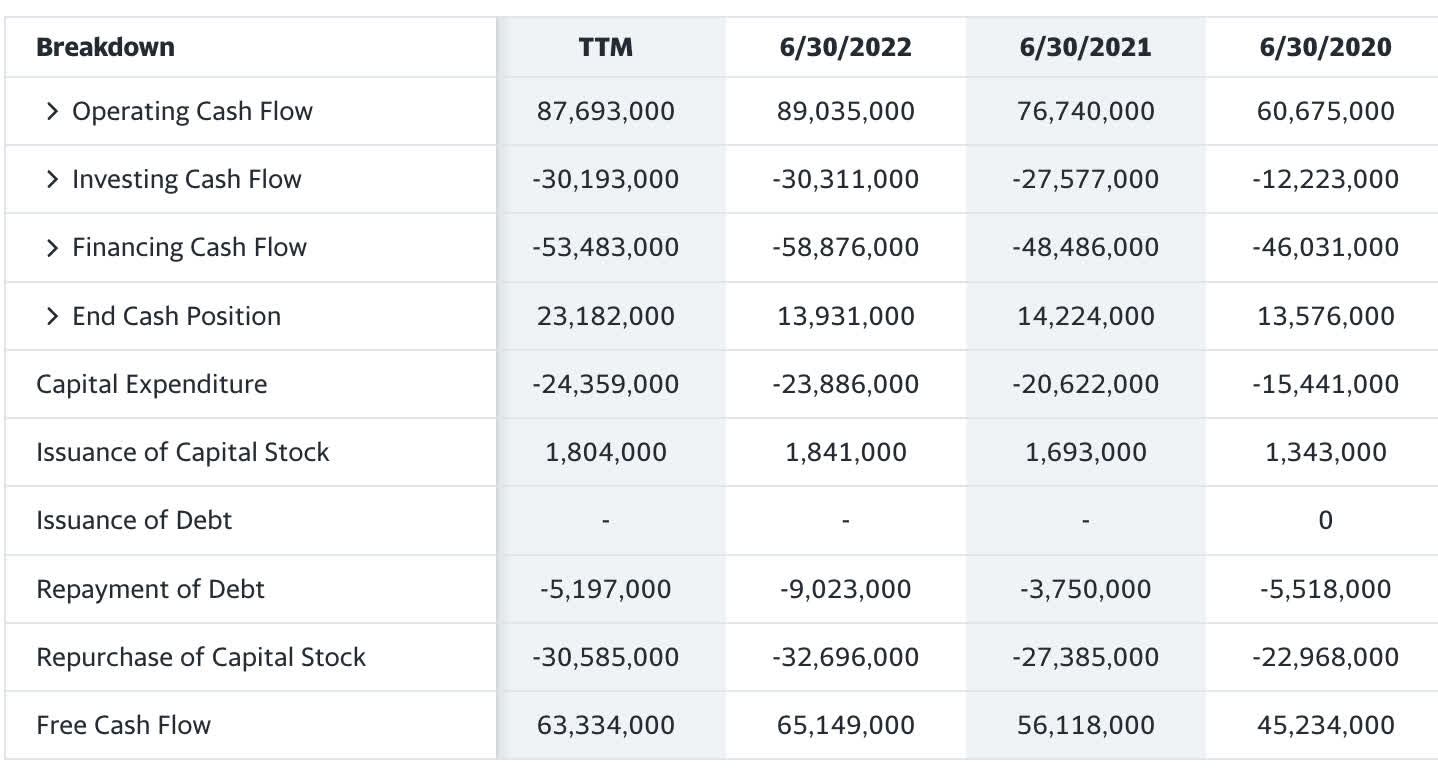
The last 3 years have seen Microsoft grow its free cash flow from $45.2 Billion in 2020 to $65 Billion in 2022, a CAGR of 13%. It’s no mistake to see why Microsoft has so much cash in the bank, when you’re generating $60 Billion plus in free cash flow, saving $20 Billion here, $30 Billion there is not a stretch.
yahoo finance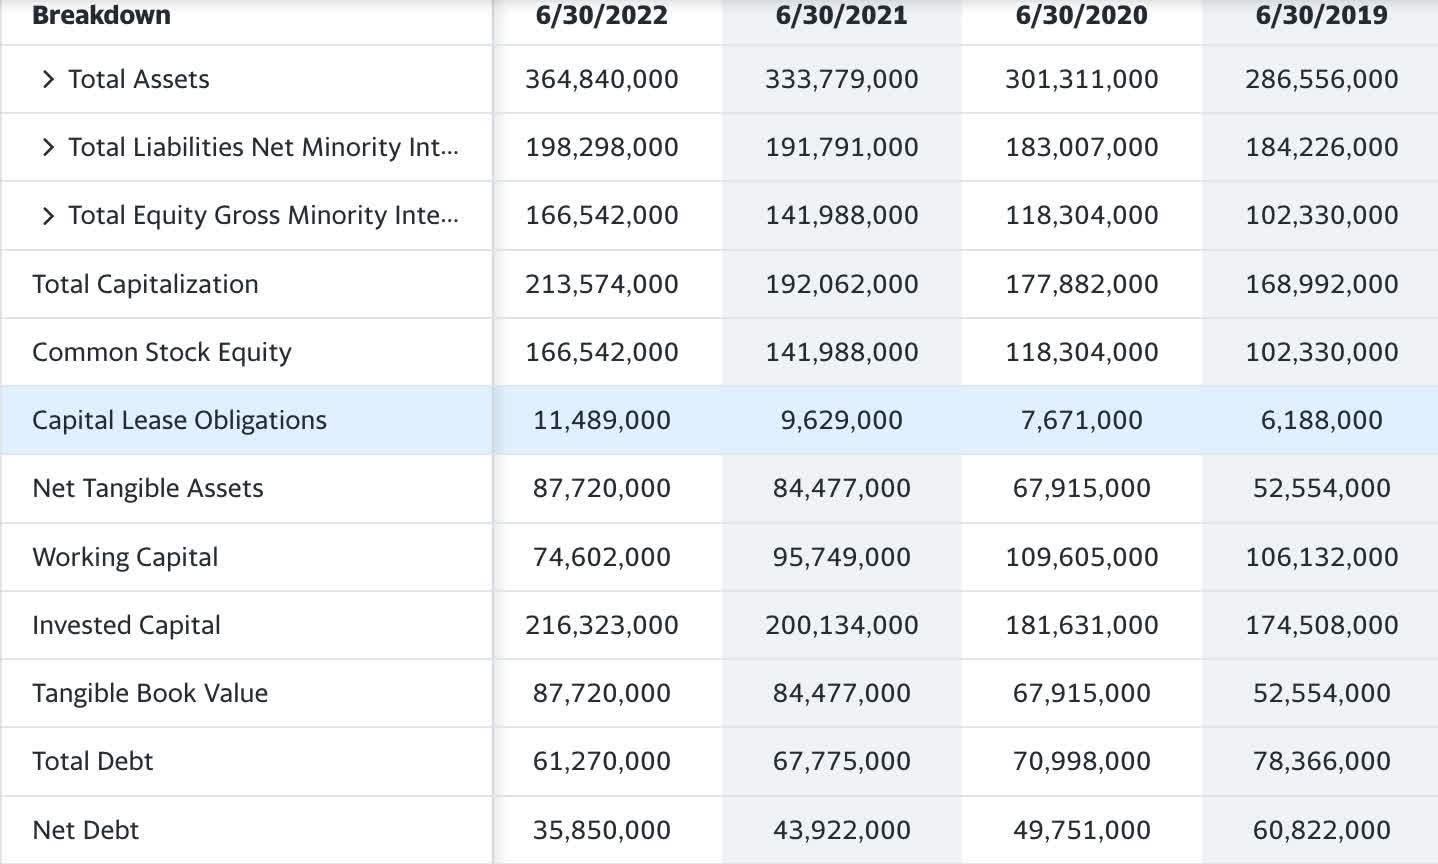
Digging into Microsoft’s balance sheet, we see two positive trends. Total debt has declined from $78.3 Billion in 2019 to $61.2 Billion in 2022. Total assets have increased by nearly $100 Billion in this time frame as well. Although cash and cash equivalents declined slightly from 2019, where it stood at $133 Billion versus $104 Billion MRQ, total assets increasing for a company heavily reliant on intangible IP creation more than makes up for any decrease in cash. This fits within the Peter Lynch definition of a positive story. Debt is decreasing while cash and assets are trending upwards.
Activision effect on cash
The deal to purchase Activision Blizzard, Inc. (ATVI) is $68.7 Billion, all cash. We can assume that the lion’s share of the purchase will come straight out of cash and cash equivalents, so that $100 Billion war chest may be reduced significantly. The 2022 10K filing did not indicate what percentage they intend to finance with cash and how much with debt. The net effect after closing in 2023, will probably take cash and cash equivalents well under $100 billion and increase total debt proportionate to how much they want to use to complete the transaction. The variable will be a combination of WACC at that time considering the cost of capital in the market and how much cash they intend to keep around in case the economy takes a turn south.
The dividend
With a forward annual dividend of $2.72 a share and 7.4 Billion shares outstanding, Microsoft has a forward dividend liability of $20.12 Billion. With over $60 Billion in free cash flow TTM, the dividend is covered at least 3 X and has plenty of room to grow. Similar to Apple (OTC:APPL), the dividend coverage is so large that stocks like these may present amazing dividend increase upside held long term should these companies one day become slow-growth behemoths. With less need for retaining earnings to grow R&D and spend on growth projects, the next best investment could be buybacks and capital returns to shareholders through dividend increases.
Catalysts
Microsoft performance highlights from their 2022 10K regarding sources of revenue and income:
Highlights from fiscal year 2022 compared with fiscal year 2021 included:
• Microsoft Cloud (formerly commercial cloud) revenue increased 32% to $91.2 billion.
• Office Commercial products and cloud services revenue increased 13% driven by Office 365 Commercial growth of 18%.
• Office Consumer products and cloud services revenue increased 11% and Microsoft 365 Consumer subscribers grew to 59.7 million.
• LinkedIn revenue increased 34%.
• Dynamics products and cloud services revenue increased 25% driven by Dynamics 365 growth of 39%.
• Server products and cloud services revenue increased 28% driven by Azure and other cloud services growth of 45%.
• Windows original equipment manufacturer licensing (“Windows OEM”) revenue increased 11%.
• Windows Commercial products and cloud services revenue increased 11%.
• Xbox content and services revenue increased 3%.
• Search and news advertising revenue excluding traffic acquisition costs increased 27%.
• Surface revenue increased 3%
This giant conglomerate of cloud services, licensing, data collection, and video games are impressively diverse. While not all revenues hit the bottom line, in the end, the diversity of revenue is superior to the other 3 names in my big tech bucket. If and when the Activision deal closes, that could present another nice long-term catalyst for Microsoft depending on how they improve the business and if it translates to more Xbox content and services revenue. My guess is that it does go through and we see improvements in YOY Xbox revenue by the end of 2023 or early 2024.
Risks
The cloud business is highly competitive, with Amazon and Google all competing in the same space. I’m not personally sensitive to who wins the battle as I try to own all those names in equal amounts. What I am sure of is that this is the group that will have the cloud services leader in any given year for the next decade. With that in mind, my hedge in owning them all lets me sleep well at night. A repositioning that puts Microsoft clearly behind either of the two could create negative price action. As much of the cloud-based services rely on collaborative office teams using the licenses and services, a recession that results in a decrease in cloud-based service demand will affect every company in this bucket.
Summary
Microsoft rounds out my quartette of the anti-bubble tech bucket. Included are Meta, Microsoft, Google, and Amazon. Meta is the most volatile of the bunch. They have a strong balance sheet but are destroying near-term value through metaverse spending. Luckily they have a long runway and great free cash flow to get them through. Amazon has a huge moat through its low-margin e-commerce business that makes it almost impossible for competitors to breach. Huge revenue and a high margin behemoth in AWS make them a fascinating amalgamation. Its one pitfall is negative free cash flow due to heavy CAPEX in the near term.
Then we have Google and Microsoft. Both stand out for maintaining the top and bottom line growth (Google has slowing growth on GAAP eps but still increasing EBITDA), have steady free cash flow, low debt, and great leadership. Microsoft might hold a slight edge as they are software and cloud centric versus ad revenue heavy, facing fewer headwinds in this macro environment where advertising may be the first business expense to get hit.
Microsoft is being priced for perfection at 26x earnings. Looking at the PEG ratio, logically speaking, a company growing earnings at higher than 25% a year is not probable in the long run. Buying any company at higher than 25x GAAP or non-GAAP earnings could be unwise. Microsoft has demonstrated a 5 year trailing period of very high growth with a slowing in the near term. They have a consistently strong ROIC, I’m happy to take a crack at it when the price hits my price target even though the P/E indicates a slight breach of the forward earnings growth rate possibilities. This is a high-quality blue chip from all angles, I’ll take it at a price that’s good enough rather than dirt cheap.
The 27% downturn has finally put Microsoft in a spot where I have started to place outsized bets outside of my DJIA beta-centric self-indexing strategy. The stock is a buy in my opinion at these prices with a price of $252 on the low end and $294 on the high end. Many of us have been waiting for a pullback on Microsoft for quite some time, and this is the moment we have been waiting for. Being attached to the long-duration tech narrative that they “must” perform poorly as interest rates rise could give us even better prices than this. Microsoft CEO Satya Nadella is doing an excellent job steering the ship. I’m locking this one up in the safe with the other three members of the quartette. Together they sing a lovely tune.
Be the first to comment