

Kwarkot/iStock via Getty Images
Q3 recap and investment thesis
W. P. Carey (NYSE:WPC) recently released its 2022 Q3 earnings report (“ER”). Overall, the company delivered a strong quarter. The results exceed consensus estimate expectations on both lines. Its Q3 adjusted FFO (“AFFO”) per share dialed in at $1.36, exceeding the consensus estimate average of $1.26 by a whole 10 cents. Its revenue came in at $382.08M, translating into an annual growth rate of 19.1% and also beating consensus estimates (by $11.9M). Notably, its same-store rent reported record growth rates driven by inflation. The reason involves that the majority of its leases are linked to CPI and almost 100% of its leases include an inflation escalator factor.
Source: WPC Q3 ER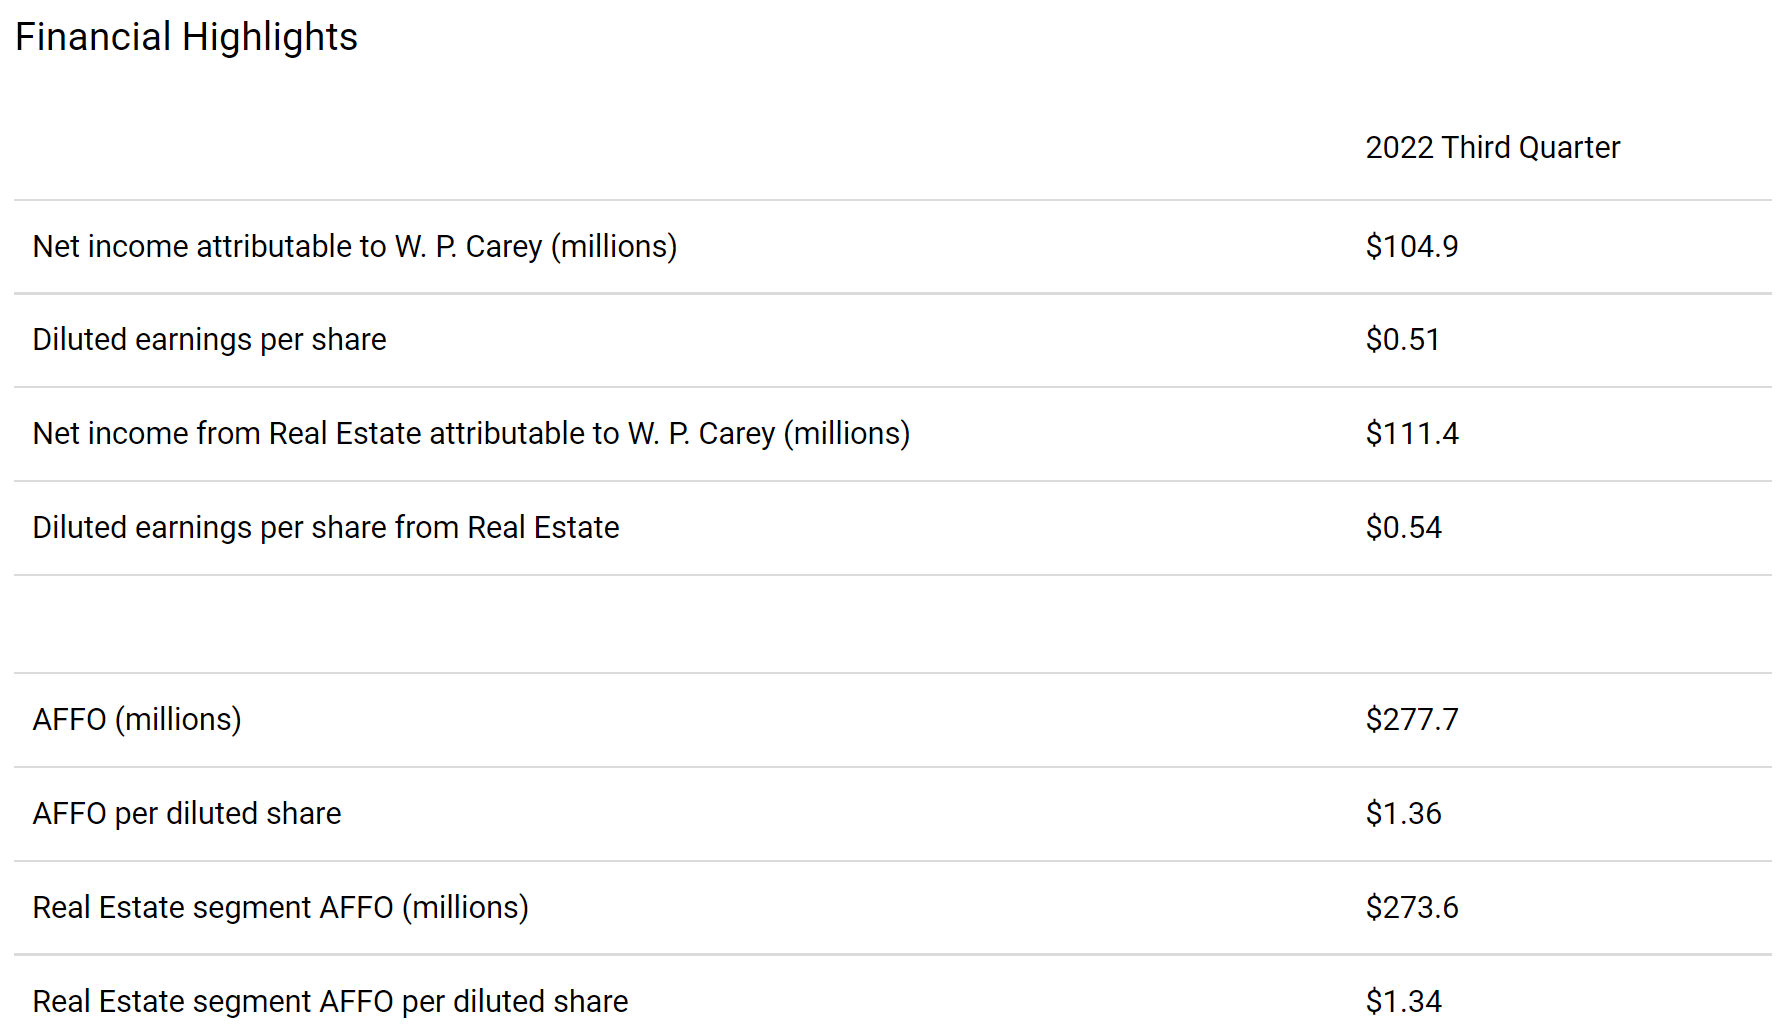
Looking ahead, I see healthy growth to persist both thanks to its inflation resistance, active investment activities, and also strong property portfolio. In particular, its rents are scheduled for raises over the next few quarters and therefore strong earnings are expected. During the Q3 ER, management lifted 2022 full-year AFFO guidance to a range between $5.25 and $5.31 per diluted share. As CEO Jason Fox commented in the ER,
“As current CPI numbers flow through to rents, we expect our same-store growth to move even higher in 2023, and to continue seeing the benefits into 2024,”
On the acquisition front, investment activity remains very high. Early in the year, it had invested $476 million in the second quarter and $300 million in July alone. Management expects $1.5 billion of additional investment in full-year 2022 and Q3 activities are on track to hit this target. In particular, it has completed the $2.7 billion merger with CPA:18, the last of its captive REITs. CPA:18 added ~$2.0 billion in assets and brings onto the balance sheet a well-diversified net lease portfolio.
Despite the strong fundamentals and some price rallies since the Q3 ER, the shares are still attractively priced. And next, you will see the attractiveness of its valuations confirmed by two different approaches: the usual AFFO multiples and also an independent approach based on its asset.
AFFO multiples remain attractive
As mentioned above, its 2022 full-year AFFO guidance was raised to a range between $5.25 and $5.31 per diluted share. At its current price of ~$80 as of this writing, this translates into a P/AFFO multiple of about ~15x (15.1x at the high end of the AFFO guidance and 15.2x at the low end).
The chart below shows that the stock has been historically priced around 15.8x its AFFO. As seen, its P/AFFO multiples have fluctuated in the past 5 years between 9.2x and 22.3x with an average of 15.82x. Thus, its current P/AFFO is a bit below its historical average (by about 4%), signaling a slight undervaluation.
Source: YCharts data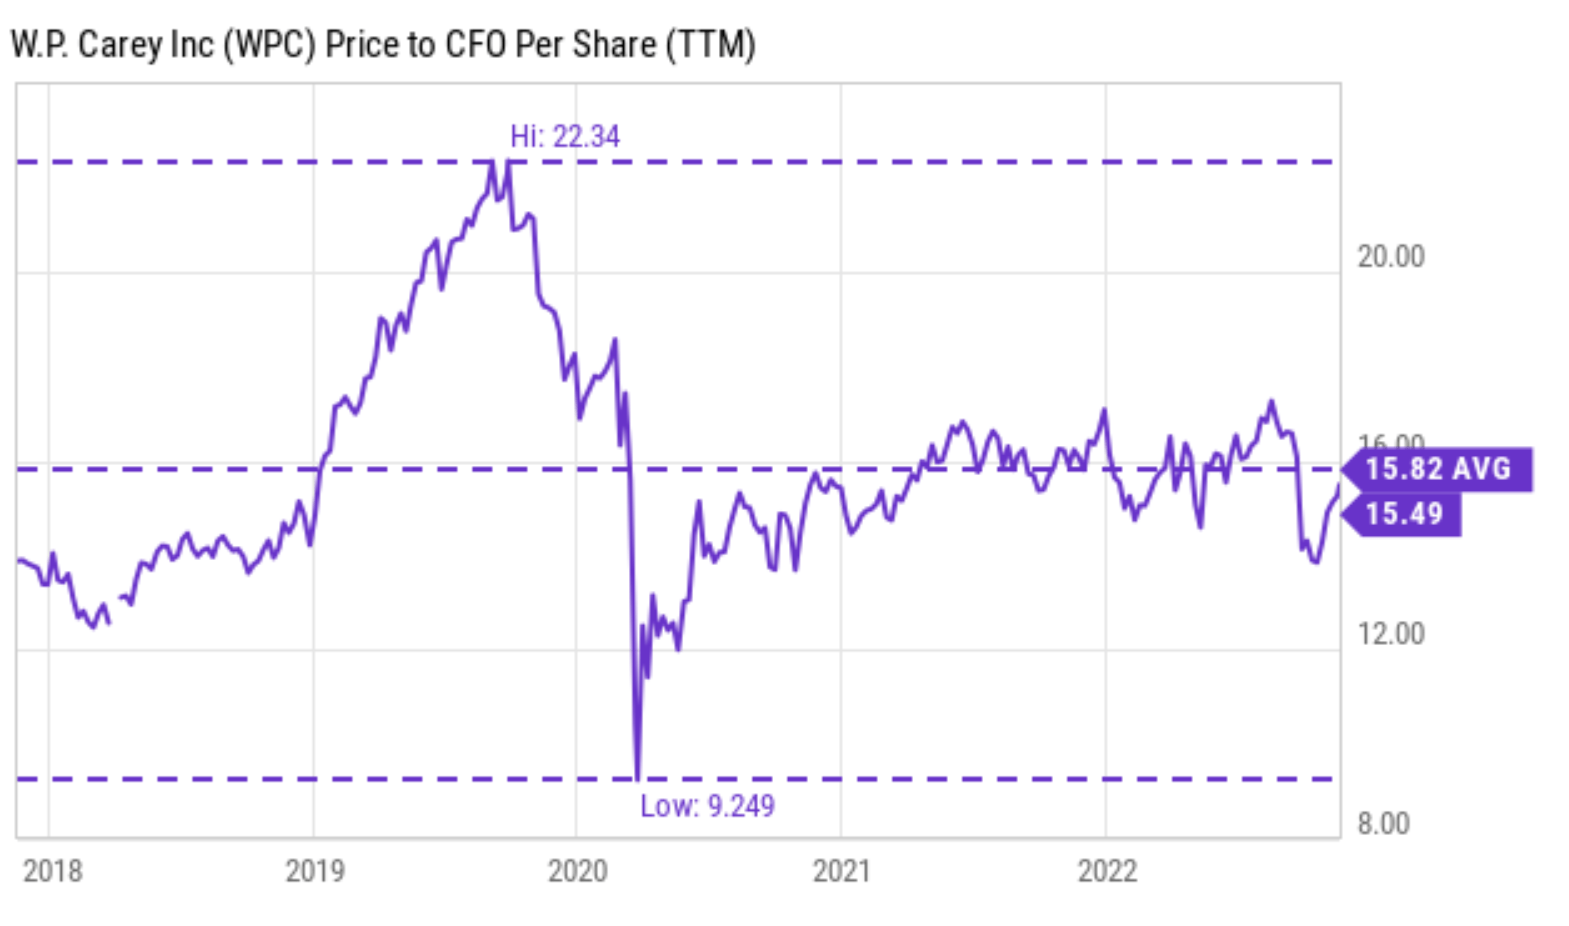
An independent asset-oriented valuation
For REIT stocks, another effective approach is to value the worth of its asset and rent income. As detailed in our earlier article:
If you think like a long-term business owner (instead of a stock trader), then investing in REIT is nothing more than buying a piece of real estate property to collect rent. Thus, the investment value consists of two parts: the value of the property itself and the future rent.
Our valuation method approximates the first part by its book value (“BV”) and the second part by 10x of its dividends. In other words, the investment value (“IV”) of a REIT stock should be:
IV = BV + 10 x dividend
This method offers the advantage of valuation anchored in the most easily obtainable data with the least amount of uncertainty: BV and dividend. In investing, we always prefer the use of a few data points that are reliable than many data points that are less reliable.
Hope the above is intuitive. In my mind, this approach is actually more intuitive than the AFFO approach given the fundamental nature of REITs – own a piece of property to collect rents. And let’s see how it works on WPC.
The chart below illustrates how well the approach works on WPC. As you can see, the IV computed this way captured price actions closely in the long term. Note that WPC was not a REIT business till its conversion in 2012. Therefore, it made sense that the price movements before 2012 were not captured by the IV computed this way. But after the conversion, its price fluctuates around the IV like a dog on its leash. Whenever its price deviated too far from the IV, it had been a good opportunity to either sell or buy.
Note that in the computation of its IV, a multiplier, M, was to the BV. Hence, its IV was computed as M*BV + 10 x dividend. The basic idea is simple. Some REITs (like WPC) can collect higher rents than others, so their property should be more worthy and the M factor is to adjust for such differences. The details are again in our earlier article. To wit, the M factor for WPC here was ~1.61. WPC earns on average $0.19 of AFFO on each dollar of its TBV (tangible book value). In other words, its AFFO return on equity is around 19%, compared to about 15% for average REITs. Hence, M = (19%/15%)^2 = 1.61.
Its current IV based on its TBV ($28.67 per share) and FW dividend ($4.24 per share) stand at $88.8. At its current price of $80, it is about 10% discounted, quite similar to the assessment from the AFFO approach.
Author based on Seeking Alpha data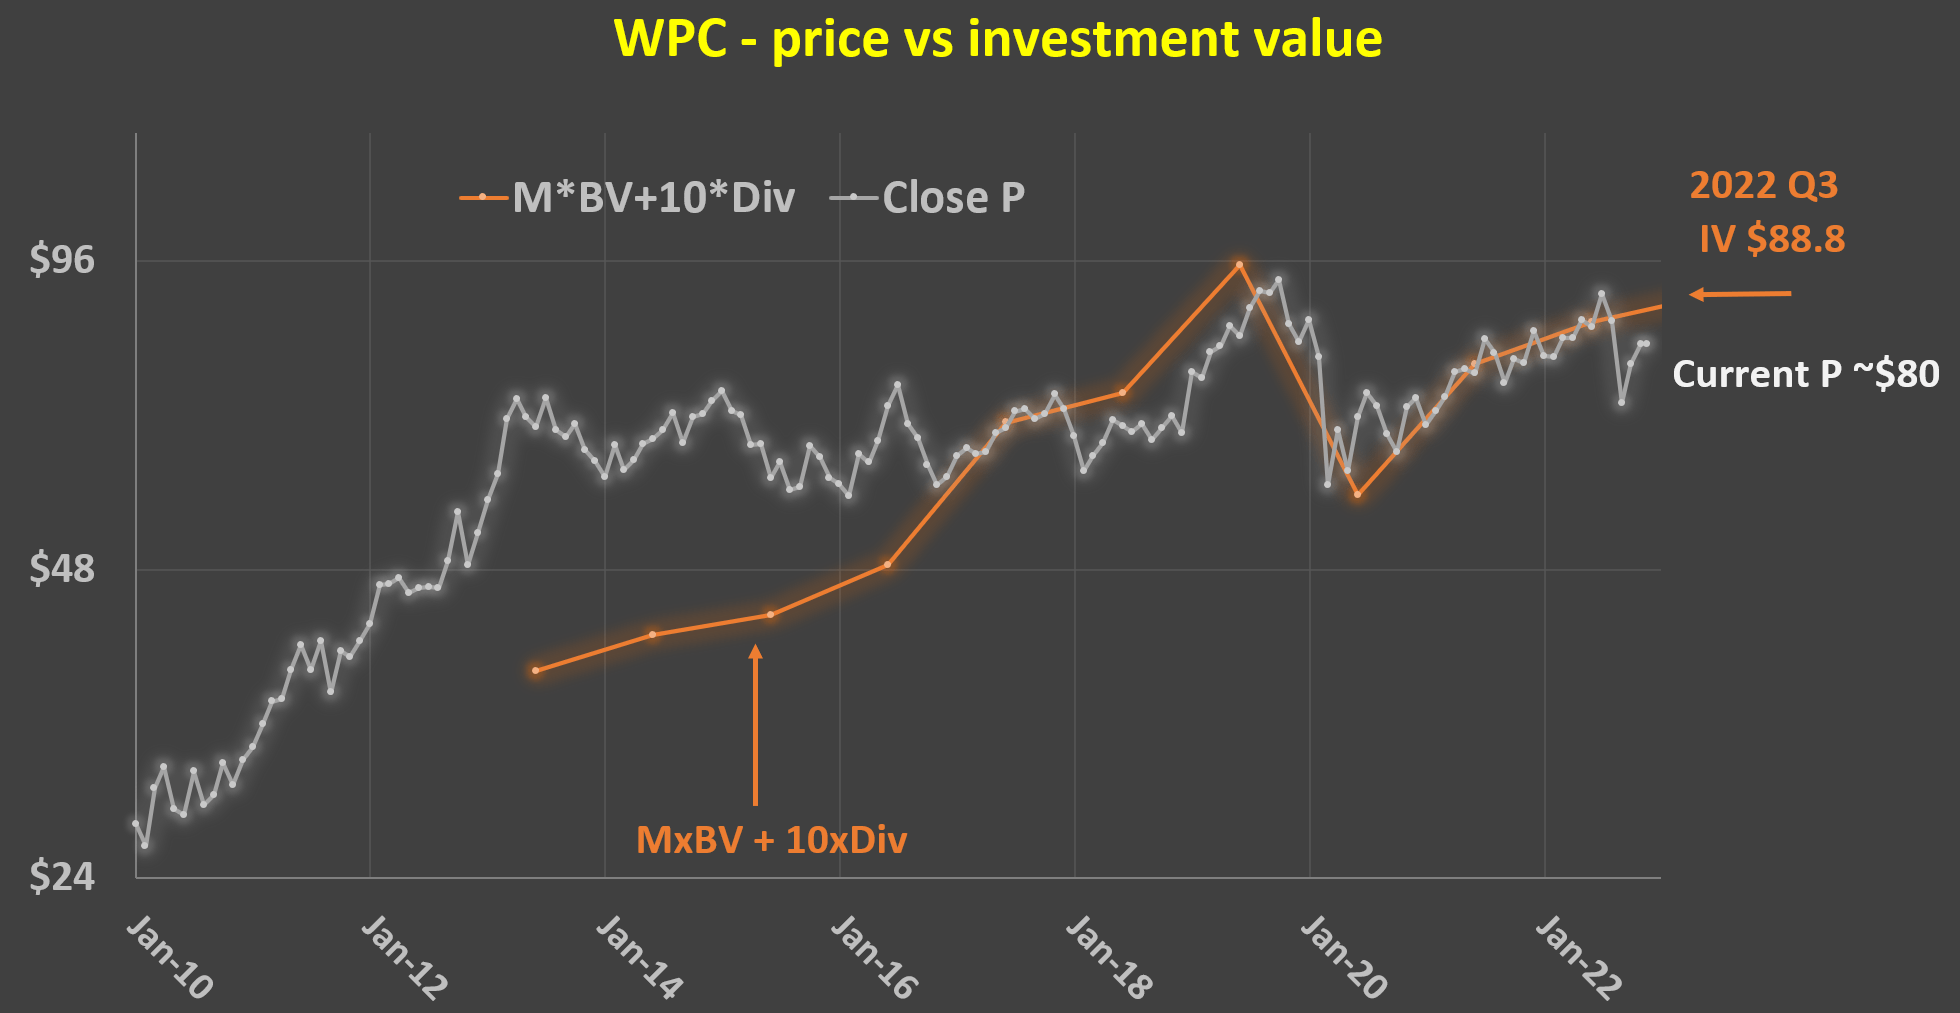
WPC’s potential returns
The chart below shows my estimates of its projected return based on its business fundamentals and valuation metrics discussed above. To recap, in terms of AFFO multiples, the stock is about 4% undervalued. And from the asset+income approach, it is about 10% undervalued. For the next 3~5 years, I am assuming a 7% annual growth rate considering the rent escalation and reinvestment rates. And my projections also assumed a valuation revision to the historical mean. Based on these assumptions, the total return in the next 3~5 years is projected to be in a range of 28% (the low-end projection) to about 37% (the high-end projection), translating into a healthy 6.3% to 8.2% CAGR.
Author based on Seeking Alpha data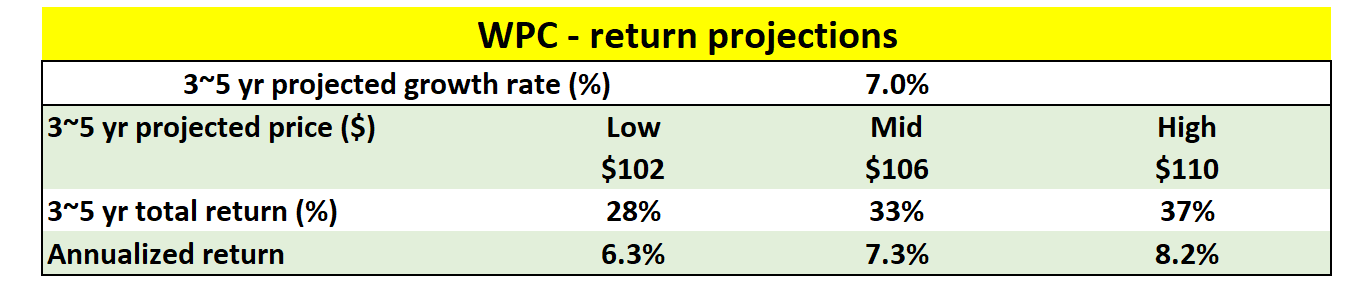
Risks and final thoughts
I do not see any structural risks. There may be some temporary speedbumps ahead though. The main risk is the interest rate risk. The business relies on leverage to a great extent (as all REITs do). And the good news for WPC is that most of its existing debt is fixed rate and well-laddered in the long term. But the bad news is that, as aforementioned, the company invests very actively, and it has to keep raising capital. For example, to fund its investments for 2022, it had to raise capital by forward equity sales and also debt issuance. As such, there’s always the risk that the new capital is raised at higher borrowing costs if the treasury rates keep climbing.
All told, WPC delivered a strong Q3. Results beat consensus estimates on both lines. And its full-year guidance is lifted for good reasons. Looking ahead, I see several catalysts to maintain a healthy growth rate in the 7% range, including its inflation-linked rents, active investment activities, and also the integration of the CPA:18 portfolio. In terms of valuations, its current price is at a discount, somewhere between 4% to 10%, as shown by two independent approaches. Combining the growth potential and the valuation discount, the total return in the next 3~5 years is projected to be in a range of 28% to 37% (translating into a healthy 6.3% to 8.2% CAGR).
Be the first to comment