

Alistair Berg
Dividend-paying stocks often draw in capital whenever a bear market unfolds. This is because investors opt to hedge their price-return bets with total-return investments. In essence, risk aversion creates a “sure income” seeking environment instead of a speculative financial market climate.
During my time as a Seeking Alpha contributor, I’ve repeatedly reiterated the popularity of bear market dividend investing. I’ve also reaffirmed the importance of managing drawdowns, as long-term alpha isn’t achieved only by beating a bull market but also by losing less money than the broader market whenever the chips are down.
Based on the year-over-year factor performance, dividend investing has clearly been the way to go, as it’s beaten most investment categories. I’m going to be pragmatic and set a buy rating on the Vanguard High Dividend Yield ETF (NYSEARCA:VYM), as I believe the exchange-traded fund’s (“ETF”) profile aligns with the theoretical underpinnings of rotational portfolio management.
Double Click On The Chart To Enlarge (Source: Seeking Alpha)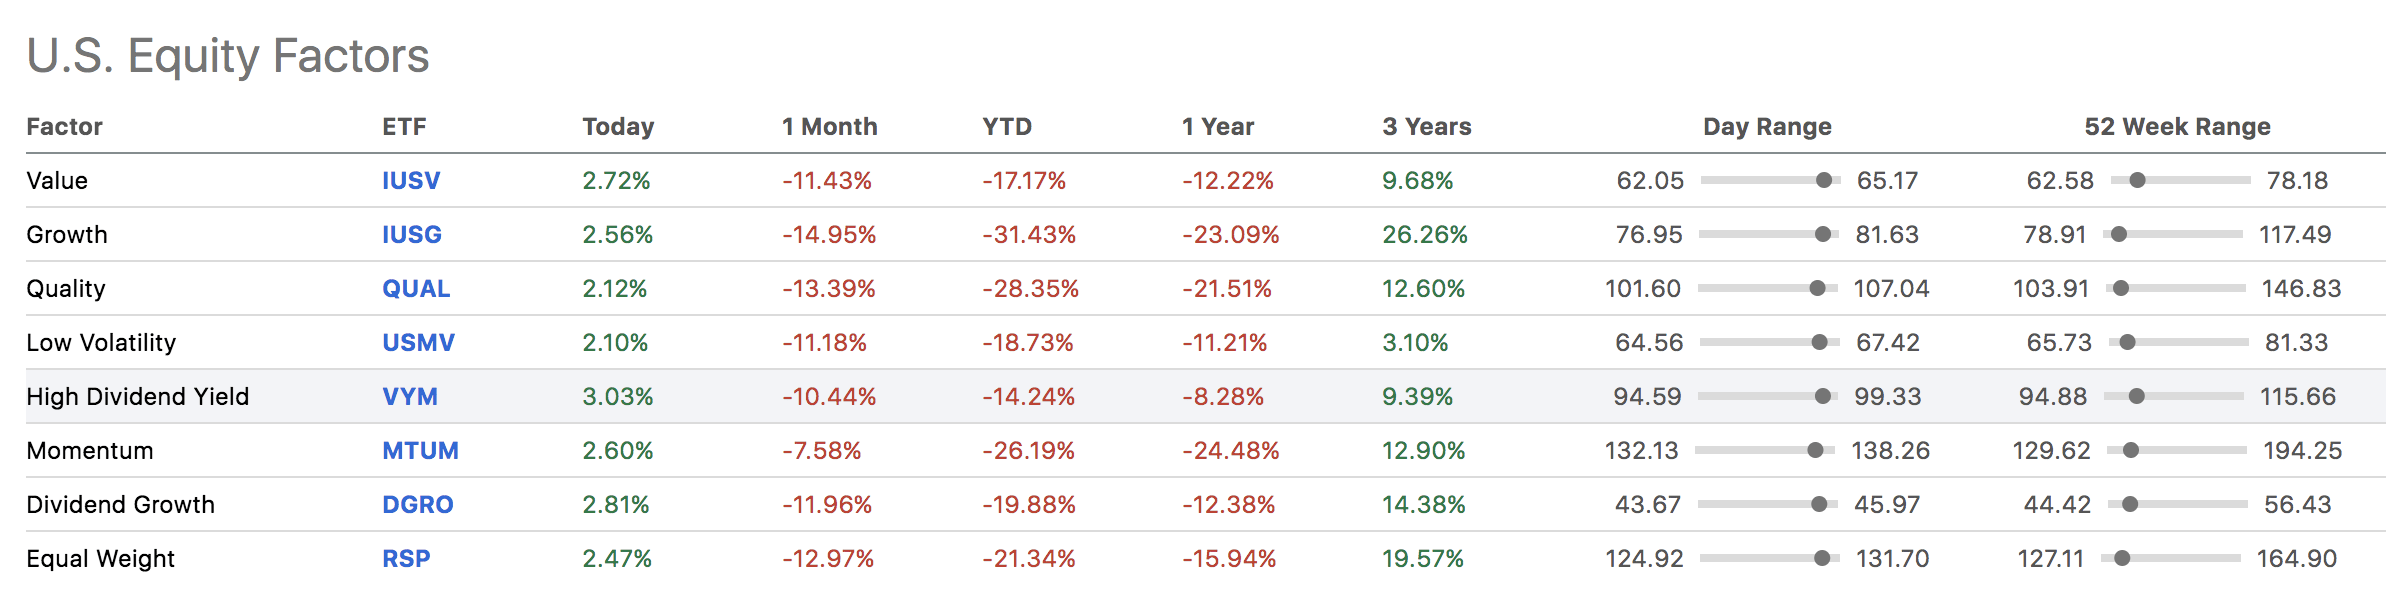
Factor Analysis
If you’re one of our regular followers, you’d know that we’re factor investment enthusiasts. It just makes life easier!
In a nutshell, factor analysis is a simulation method used to discover what makes an asset tick. For instance, is the asset an outperformer/underperformer whenever investors predominantly invest in growth securities, value securities, momentum securities, etcetera?
After simulating thousands of trading days, our model reveals the following.
- Vanguard’s Dividend ETF underperforms the broader market whenever investors are small-cap stock (SMB) seeking. Small-cap environments usually occur during economic expansion as investors are risk-receptive.
- The ETF outperforms whenever the market’s value is orientated (HML). A value-orientated market usually occurs in an early market recovery with a growing economic trajectory and early-stage inflation.
- The ETF doesn’t form part of the momentum anomaly group. The momentum anomaly occurs in late-stage bull markets when investors stay invested due to market liquidity rather than economic growth.
- The ETF outperforms the market whenever investors seek quality assets (QMJ). Quality is an asset segment filled with assets with strong financial statements and strong industry market positions. This type of market sentiment usually occurs whenever there are recessionary concerns.
- Lastly, Vanguard’s High Dividend ETF underperforms the market whenever low-beta assets (BAB) outperform high-beta assets. Betting against beta means you believe low-beta assets are underpriced and high-beta assets are overpriced. Low-volatility stocks, in most instances, outperform the broader market in the long run.
PortfolioVisualizer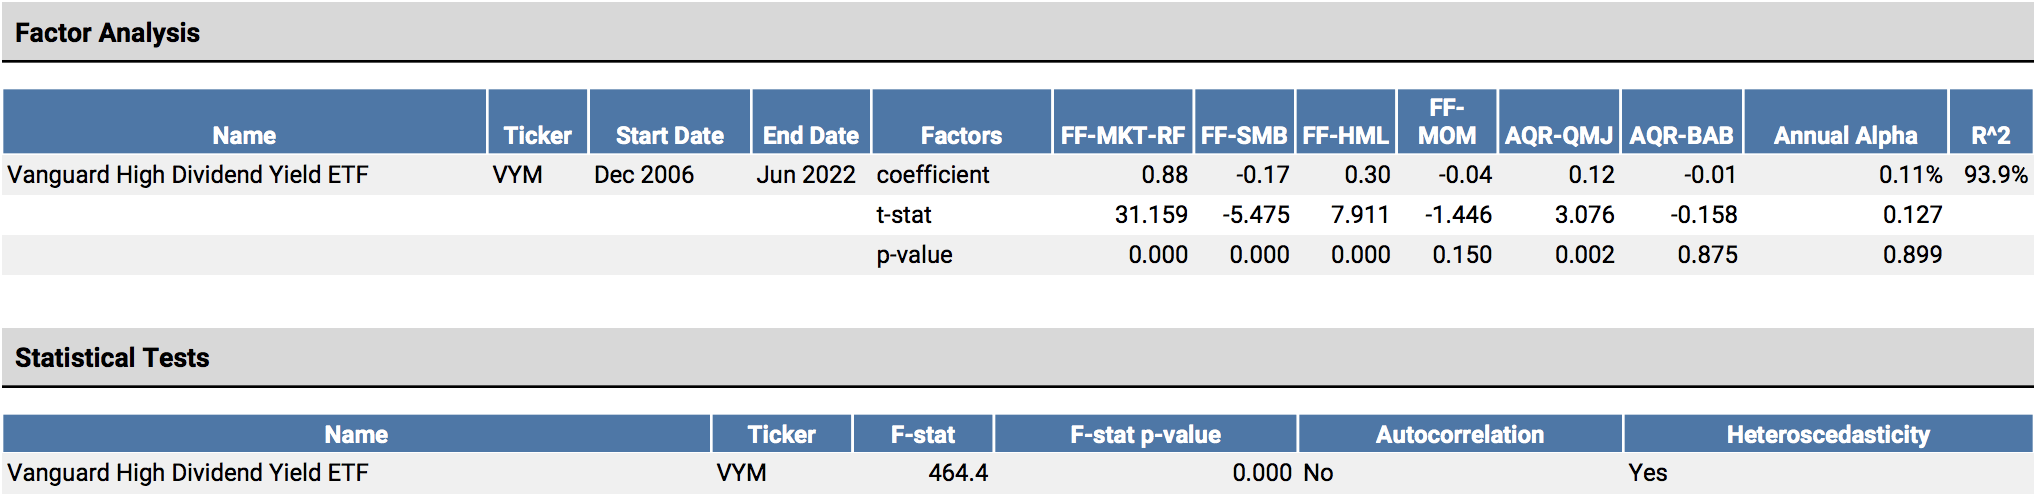
So, what can we infer from the factor analysis?
The ETF is likely conducive to large-cap, value, and quality investment environments, which aligns with the market’s current appetite. Furthermore, the ETF is a bet against momentum, which could be a plus as momentum assets are currently underperforming other market segments (see chart below).
KoyFin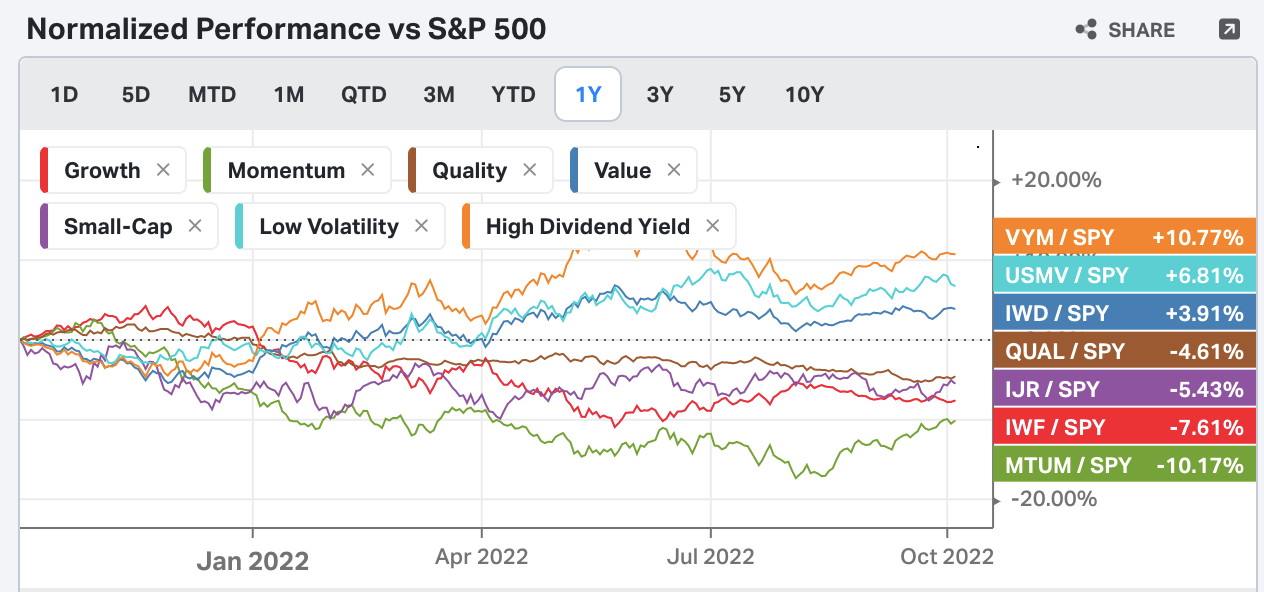
Allocational Analysis
Sectors
The Vanguard High Dividend Yield ETF is overweight on health care, consumer defense, and utilities, which is good to see during a period where deep recession risk is at a multi-year high. In addition, the ETF holds energy stocks, which is encouraging as energy stocks could garner record-sales levels from an energy crisis in Europe.
Double Click On The Image To Enlarge (Source: Seeking Alpha)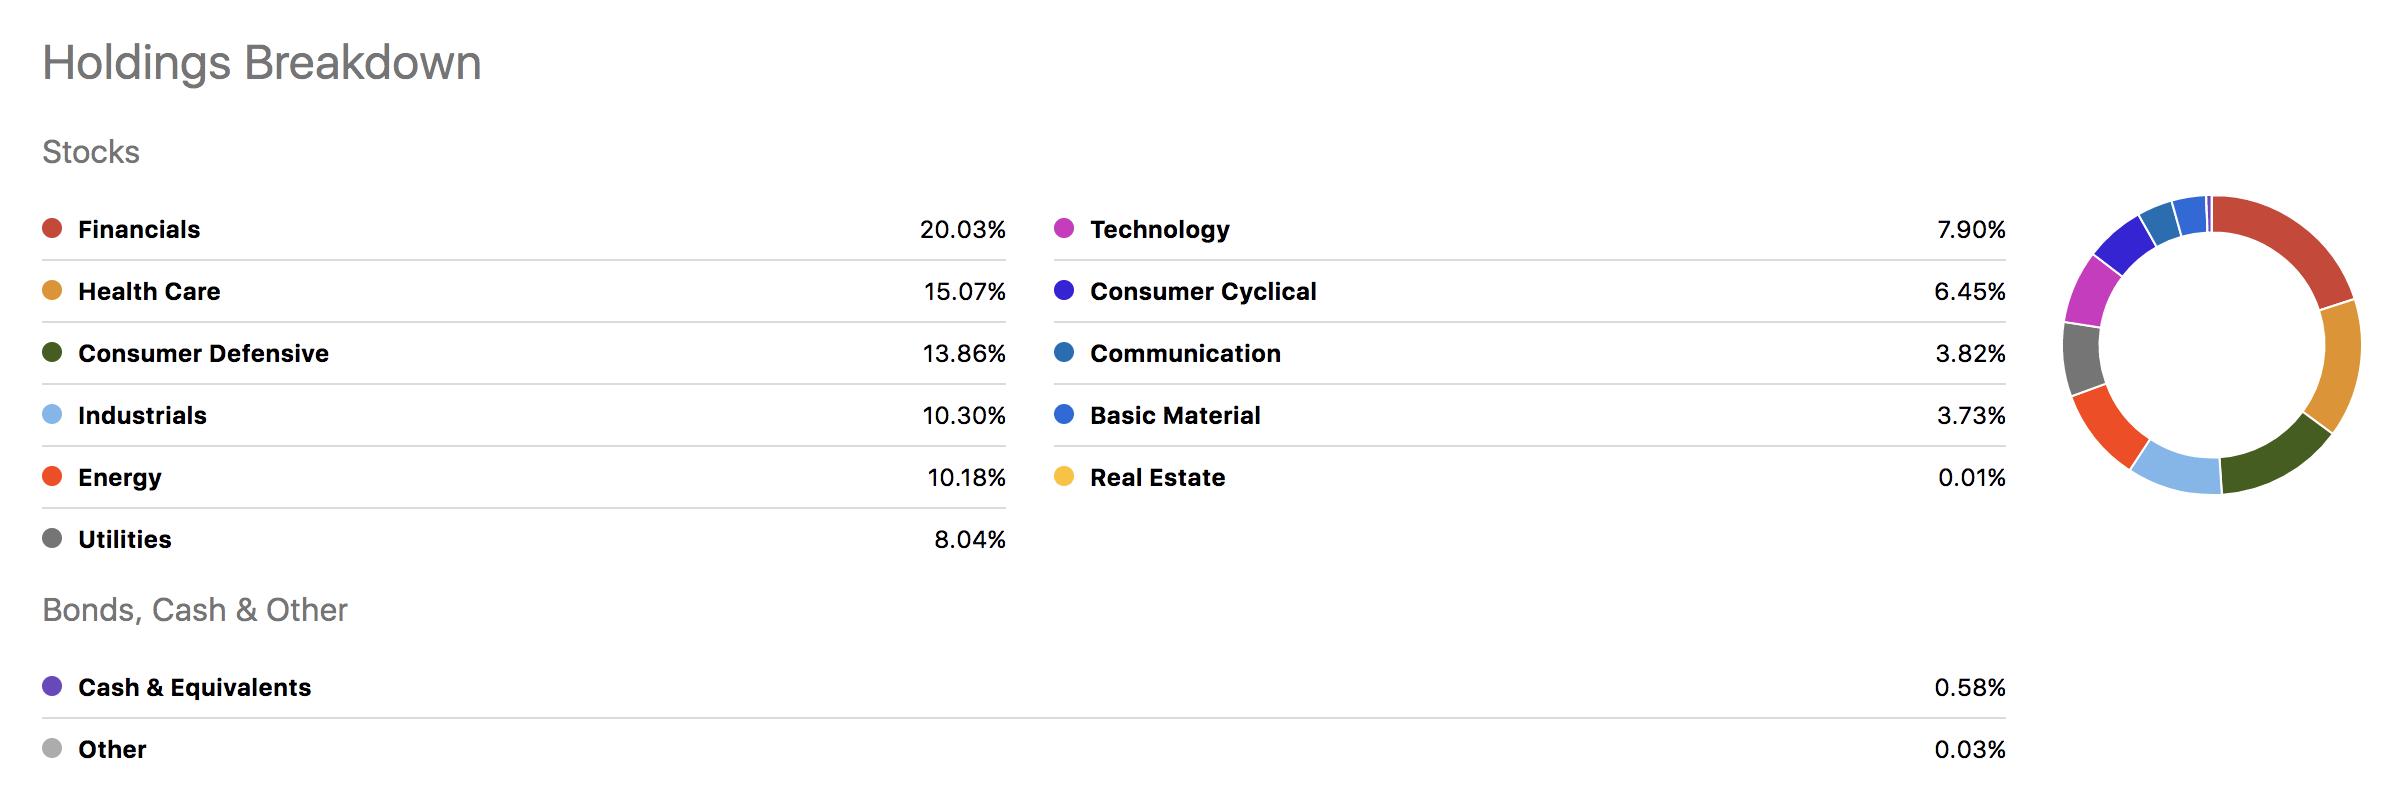
Despite the ETF’s allocational positives, I’m slightly concerned about its exposure to the financial sector. Due to their cyclical attributes, financial stocks tend to be struck whenever economic contraction occurs.
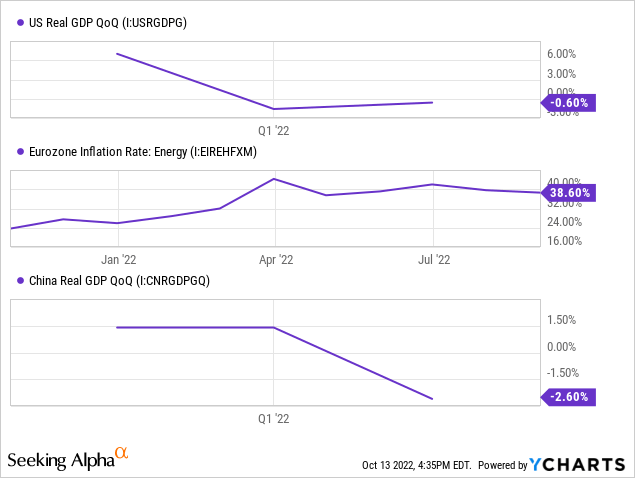
We’re possibly headed for an extended global recession based on parsimonious data. Global growth’s slowing, energy prices in Europe are skyrocketing, and monetary policies across the globe are in tatters. Thus, I’d ideally like to invest in an ETF with less exposure to the financial sector.
Individual Stocks
I had a look at the ETF’s top 10 holdings and narrowed the observation down to seven stocks as I phased out same-sector stocks. I was pretty surprised to see the elevated price multiples among the constituents of the Vanguard High Dividend Yield ETF. Thus, I’d encourage investors to keep an eye on this as it concerns me.
On the plus side, a feature that I like about the ETF’s portfolio constituents is their high return-on-equity multiples, possibly explaining why our factor regression loads on the Quality factor. To my knowledge, quality stocks are helpful to own whenever recession risk is high (see succeeding chart), as their robustness means their less susceptible to economic swings.
Lastly, as anticipated, all of the ETF’s top 7/10 components exhibit high dividend yields, which is exactly what I like to see from a risk-off portfolio allocation such as the Vanguard High Dividend ETF.
| Stock | PE | D.Yield | ROE |
| Johnson & Johnson (JNJ) | 23.68x | 2.69% | 25.17% |
| Exxon Mobil (XOM) | 10.78x | 3.58% | 23.19% |
| JPMorgan & Chase (JPM) | 8.31x | 3.86% | 14.68% |
| Procter & Gamble (PG) | 21.43x | 2.87% | 31.69% |
| The Home Depot (HD) | 17.26x | 2.62% | 1464.44% |
| Coca-Cola (KO) | 25.06x | 3.16% | 42.30% |
Source: Seeking Alpha
BlackRock; Harvest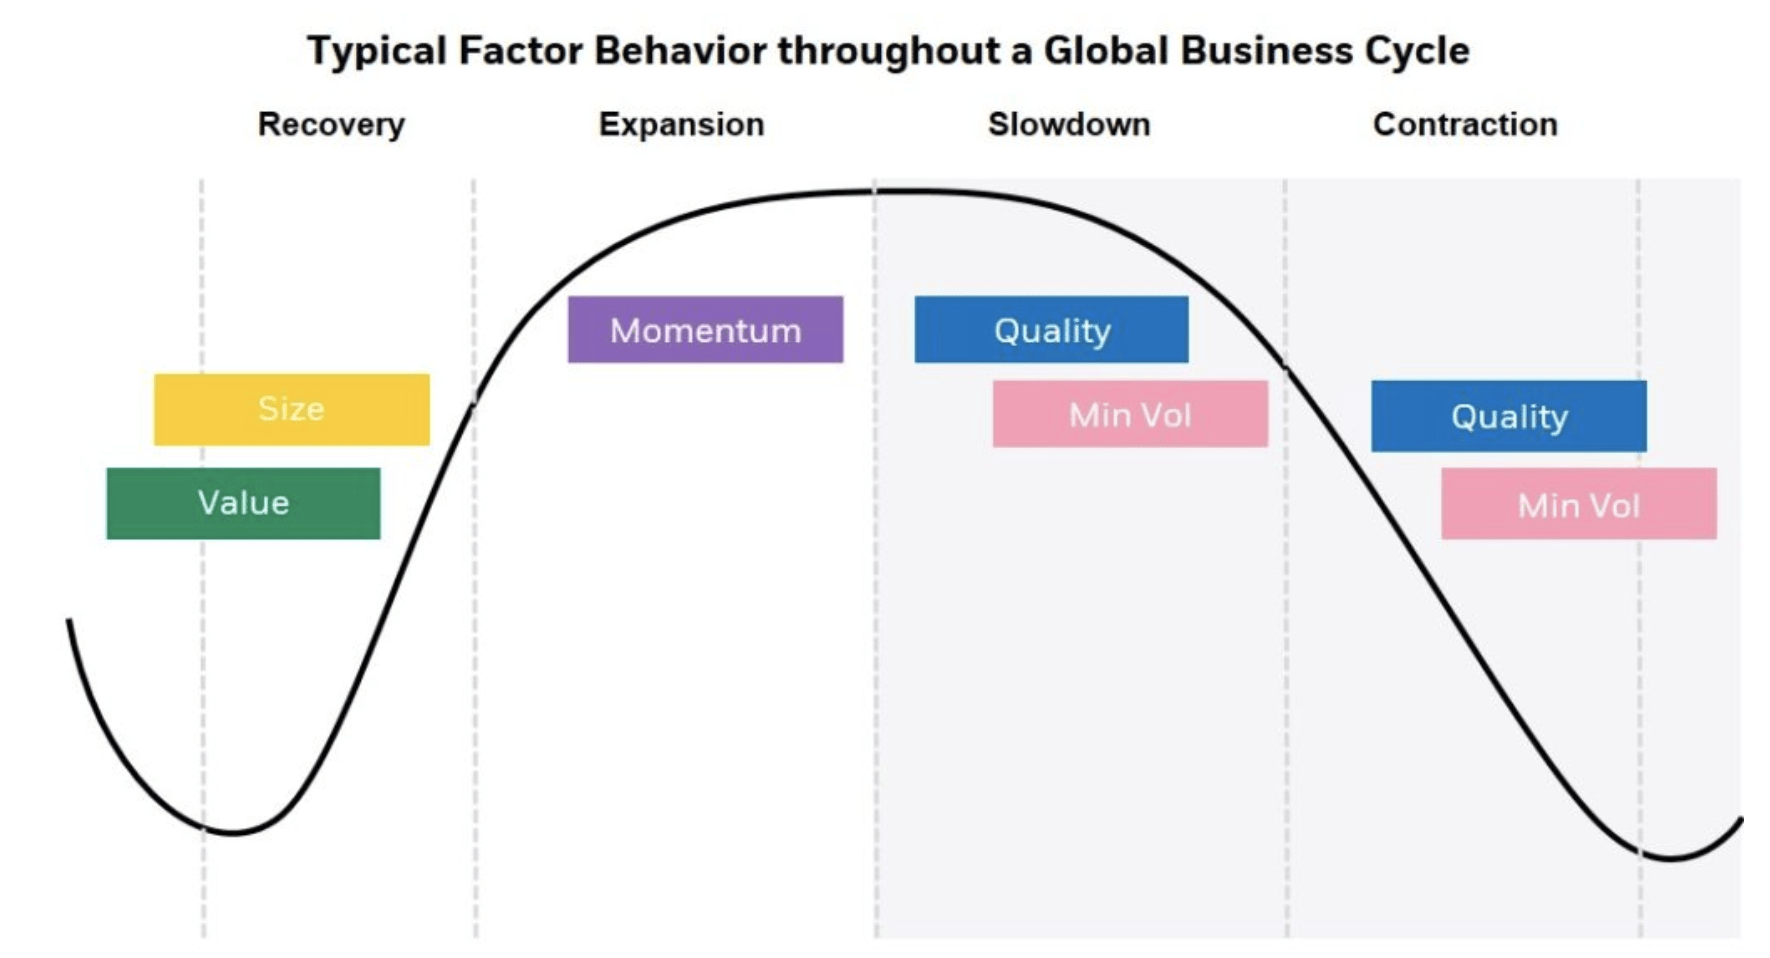
Dividend Analysis
The ETF provides a good dividend at a yield of 3.35%. In addition, the ETF’s dividend growth is robust based on both long and short-term trajectories. I’d be thrilled with this ETF’s dividend profile as an investor.
| Dividend Yield | 3.35% |
| Dividend Growth Rate 3-Y | 4.71% |
| Dividend Growth Rate 10-Y | 8.10% |
Source: Seeking Alpha
Additional Risks
I’ve already mentioned a few risks pertaining to the economy and the ETF constituents’ valuation metrics. However, to balance the argument, I’ve outlined a couple of quantitative risks that I’m afraid of.
Firstly, the ETF’s Sharpe Ratio falls far below 1.00, indicating that its risk versus return distribution isn’t well-aligned. In addition, the ETF’s Value-at-Risk (VaR) of 6.93% is on the high side for an asset with a beta coefficient of only 0.82x.
For those who’re unaware, a monthly VaR of 5% measures the minimum monthly amount a stock tends to draw down in 5% of its traded months.
Seeking Alpha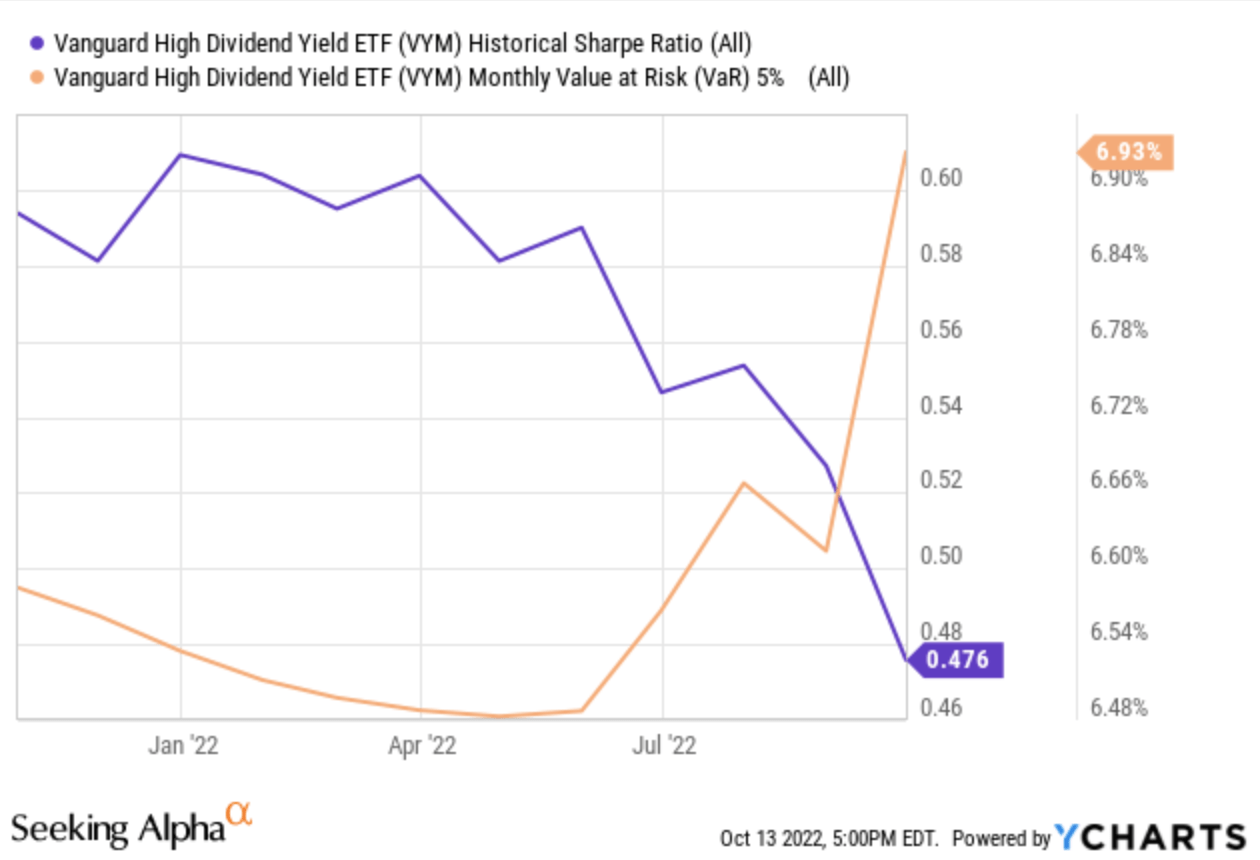
Concluding Thoughts
Dividend investing still seems like the way to go in this bear market. Remember, investing is just as much about limiting your portfolio’s downside in bear markets as it is about beating upside movements in bull markets.
Based on our quantitative analysis, the Vanguard High Dividend ETF tends to outperform the market whenever quality and large-cap assets are preferred. In addition, a qualitative research overlay suggests that this ETF is efficiently allocated.
Be the first to comment