

FrankRamspott/E+ via Getty Images
I look forward to the J.P. Morgan Asset Management’s Guide to the Markets each month. The version released on July 31 continues to show value among international stocks. This is nothing new. Foreign markets’ price-to-earnings ratios are dirt cheap right now. But with inexpensive markets comes risk and weak momentum. Moreover, the rally off the June 17 low in the global stock market makes many investors nervous about putting cash to work at the moment. A popular ETF tracking the all-country index is the Vanguard Total World Stock Index Fund (NYSEARCA:VT). Let’s dive into some charts to assess the playing field.
Kicking things off with returns and the All-Country World Index composition. Emerging markets have fared the worst, down more than 17% in USD terms through July 31. Once again, the S&P 500 is the best house on the rough street – down just 12.6% for 2022. Brazil has been a topsy-turvy market YTD but has managed a small gain on the year. The U.S. is now 62% of the global market, up from last year’s composition picture.
SPX Leads Again YTD, A Growing Share Of The Total World Market
J.P. Morgan Asset Management
Ex-USA stocks sport a huge valuation disconnect (in a good way) versus domestic stocks. The MSCI All Country World Ex-U.S. Index is now more than two standard deviations cheaper than the S&P 500, according to JPM. Moreover, the foreign shares have a dividend yield of a whopping 1.8 percentage points above that of the SPX – that is massive relative to history.
ACWI Ex-US P/E Vs SPX, Yield Differentials
J.P. Morgan Asset Management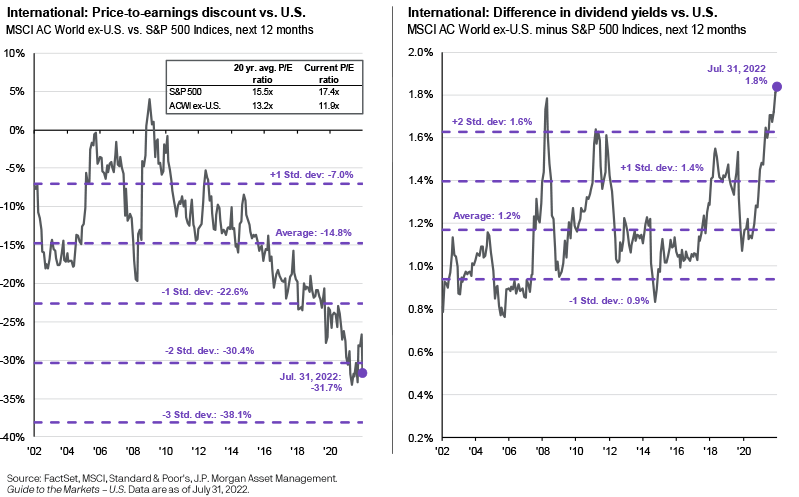
Earnings matter, too, of course. Next year’s and 2024’s EPS growth is seen highest in the U.S. as cyclical areas represent less of the broad market. A global recession remains top of mind.
Global Stocks Are Cheap, But Earnings Growth Is Best Within The SPX
J.P. Morgan Asset Management
The Technical Take
Let’s turn to the chart to see where price action might look like through the end of the year. I pulled the trailing 13-year seasonality chart from Equity Clock on VT versus the S&P 500. We all know that August and September (into early October) can be sketchy periods for the stock market. But vs the S&P 500, foreign shares tend to be weak now through the end of August before rebounding into October. Domestic equities are the place to be from late October through mid-December, on average.
VT Vs SPX Last 13 Years: Choppy Action Is The Trend Through Year-End
Equity Clock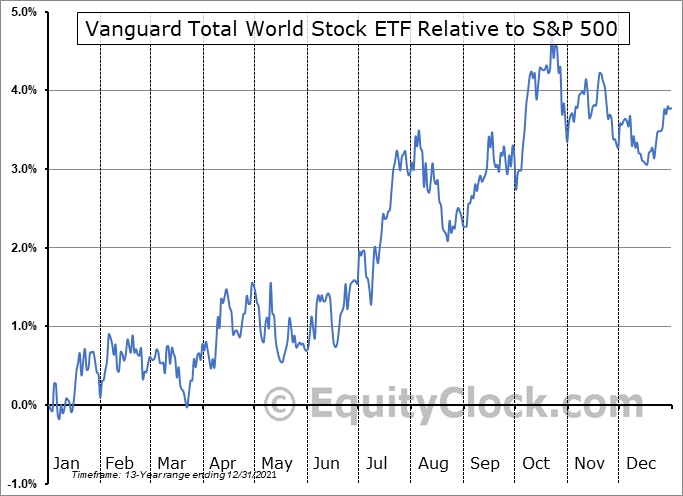
For VT specifically, I see support at the February 2020 highs near $83. That level held on a pair of tests – in June and July, recently. Now, though, shares might find near-term resistance in the low to mid-$90s from key spots earlier in 2022. If VT can climb above $95, that would really support the case for a global bottom established from June 17 through July 14 on VT.
VT: Key Levels Above And Below
StockCharts.com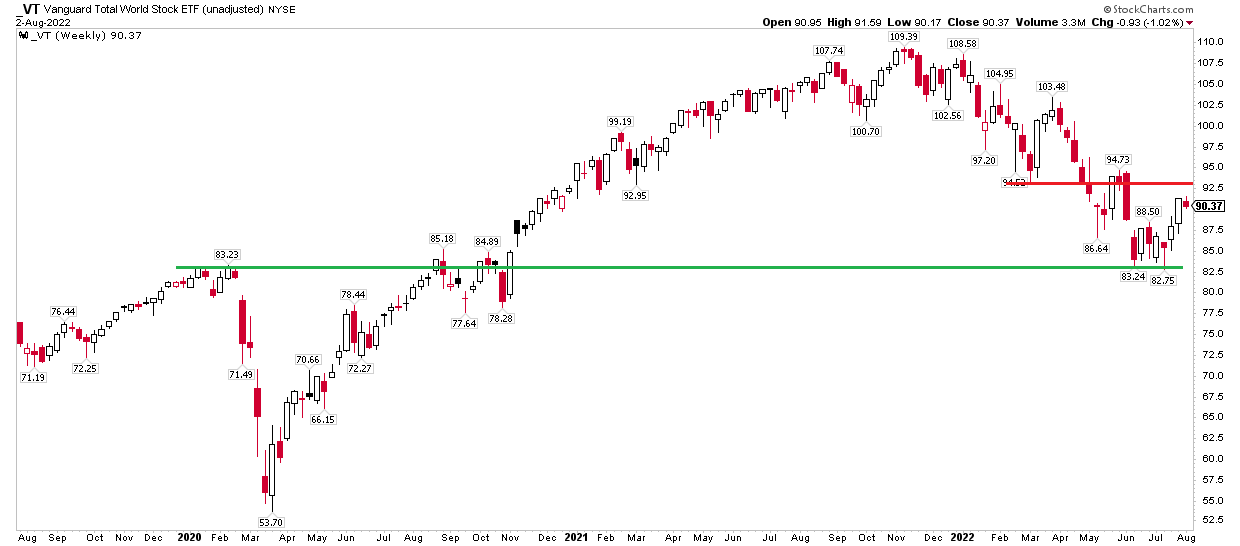
The Bottom Line
Global equities, using the popular VT index ETF as a proxy, are on breakout and bottom watch. The low to mid-$80s and low to mid-$90s are pivotal areas currently, as so many markets trade at cheap valuations, particularly outside of large-cap domestic areas.
Be the first to comment