

Jonathan Kitchen
Vanguard Russell 1000 Growth ETF (NASDAQ:VONG) is an exchange-traded fund that invests in accord with its chosen benchmark index, the Russell 1000 Growth Index. The fund’s mandate is to track its benchmark in a cost-efficient way. VONG provides direct exposure to large-cap U.S. growth stocks. The expense ratio is 0.08% (characteristically cheap for Vanguard) with net assets under management of $10.2 billion as of September 30, 2022).
Markets have struggled through 2022 (year-to-date). VONG has also declined, by circa -27% (2022 YTD) at the time of writing.
TradingView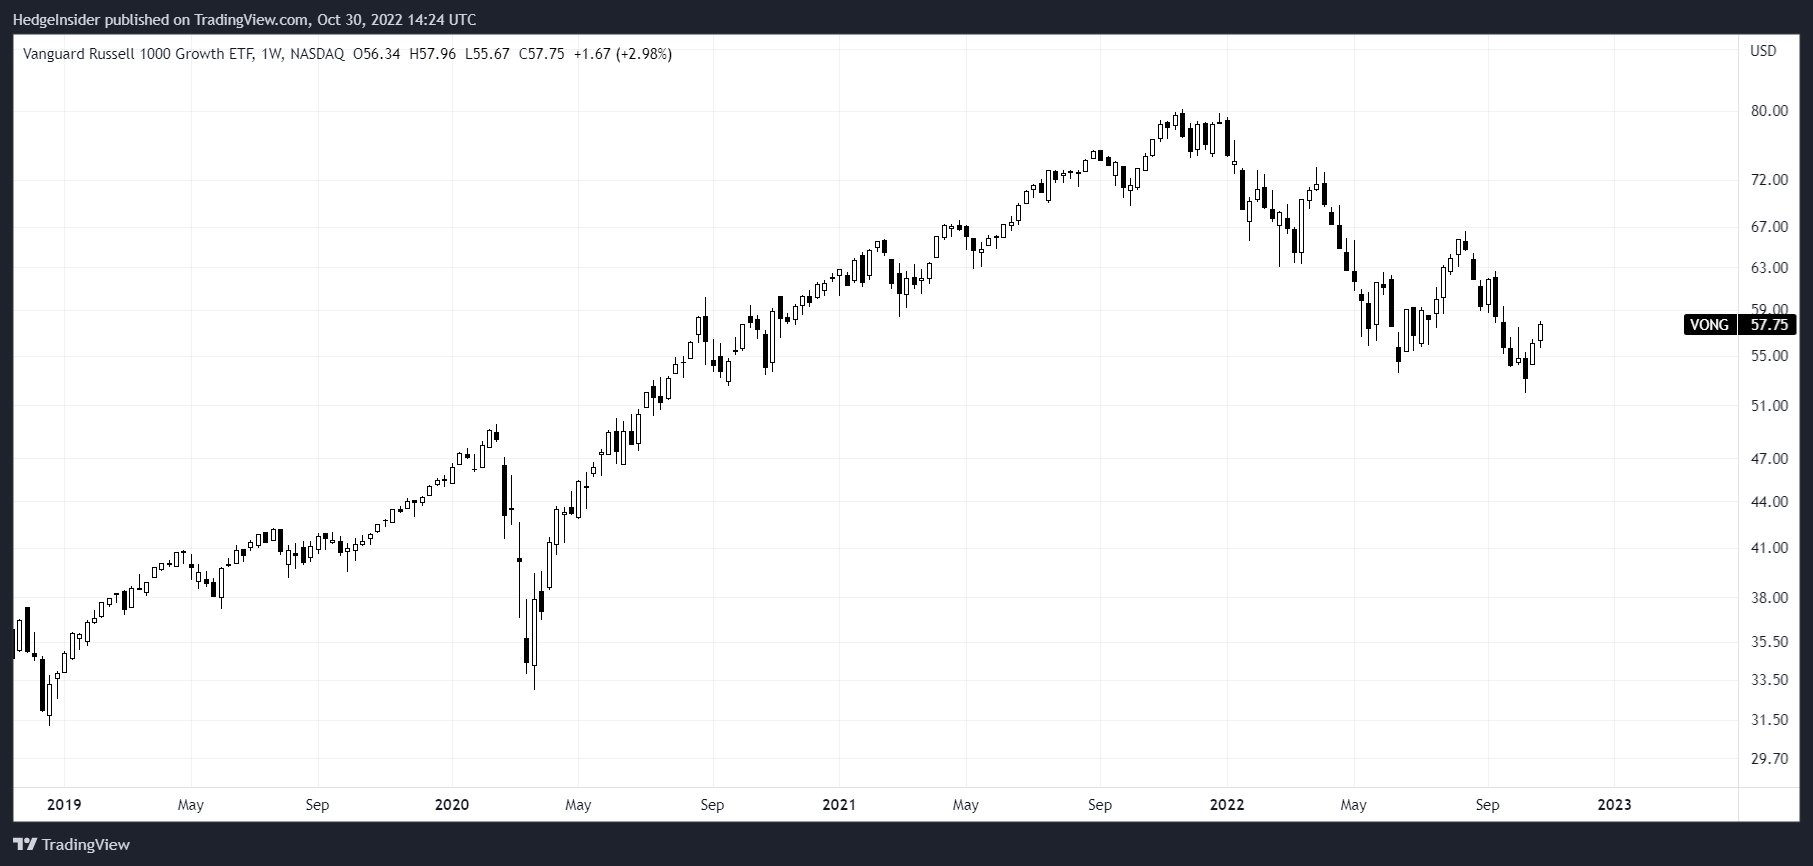
On the other hand, net fund flows have been positive over the past year or so; circa +$2.5 billion (illustrated below).
ETF Database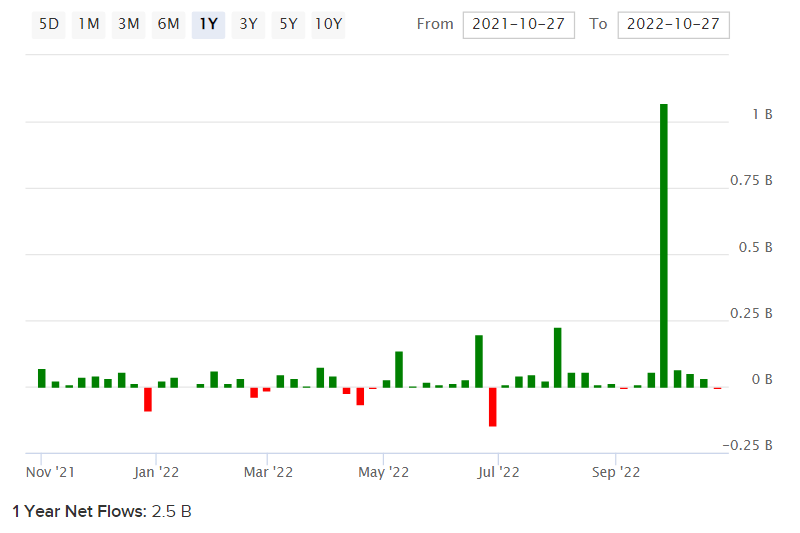
You can clearly notice that much of these net fund flows have been recent, with investors evidently buying the dip; there was a recorded net fund flow of over $1 billion in the week from Monday, September 26, 2022.
The company’s top 10 holdings are illustrated in the table below. The largest holding is Apple Inc. (AAPL) at about 12%, followed by Microsoft Corp. (MSFT) at 10% and Amazon.com, Inc. (AMZN) at 6%. Tesla Inc. also deserves a mention at 4%. These top four holdings represent a collective 32.5% (about one-third of the VONG portfolio), yet the rest of the portfolio is fairly diversified.
Vanguard
Even for a large-cap and relatively concentrated fund, VONG is fairly well diversified, not overly dependent on just a handful of stocks. The top 10 holdings collectively represent just under 50% of the total portfolio, leaving plenty of price/value variation to the remaining holdings. In total, VONG has 518 holdings. This also helps to keep the fund’s beta somewhat muted, at roughly 1.09x (on a five-year basis).
Being a tech-oriented fund, VONG tends to generally out-perform, but its higher beta can bite investors during risk-off periods. The chart below shows the ratio between VONG and SPY, a popular ETF that tracks the S&P 500 U.S. equity index (a common market benchmark).
TradingView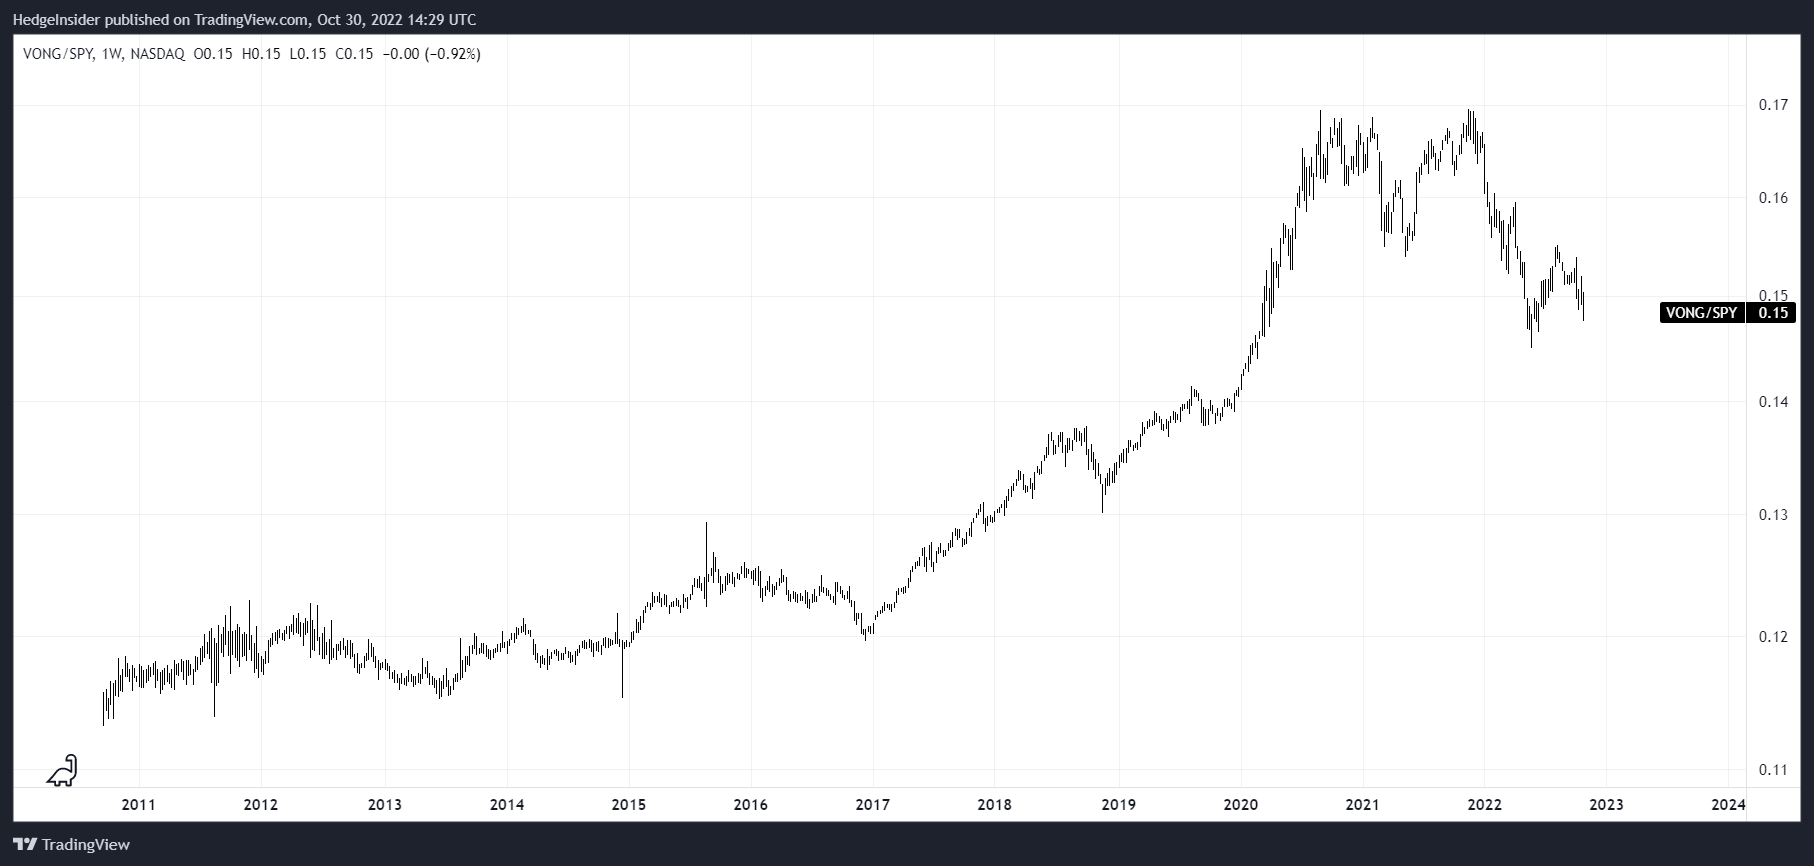
VONG has under-performed SPY into this year, from its peak in Q4 2021. Nevertheless, the longer-term trajectory is clearly positive. This is supported largely by the higher returns on equity and often lower equity risk premiums afforded by investors to tech stocks. The S&P 500 itself has some heavy tech exposures, but VONG’s purer-play tech orientation lifts the market beta in such a way that is typically favorable (bull markets tend to outlast bear markets).
More recently, markets have sold off on the back of contracting stimulus relative to GDP (including fiscal, credit, and monetary stimulus). Higher interest rates can compress valuations by increasing discount rates and thus hitting valuations of companies that are more dependent on forward earnings. If/when inflationary pressures abate, tech stocks will likely turn and become more favorable and out-perform the broader indices.
The current business cycle positioning for the United States as of Q4 2022 is in the later stages, driven by moderating growth rates, tightening credit, earnings pressures, contracting stimulus/tighter fiscal and monetary policy, and worsening/higher inventory/sales ratios.
Fidelity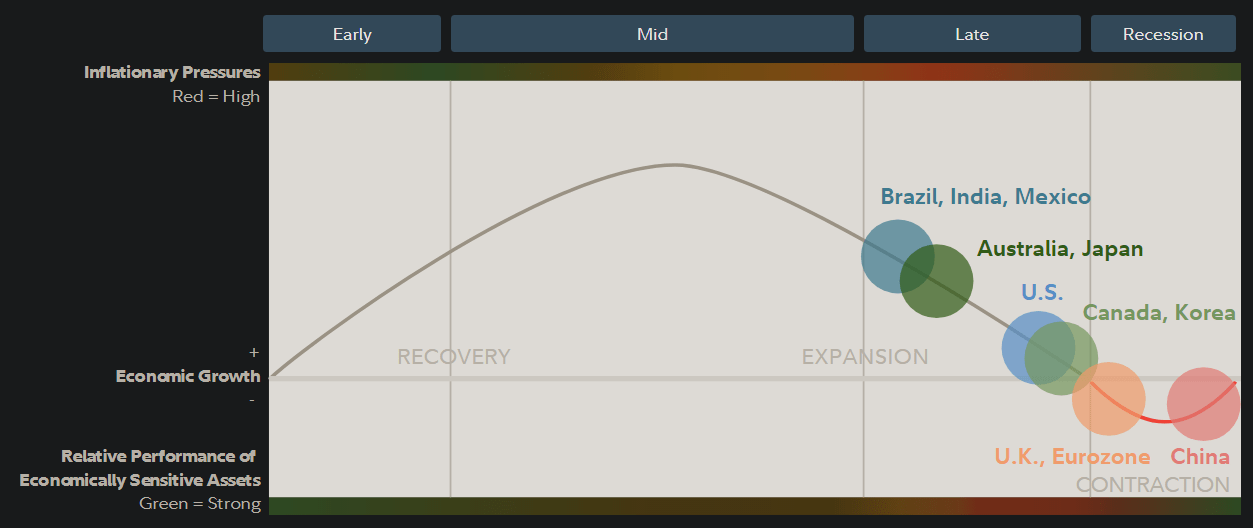
That means that it is more than possible that VONG remains under some pressure in the coming few quarters. Nevertheless, it is probable that the market is currently in a bottoming process, as year-over-year changes in fiscal spending and credit creation relative to GDP are starting to peter out. I use data from the Bank for International Settlements (or BIS) to generate a G20 credit and fiscal impulse on a variable, smoothed lead of around 6-12 months.
Author’s Calculations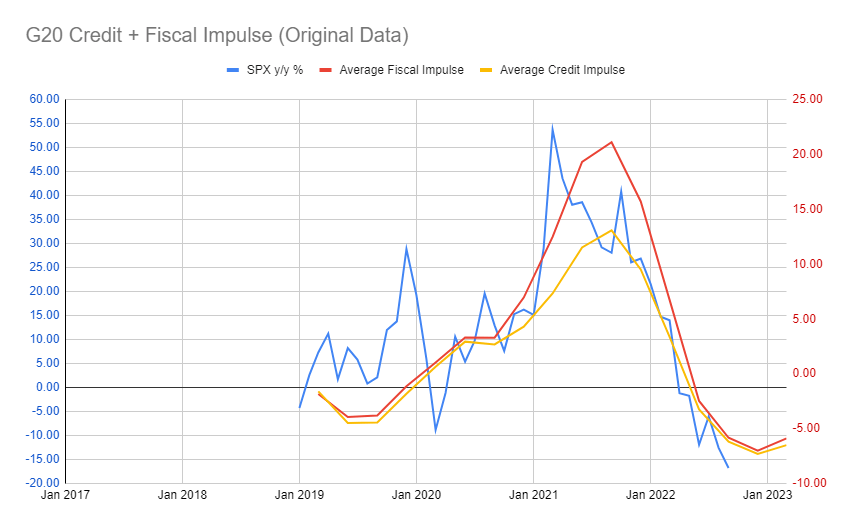
The year-over-year change in the S&P 500 (as above) is tracking the two impulses. It is likely that base effects going forward will help to support equities from dropping much further if at all. Indeed, I would expect the S&P 500 to rise by up to 10% into the end of Q4 2022 and staying in a roughly similar place by the end of Q1 2023 (based on presently available data). That means VONG, if it were to move in line with its historical beta, might move up by circa 10-11% over the next one or two quarters.
The U.S. 10-year yield has moved higher this year, to a present 4.01%. A fair U.S. equity risk premium might be in the region of 4.2-5.5% on the high end. Meanwhile, a long-term nominal earnings growth rate would be expected to be at least 2% for the United States. So, net of growth, the maximum cost of equity we would expect to assign to U.S. stocks vis-à-vis forward earnings would be 6.2% to 7.5%. For growth stocks, lower equity risk premiums (toward 3.2%) are more than possible, taking our potential “maximum cost of equity” to as low as 5.2%.
That means a forward price/earnings ratio of 13.33x to 19.23x is quite fair, and indeed conservative on the low end. Morningstar currently thinks VONG’s forward price/earnings ratio is 19.78x as of September 30, 2022. So, in spite of recently falling equity prices (including VONG), it seems that investors having “bought the dip” have helped VONG avoid a more serious drawdown. VONG is not “conservatively priced”, even in spite of recent falls. Still, subject to forward earnings surprises (which could be negative), it would seem as though VONG is priced for some kind of combination of: at least meeting earnings expectations; long-term yields stabilizing or easing; longer-term earnings growth to beat longer-term inflation levels.
Morningstar’s current consensus analyst estimate for three- to five-year earnings growth for VONG is 13.06%. That is significantly higher than our 2% growth rate assumed to perpetuity (in the “conservative” workings above). This is unlikely to last in the much longer term, but it is also much higher than recent CPI inflation numbers for the United States (which have been as high as 9.1% (June 2022, year-over-year).
Trading Economics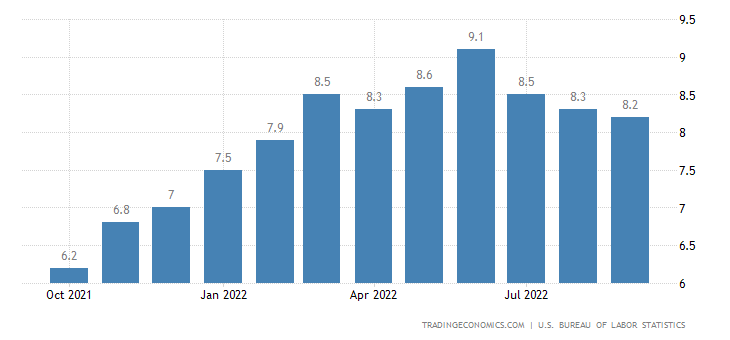
So, if inflationary pressures do continue to abate (which is probable, given the contracting level of economic stimulus relative to GDP and already declining year-over-year numbers), yields are also likely to stabilize. That means VONG’s highly productive portfolio will likely remain competitive. Dividing the price/book ratio into the forward price/earnings ratio gives us an implied forward return on equity of 35%, which is incredibly high. While Morningstar’s numbers may be adjusted for certain items and therefore on the generous side, it is true that VONG’s portfolio is comprised of mostly high-ROE businesses which tend to out-perform during bull markets. Only during bear markets do VONG’s main sector exposures usually struggle.
While we may well be heading into a contractionary period for the U.S. economy, inflation is the greatest risk, and this risk seems to be petering out now. Further, markets are forward-looking (usually by at least six months). While Q4 2022 and Q1 2023 may see a revisit of lower equity prices, ultimately, I believe the “bear market” is over at this current juncture. It makes sense to hold funds like VONG that are well positioned to out-perform in the longer run.
Be the first to comment