

eldadcarin/iStock via Getty Images
The iShares MSCI USA Value Factor ETF (BATS:VLUE) is an underpriced U.S. equities-centered fund favoring mega- and large-caps. The expense ratio of 15 bps is fairly modest; the net assets are north of $7.6 billion, yet with worrisome outflows.
The last time I covered VLUE was about a year ago, when I concluded that an impressive share of stocks priced at a discount combined with impressive quality made it appealing, though I stopped short of a Buy rating. Since then, it has delivered a negative total return of ~11%, while the S&P 500 has declined by around 17.3%, principally owing to the latter being much more expensive and consequently meaningfully more exposed to the two interconnected issues: global capital shortage (higher interest rates-induced issue) and the growth premia reduction that disproportionately affected the tech sector (defined broadly) and the most expensive stocks overall.
Today, I would like to provide a due update, explaining why I have become a bit more skeptical about the ETF, even though it outperformed the S&P 500, paying due attention to the value & quality mix it has in the current version.
A quick strategy recap
What is VLUE at this juncture? It is a large-caps-heavy mix with a 9.9% earnings yield and a 14.4% weighted-average forward EPS growth, as per my calculations. A thrilling combination, something of a Growth at a Reasonable Price style, isn’t it? I will return to that shortly.
The MSCI USA Enhanced Value Index is the cornerstone of VLUE’s investment strategy. For better context, the USA index which forms the selection universe had 622 constituents as of the most recent factsheet (30 November 2022). It should be noted that despite having more components, the index is broadly similar to the S&P 500, partly owing to the market-cap weighting schema.
To qualify for inclusion in VLUE’s benchmark, a stock must have a sufficient value score that is a composite of the Forward Price/Earnings, Enterprise Value/Operating Cash Flows, and Price/Book Value. The latter metric is the one I dislike as potentially misleading, though this is not necessarily a significant flaw. I like the EV/CFO ratio which brings together two essential parameters: the debt burden via the enterprise value and cash flows; I believe both are of paramount importance in the higher interest rate era. The weighting schema is unconventional, mixing the market cap and the value score ingredient. Sector neutrality is what the index pursues. Rebalancing has a biannual schedule, with the due changes made in March and November.
An updated view on factor exposure: valuation has deteriorated, quality is steady
At this point, VLUE’s portfolio consists of 150 equities, with 31% of the net assets allocated to the major ten. The weighted-average market capitalization stands at about $79.8 billion, being mostly the product of around 34.2% invested in mega-caps, while a fairly small share is allocated to the mid-caps, only 6%. Small caps are absent, which is a tailwind for the quality characteristics of the fund.
Turning to sectors, there is nothing fundamentally different from the proportion the iShares Core S&P 500 ETF (IVV) has owing to the sector neutrality principle. IT, healthcare, and financials dominate in this mix, while materials and real estate are underrepresented. In my view, sector neutrality has been a detractor from the fund’s returns this year, especially since energy, which was on a tear on the back of the oil price rally, has just a mid-single-digit weight.
Created by the author using data from the funds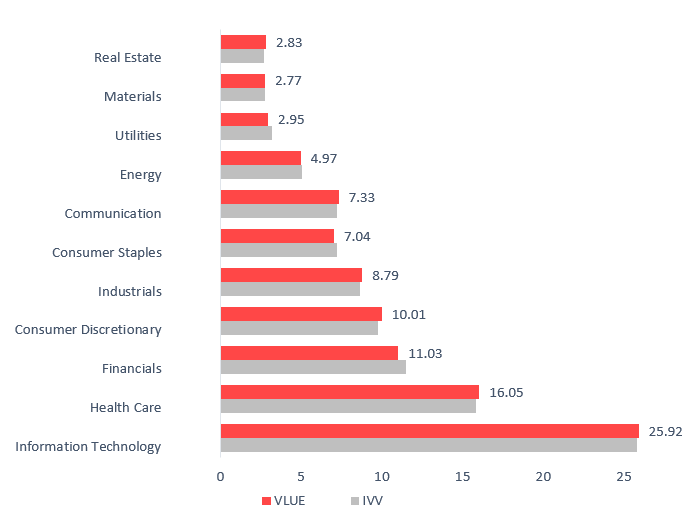
Above I said a 9.9% earnings yield (around 10.1x Price/Earnings, the SPDR Portfolio S&P 500 ETF (SPLG) has about 19.03x) that goes with an over 14% weighted-average forward EPS growth is an appealing combination. Yet some nuances could be uncovered upon deeper inspection.
More specifically, the weighted average earnings growth rate is disproportionately affected by the energy and materials sectors, which have seen a margin compression during the pandemic and a quick recovery amid the inflation drama and the oil price rally. The following names significantly influencing the rate should be mentioned:
| Stock | Weight, % | Sector | EPS FWD growth rate |
| Ovintiv (OVV) | 0.35 | Energy | 243.17% |
| Mosaic (MOS) | 0.28 | Materials | 126.80% |
| EOG Resources (EOG) | 2.09 | Energy | 120.39% |
| CF Industries (CF) | 0.19 | Materials | 119.52% |
| Diamondback Energy (FANG) | 0.77 | Energy | 102.95% |
| Coterra Energy (CTRA) | 0.39 | Energy | 99.50% |
Created by the author using data from Seeking Alpha
At the same time, the fund has just a 7.5% weighted-average forward revenue growth rate, as per my calculations, which is consistent with its focus on cheaper (hence, slowly growing) companies.
Here, since we are talking about the value factor, I should mention that last time I covered VLUE it had an impressive share of stocks with no less than a B- Quant Valuation rating, about 76%, while just 8.2% were overvalued (grades below D+). Has the proportion changed? It has, and so profoundly that I have become more skeptical about this vehicle. At this point, I see that just 38% of the net assets are allocated to attractively valued stocks, while 28% look overappreciated. This is not acceptable.
Next, quality is also a factor not to ignore. Here, in contrast to the value exposure, I see little reason for skepticism. 93% boasts a Quant Profitability grade of at least B-. Only 2.3% of the net assets are allocated to loss-making companies (nine stocks in total). EBITDA-negative companies are absent (obviously excluding financials and real estate); the median margin is almost 21%. Only five companies were incapable of delivering net operating cash flows in the last twelve months; their combined weight is south of 2%.
Final thoughts
VLUE did outperform IVV since my previous article, finishing ahead of it during seven out of the full eleven months of this year. What is the flip side? I should say the scatter plot below has a succinct answer.
Created by the author using data from Seeking Alpha. Performance as of December 25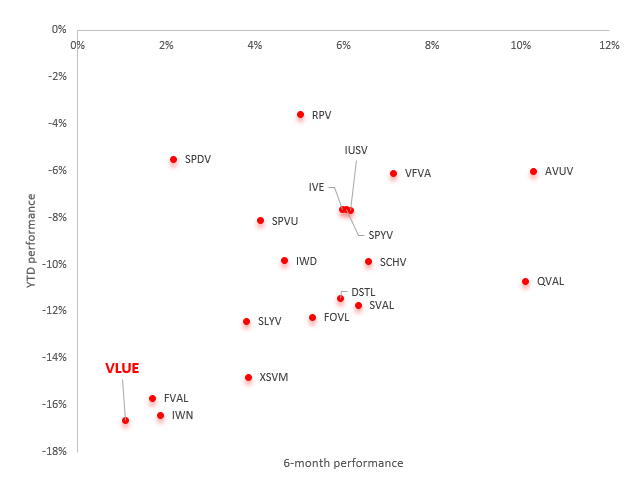
VLUE underperformed all the passively and actively managed value ETFs I cover, namely the following:
| N | ETF |
| 1 | Avantis U.S. Small Cap Value Fund (AVUV) |
| 2 | Distillate Fundamental Stability & Value ETF (DSTL) |
| 3 | iShares Focused Value Factor ETF (FOVL) |
| 4 | Fidelity Value Factor ETF (FVAL) |
| 5 | iShares Core S&P U.S. Value ETF (IUSV) |
| 6 | iShares S&P 500 Value ETF (IVE) |
| 7 | iShares Russell 1000 Value ETF (IWD) |
| 8 | iShares Russell 2000 Value ETF (IWN) |
| 9 | Alpha Architect U.S. Quantitative Value ETF (QVAL) |
| 10 | Invesco S&P 500 Pure Value ETF (RPV) |
| 11 | Schwab U.S. Large-Cap Value ETF (SCHV) |
| 12 | SPDR S&P 600 Small Cap Value ETF (SLYV) |
| 13 | AAM S&P 500 High Dividend Value ETF (SPDV) |
| 14 | Invesco S&P 500 Enhanced Value ETF (SPVU) |
| 15 | SPDR Portfolio S&P 500 Value ETF (SPYV) |
| 16 | iShares US Small Cap Value Factor ETF (SVAL) |
| 17 | Vanguard U.S. Value Factor ETF (VFVA) |
| 18 | Invesco S&P SmallCap Value with Momentum ETF (XSVM) |
To sum up, VLUE does not possess a quality & value balance I would call supportive of a bullish thesis. The issue with the ETF is that it appeals to quality investors, while it is more of a disappointment for those on the lookout for value, even though the earnings yield looks solid. Its performance also contributes to a more pessimistic view. I dislike sector neutrality as a likely detractor from the fund’s returns this year. In case it had a lower allocation to IT and larger to energy, mostly to the oil & gas industry, its returns likely would have been much stronger.
Be the first to comment