


Justin Sullivan
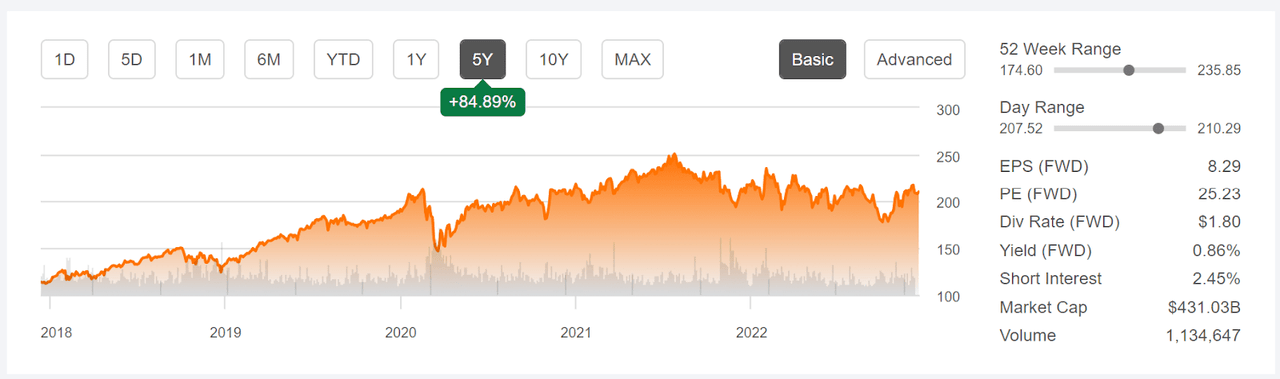
Visa (NYSE:V) is moving at a brisk pace in moving from a traditional credit card business model into the global digital payments space. Visa Direct, the company’s digital payments offering, has grown rapidly. Visa maintains the global payments network that many other financial firms rely on. Visa Direct also has its own peer-to-peer (P2P) payment service. With the growth of digital payments, along with robust consumer spending, Visa has built positive momentum in earnings growth. Visa has returned a total of 0.8% over the past 12 months. For comparison, the total return on the iShares U.S. Financial Services ETF (IYG), in which V is the second-largest holding, is -16%. The valuation of the shares has improved substantially over the past 18 months, thanks to steadily growing earnings and a decline in the share price from the all-time highs in mid-2021. At the current level of $210, the shares are slightly below the pre-COVID 2020 high closing price of $213.31 on February 19, 2020.
Seeking Alpha
5-Year price history and basic statistics for V (Source: Seeking Alpha)
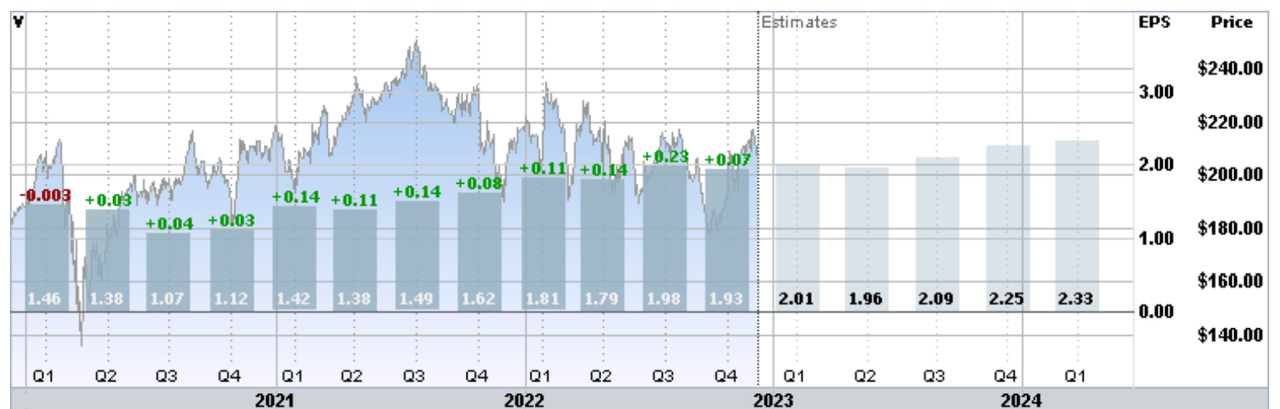
Visa reported Q4 FY 2022 results on October 25, 2022, beating expectations on earnings and revenue. The strength of the U.S. dollar reduced earnings, but payments volume was up 10% YoY and the company saw even higher growth in cross-border payments (see slide 3). Q4 was the 11th consecutive quarter that the company has beaten expectations on EPS. The steadiness of the earnings growth trajectory over the past two years is notable.
ETrade
Trailing (3 years) and estimate future quarterly EPS for V. Green (red) values are amounts by which EPS beat (missed) the consensus expected value (Source: ETrade)
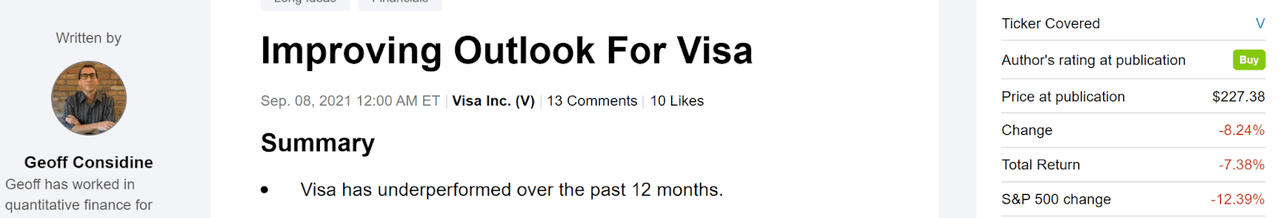
I last wrote about V 15 months ago, on September 8, 2021, at which time I upgraded the stock from a hold to a buy. At that time, the forward P/E was 38.7, which was high enough to raise concerns about valuation, although other leading firms in the digital payments space were even more expensive. The Wall Street consensus rating was a buy and the consensus 12-month price target was about 23% above the share price at that time. It was also notable that the spread in the individual analyst price targets was relatively low, indicating broad agreement as to the favorable view. The market-implied outlook, a probabilistic price forecast that represents the consensus view from the options market, was also moderately bullish. Even though the valuation was high, the positive views from both the Wall Street consensus and the market-implied outlook convinced me to upgrade the rating.
Seeking Alpha
Previous analysis of V and subsequent performance vs. the S&P 500 (Source: Seeking Alpha)
Over the 15 months since my post, V has modestly outperformed the S&P 500. Adding the dividends on the S&P 500 (not included by Seeking Alpha in the image above), V has beaten the S&P 500 (SPY) by 3% over this period.
For readers who are unfamiliar with the market-implied outlook, a brief explanation is needed. The price of an option on a stock is largely determined by the market’s consensus estimate of the probability that the stock price will rise above (call option) or fall below (put option) a specific level (the option strike price) between now and when the option expires. By analyzing the prices of call and put options at a range of strike prices, all with the same expiration date, it is possible to calculate a probabilistic price forecast that reconciles the options prices. This is the market-implied outlook. For a deeper explanation and background, I recommend this monograph published by the CFA Institute.
With V’s improved valuation and the company’s progress in building out its digital payments plan, I wanted to revisit my rating. I have calculated updated market-implied outlooks for V and compared these with the current Wall Street consensus outlook, as in my previous post.
Wall Street Consensus Outlook for V
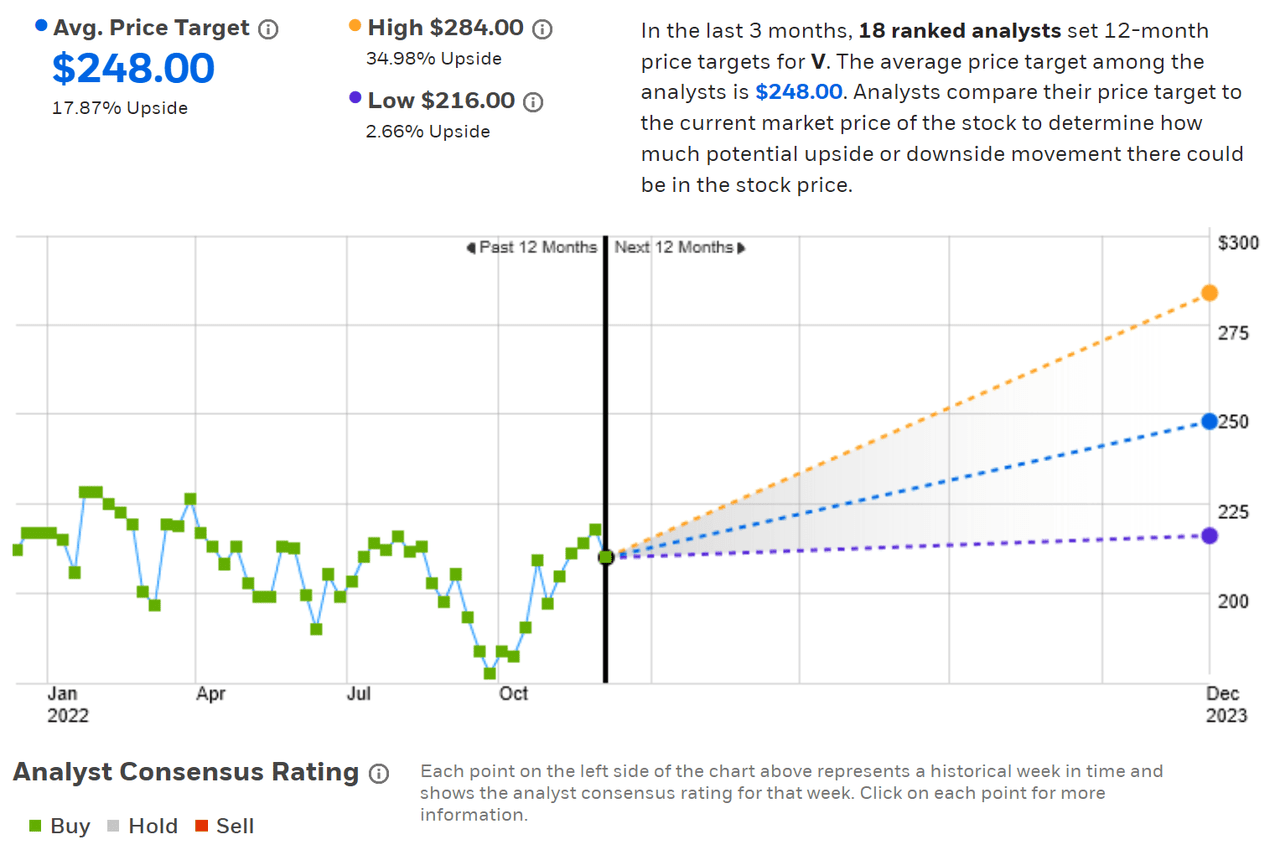
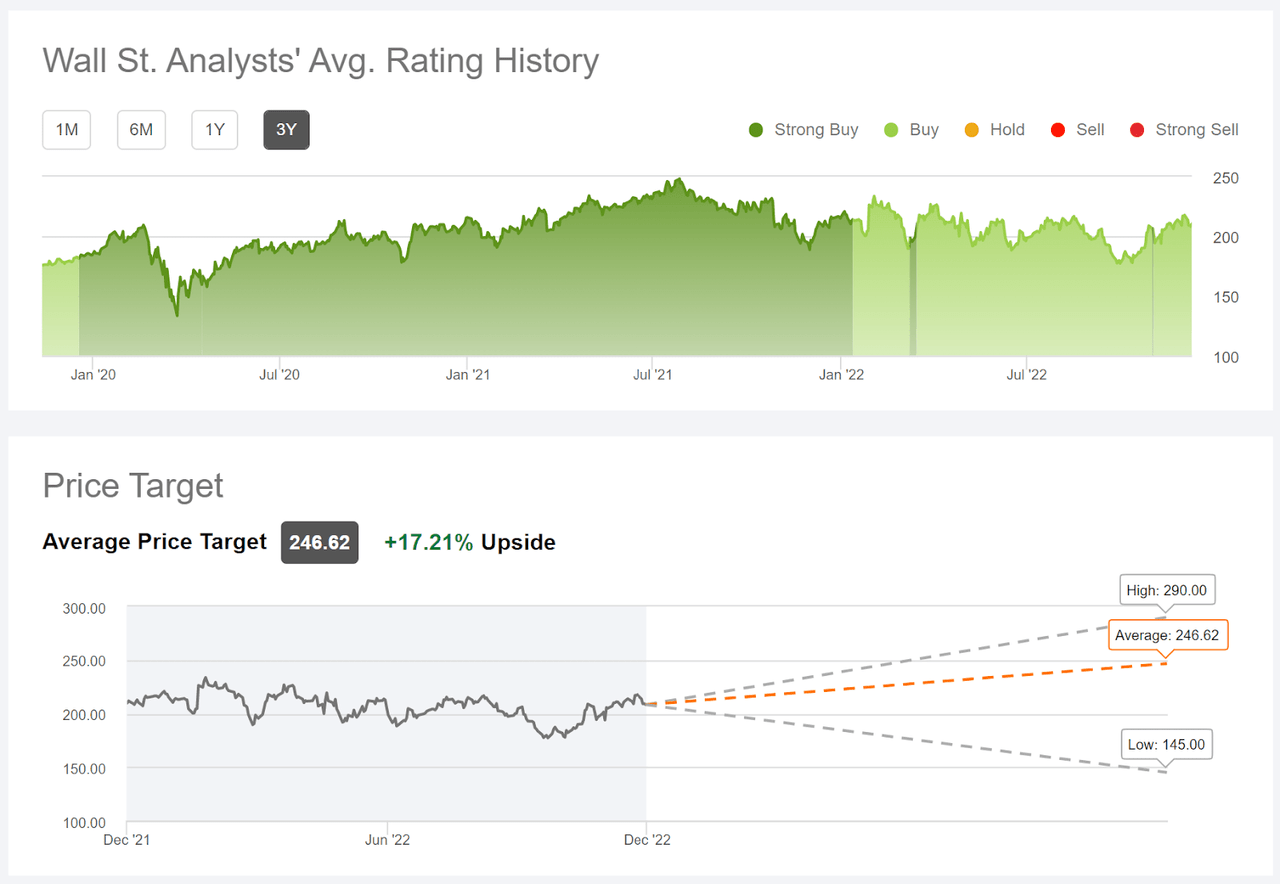
ETrade calculates the Wall Street consensus outlook for V using price targets and ratings from 18 ranked analysts who have published opinions over the last three months. The consensus rating is a buy, as it has been for all of the past 12 months, and the consensus 12-month price target is 17.9% above the current share price, for a total expected return of 18.7% over the next year. The spread in the individual analyst price targets is moderate.
ETrade
Wall Street analyst consensus rating and 12-month price target for V (Source: ETrade)
Seeking Alpha’s version of the Wall Street consensus outlook for V uses price targets and ratings from 34 analysts who have published their views in the last 90 days. The consensus rating is a buy and the consensus 12-month price target 17.2% above the current share price. The consensus rating has been either a buy or a strong buy for all of the past three years, a period during which the annualized total return for V is 5.4% per year, as compared to 9.7% per year for the S&P 500 (SPY) and 4.2% per year for the IYG. The dispersion in the individual analyst price targets is substantially wider in Seeking Alpha’s cohort, with the ratio of the highest lowest price targets equal to 2.0. As a rule of thumb, I tend to discount the consensus when this ratio comes in at 2.0 or higher.
Seeking Alpha
Wall Street analyst consensus rating and 12-month price target for V (Source: Seeking Alpha)
The Wall Street consensus outlook for V continues to be favorable. An expected total return of 18% or above would be very attractive for a large and generally-stable company like V.
Market-Implied Outlook for V
I have calculated the market-implied outlook for V for the 6.2-month period from now until June 16, 2023 and for the 13.4-month period from now until January 19, 2024, using the prices of options that expire on these dates. I selected these specific expiration dates to provide an outlook to the middle of 2023 and through the full year.
In my previous post, I had a 6.3-month outlook to March 0f 2022 which provides an interesting basis for comparison to the 6.2-month outlook to June of 2023.
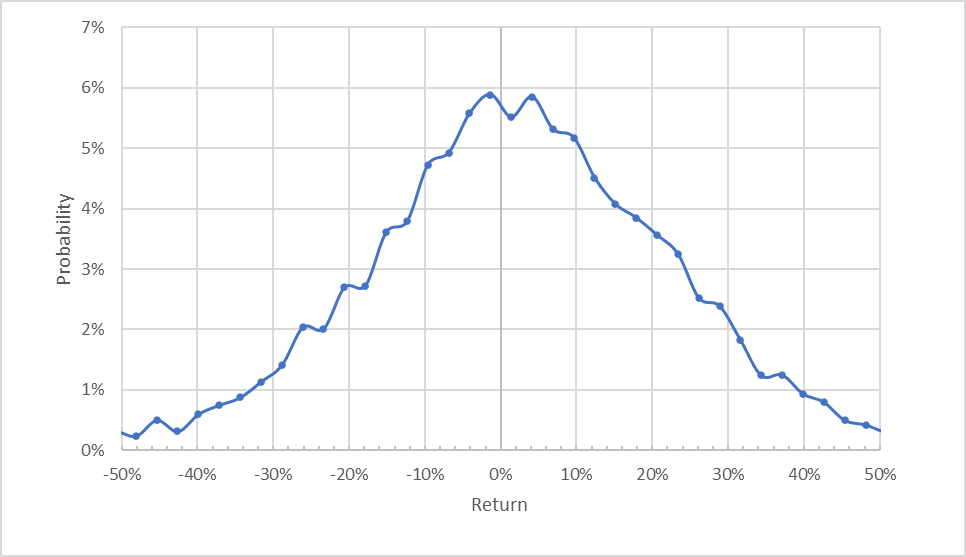
The standard presentation of the market-implied outlook is a probability distribution of price return, with probability on the vertical axis and return on the horizontal.
Geoff Considine
Market-implied price return probabilities for V for the 6.2-month period from now until June 16, 2023 (Source: Author’s calculations using options quotes from ETrade)
The market-implied outlook to the middle of 2023 is generally symmetric about a return of 0%. The expected volatility calculated from this distribution is 30.5% (annualized), as compared to ETrade’s calculation of 30% for the implied volatility of the options expiring on June 16, 2023.
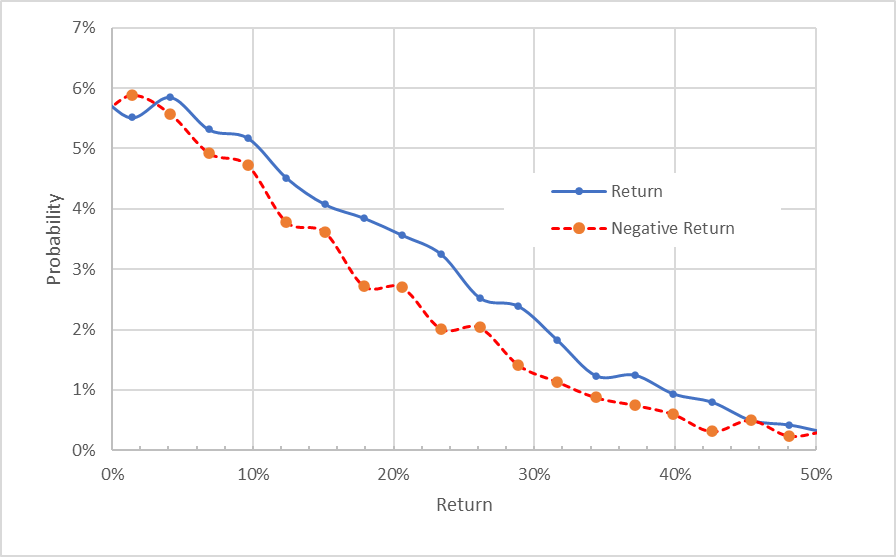
To make it easier to compare the relative probabilities of positive and negative returns, I rotate the negative return side of the distribution about the vertical axis (see chart below).
Geoff Considine
Market-implied price return probabilities for V for the 6.2-month period from now until June 16, 2023. The negative return side of the distribution has been rotated about the vertical axis (Source: Author’s calculations using options quotes from ETrade)
This view shows that there is a consistent shift in probabilities to favor positive returns. The probabilities of positive returns are consistently higher than the probabilities of negative returns of the same size (the blue line is above the dashed red line throughout most of the chart above). This is a bullish outlook for V.
Theory indicates that the market-implied outlook is expected to have a negative bias because investors, in aggregate, are risk averse and thus tend to pay more than fair value for downside protection. There is no way to measure the magnitude of this bias, or whether it is even present, however. The expectation of a negative bias reinforces the bullish interpretation of this outlook.
This outlook shows a markedly stronger bullish tilt than the 6.3-month outlook from my previous analysis.
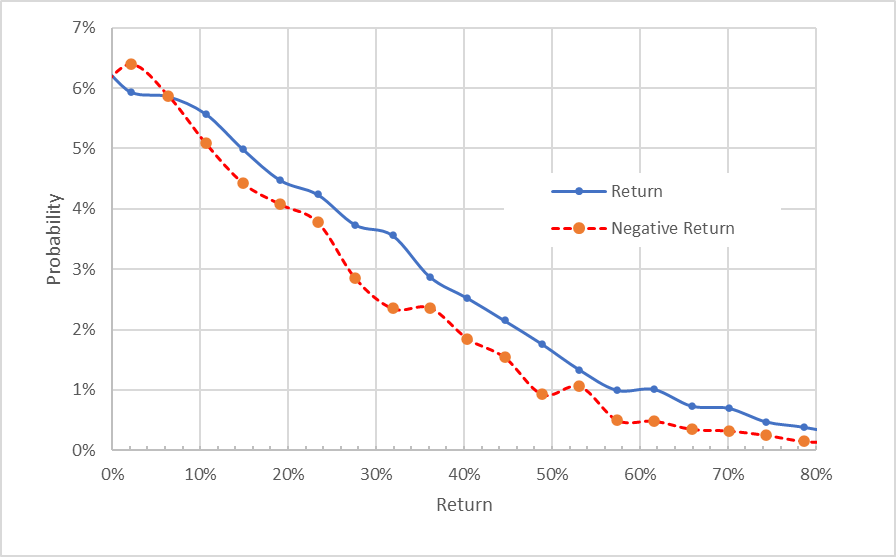
The market-implied outlook for the 13.4-month period from now until January 19, 2024 is also bullish, consistent with the outlook to the middle of 2023. The expected volatility calculated from this distribution is 30.1%.
Geoff Considine
Market-implied price return probabilities for V for the 13.4-month period from now until January 19, 2024. The negative return side of the distribution has been rotated about the vertical axis (Source: Author’s calculations using options quotes from ETrade)
Summary
Visa has performed well during the current market downturn, showing both the resilience of the company’s portfolio of financial services and growth potential of digital payments. The digital payments space includes many innovative and well-funded competitors, but Visa is well-positioned to lead. The Wall Street consensus rating on V continues to be a buy and the stock’s steady earnings growth supports this view. The consensus 12-month price target corresponds to an expected total return of about 18% over the next year. As a rule of thumb for a buy rating, I want to see an expected total return that is at least half the expected volatility (30% from the market-implied outlook and from ETrade’s implied volatility calculation). Taking the analyst consensus price target at face value, V meets this criterion. V’s forward P/E has also fallen considerably since my last post, adding a margin of safety. Finally, the market-implied outlooks for V are notably more bullish than in my previous analysis. I am maintaining a buy rating on V.
Be the first to comment