

RgStudio
I love bear markets because these are the absolute best times to buy the world’s best blue-chips.
Companies with exceptional safety, quality, and strong dividend growth records, that crash for no long-term fundamental reason.
Ycharts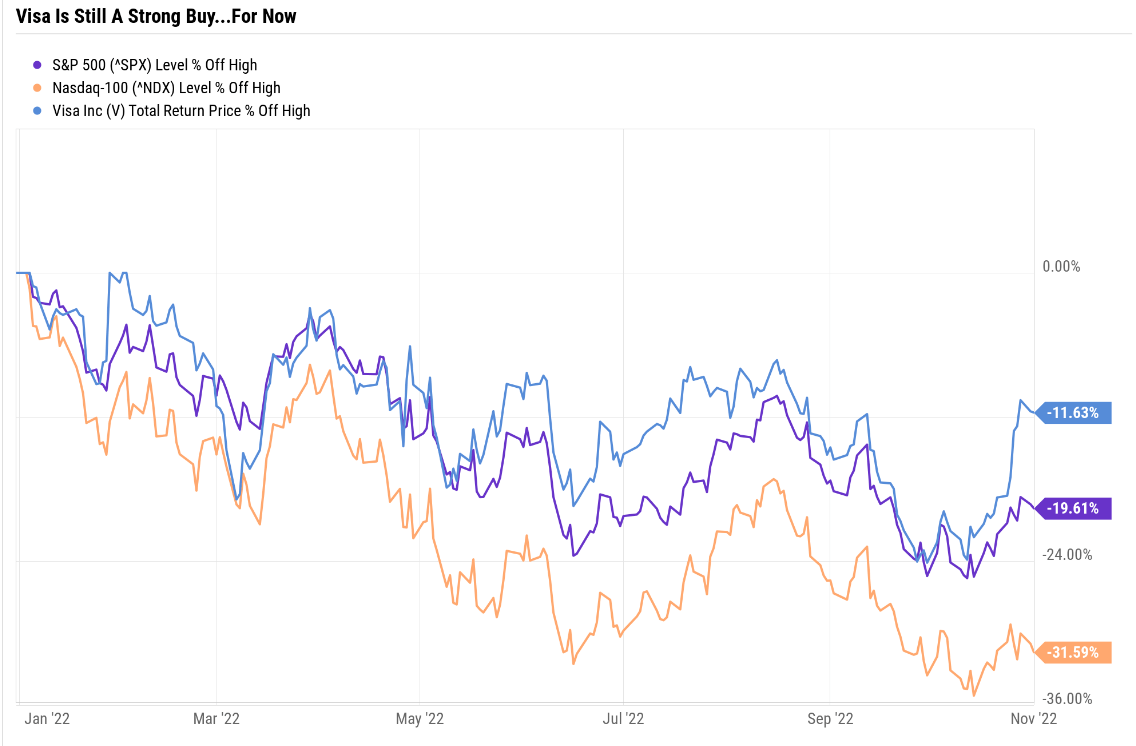
Visa (NYSE:V) has fallen as much as 24% in this bear market, and has recently recovered half of that decline.
Let me show you 3 reasons why Visa is a world-beater blue-chip strong buy, even after the recent rally. In fact, with the bear market bottom likely a lot closer than you think, this might be your last chance for several years to buy one of the world’s greatest companies at a highly attractive price.
Why?
State Street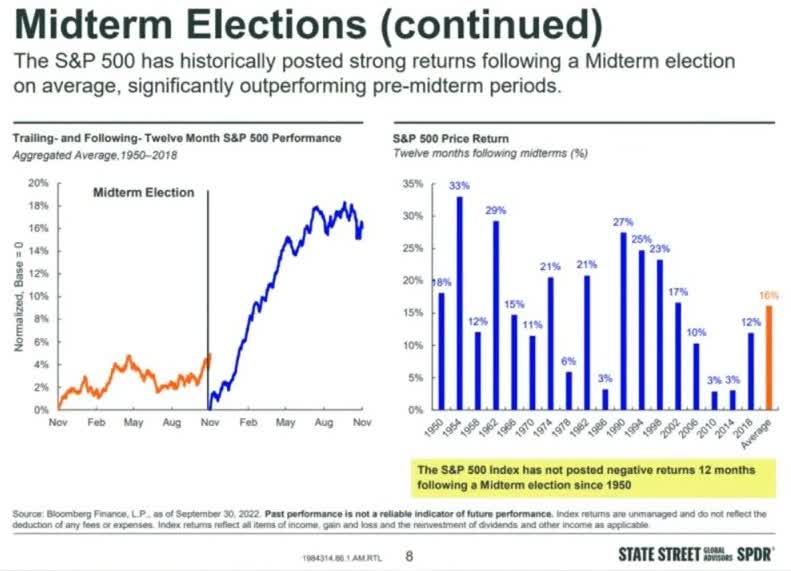
Because historically following mid-term elections stocks take off, averaging a 16% gain within 12 months.
Even if the blue-chip consensus is right and stocks bottom in Q1 or Q2 of 2023, there is no guarantee that Visa won’t simply retest the current price.
In other words, with a company this high quality, and growing this quickly, the biggest long-term risk is getting too greedy and waiting for a lower price that might never come.
Reason One: Visa Is One Of The World’s Greatest Dividend Growth Stocks
Here is the bottom line up front on Visa.
Reasons To Potentially Buy Visa Today
| Metric | Visa |
| Quality | 99% 13/13 Quality Ultra SWAN (Sleep Well At Night) Company |
| Risk Rating | Very Low Risk |
| DK Master List Quality Ranking (Out Of 500 Companies) | 9 |
| Quality Percentile | 98% |
| Dividend Growth Streak (Years) | 14 |
| Dividend Yield | 0.9% |
| Dividend Safety Score | 100% |
| Average Recession Dividend Cut Risk | 0.5% |
| Severe Recession Dividend Cut Risk | 1.00% |
| S&P Credit Rating | AA stable |
| 30-Year Bankruptcy Risk | 0.51% |
| LT S&P Risk-Management Global Percentile |
84% Very Good, Very Low Risk |
| Fair Value | $271.72 |
| Current Price | $206.93 |
| Discount To Fair Value | 24% |
| DK Rating |
Potential Strong Buy |
| PE | 23.9 |
| Cash-Adjusted PE | 19.5 |
| Historical PE | 27.5 to 32.5 |
| LT Growth Consensus/Management Guidance | 17.8% |
| PEG Ratio | 1.1 (Hyper-Growth At A Reasonable Price) |
| 5-year consensus total return potential |
13% to 20% CAGR |
| Base Case 5-year consensus return potential |
18% CAGR (3X the S&P 500) |
| Consensus 12-month total return forecast | 21% |
| Fundamentally Justified 12-Month Return Potential | 32% |
| LT Consensus Total Return Potential | 18.7% |
| Inflation-Adjusted Consensus LT Return Potential | 17.8% |
| Consensus 10-Year Inflation-Adjusted Total Return Potential (Ignoring Valuation) | 5.15 |
| LT Risk-Adjusted Expected Return | 14.00% |
| LT Risk-And Inflation-Adjusted Return Potential | 11.71% |
| Conservative Years To Double | 6.15 |
(Source: DK Zen Research Terminal)
Visa is one of the world’s greatest companies. In fact, it’s in the top 2% of the world’s greatest blue-chips.
Why? How about an AA-stable credit rating which means a 0.55% 30-year bankruptcy risk?
GuruFocus Premium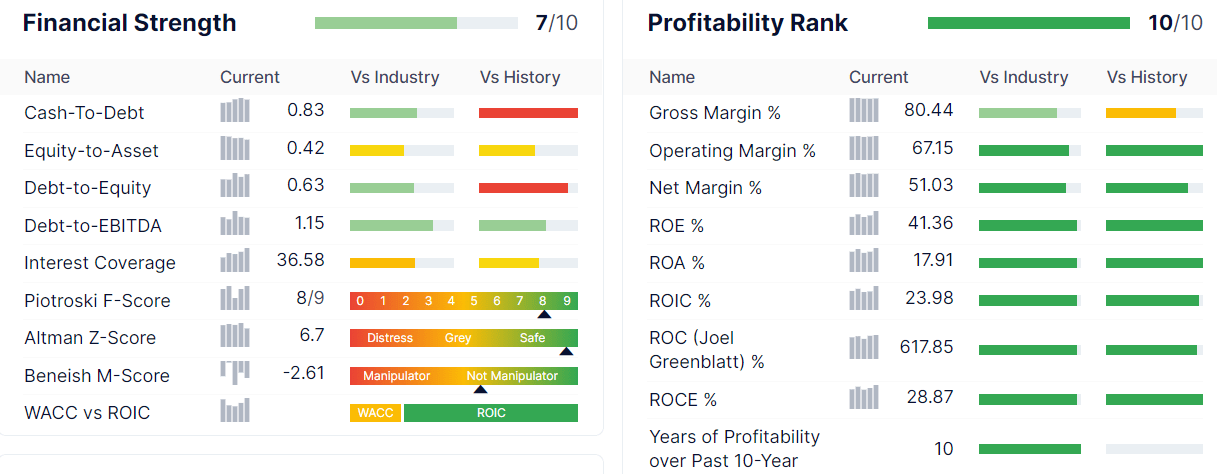
Visa’s balance sheet is a fortress with $20 billion in cash, and a net debt/EBITDA of 0.2 (3.0 or less is safe for this industry according to rating agencies).
It’s cash flows cover interest expenses 37X vs 8+ safe according to rating agencies.
And in terms of profitability, Wall Street’s favorite quality proxy? It’s historical profitability is in the top 5% of its peers, with 51% net margins over the last year.
It’s free cash flow margin? 61% in the last year.
- $0.61 of every $1 in sales is dropping straight to the bottom line
- top 1% of all companies on earth
Joel Greenblatt, one of the greatest investors in history with 40% annual returns for 21 years, considers return on capital or ROC the gold standard proxy for quality and moatiness.
- ROC = annual pre-tax profits/the cost of running the business
The S&P 500’s ROC in 2021 was 14.6% and the dividend aristocrats, the bluest of blue-chips, generate 105% ROC.
Visa? 618% or 6X more than the dividend aristocrats and 42X that of the average S&P 500 company.
- According to Joel Greenblatt Visa is 42X higher quality than the average S&P 500 company and 6X higher quality than the average dividend aristocrat
Today Visa is trading at a 24% historical discount and a PEG of 1.01 (historical average 1.14).
What does that mean for blue-chip dividend growth investors looking to buy the ultimate Buffett-style “Wonderful company at a fair price”?
Visa 2024 Consensus Total Return Potential
(Source: FAST Graphs, FactSet)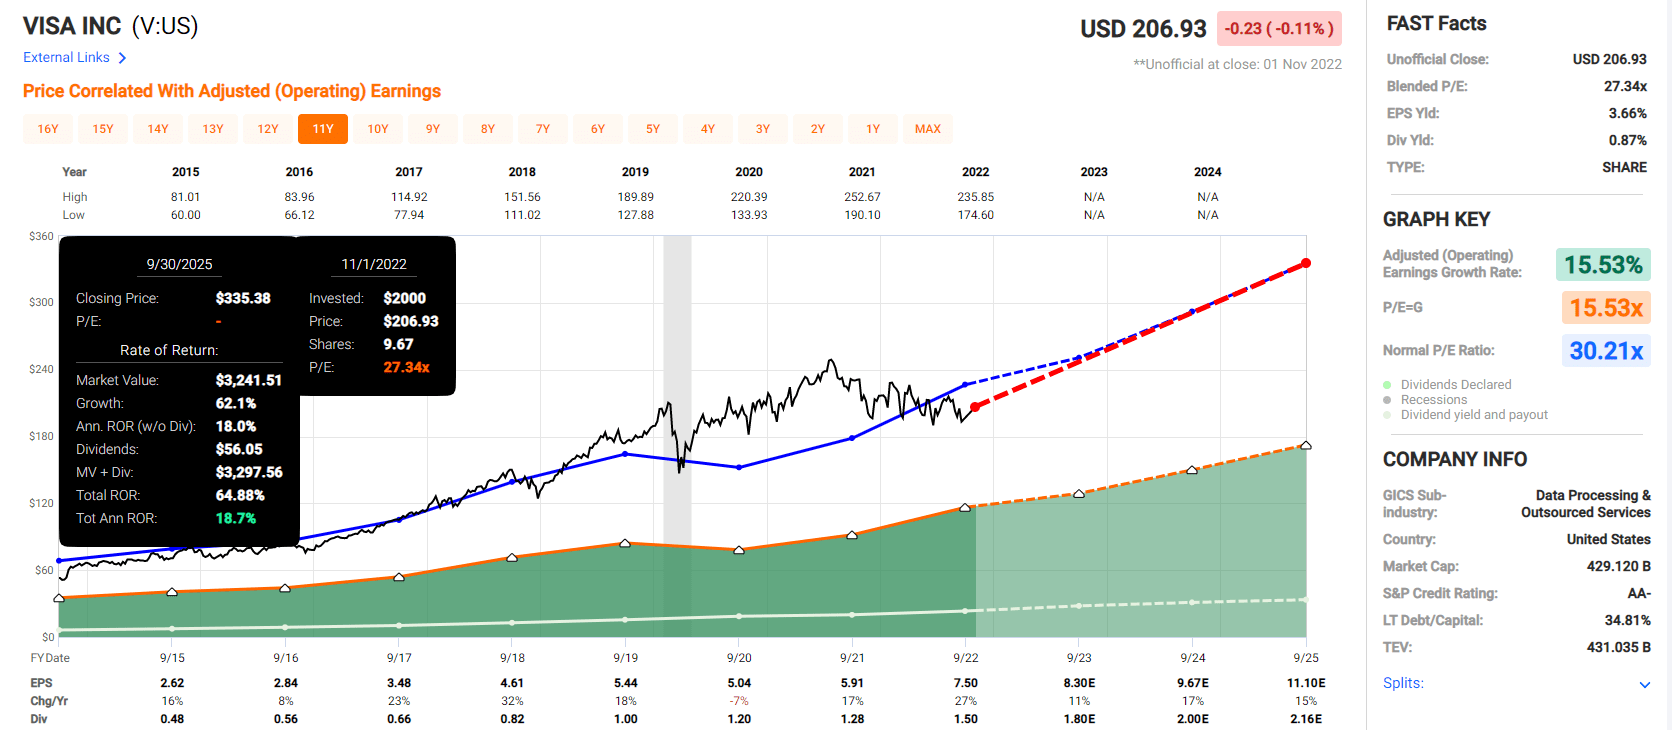
If Visa grows as expected and returns to historical fair value by mid 2025 investors could make 65% returns of 19% annually.
- about 2X the S&P consensus
- Buffett-style returns from a blue-chip bargain hiding in plain sight
Visa 2028 Consensus Total Return Potential
(Source: FAST Graphs, FactSet)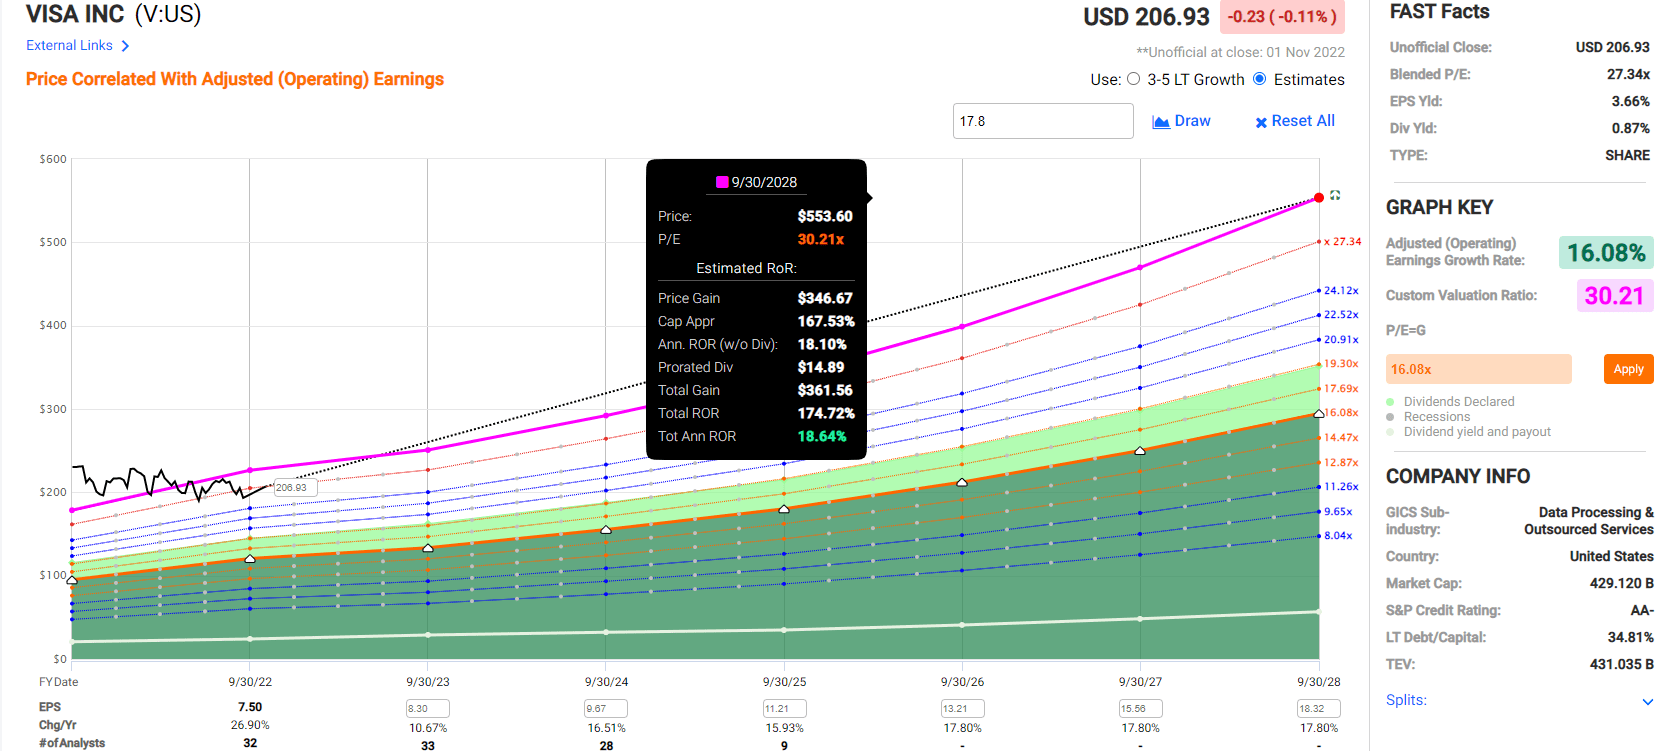
If Visa grows as expected over the next five years it could almost triple delivering 19% annual returns.
- 3X the S&P consensus
- 12% to 20% CAGR margin-of-error adjusted consensus total return range
Visa Investment Decision Score
DK (Source: Dividend Kings Automated Investment Decision Tool)
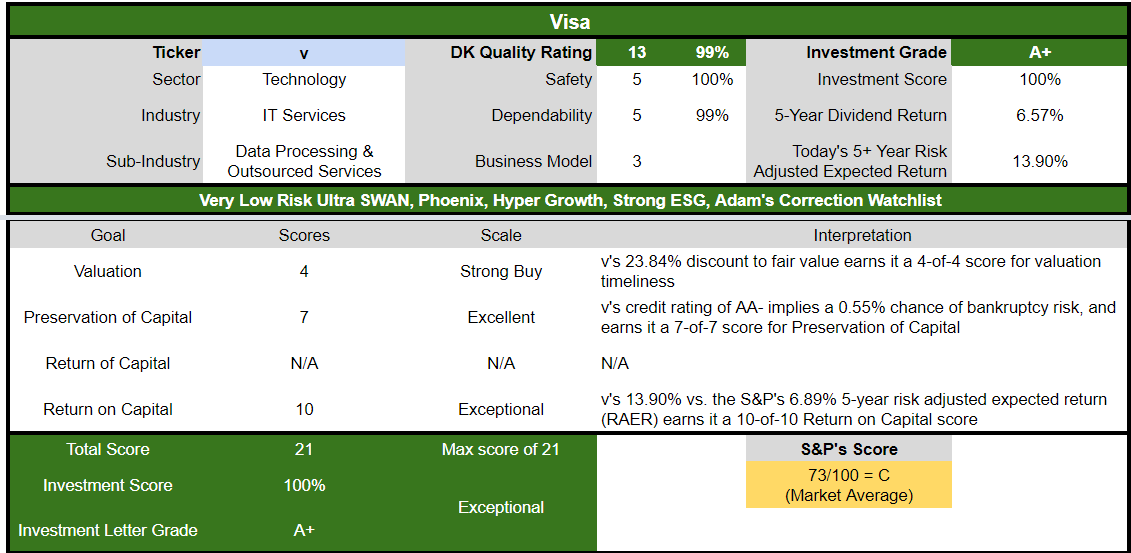
Visa is as close to a perfect hyper-growth dividend growth blue-chip opportunity as exists on Wall Street for anyone comfortable with its risk profile. Look at how it compares to the S&P 500.
- 24% discount to fair value vs. 1% S&P = 23% better valuation
- almost 2X better long-term annual return potential
- 2X higher risk-adjusted expected returns
Reason Two: Exceptional Long-Term Growth Prospects
Visa is a somewhat unique company in that it is a longtime, established market leader that still enjoys strong growth prospects. Despite the ongoing evolution of the payments industry, we think a wide moat surrounds the business and that Visa’s position in the global electronic payment infrastructure is essentially unassailable.
The shift toward electronic payments has driven Visa’s growth historically, and we expect that to continue for the foreseeable future. Digital payments, on a global basis, surpassed cash payments just a few years ago, suggesting this trend still has a lot of room to run.” – Morningstar
Just over 15% of global transactions are done electronically, the rest is still cash. This gives Visa a very long growth runway and here’s the growth analysts expect in the medium-term.
| Metric | 2021 Growth Consensus | 2022 Growth Consensus | 2023 Growth Consensus | 2024 Growth Consensus |
2025 Growth Consensus |
| Sales | 12% | 25% | 13% | 12% | 11% |
| Dividend | 7% | 17% | 12% (Official) | 12% | 11% |
| EPS | 17% | 27% | 11% | 17% | 15% |
| Operating Cash Flow | 48% | 27% | 3% | 14% | 12% |
| Free Cash Flow | 28% | 2% | 14% | 14% | 14% |
| EBITDA | 14% | 27% | 13% | 13% | 12% |
| EBIT (operating income) | 14% | 28% | 14% | 13% | 13% |
(Source: FAST Graphs, FactSet)
And industry leader with what Morningstar calls an “unassailable moat” and it’s still growing at double-digits.
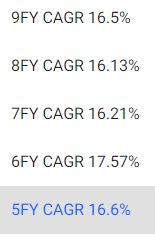
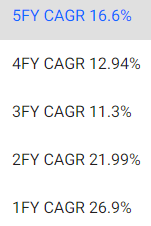
Long-Term Growth Outlook
(Source: FactSet Research Terminal)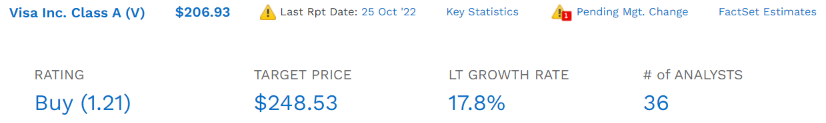
The median long-term growth consensus from all 36 analysts covering Visa is 17.8% long-term growth, similar to the 20% CAGR it’s grown since its IPO.
FAST Graphs, FactSet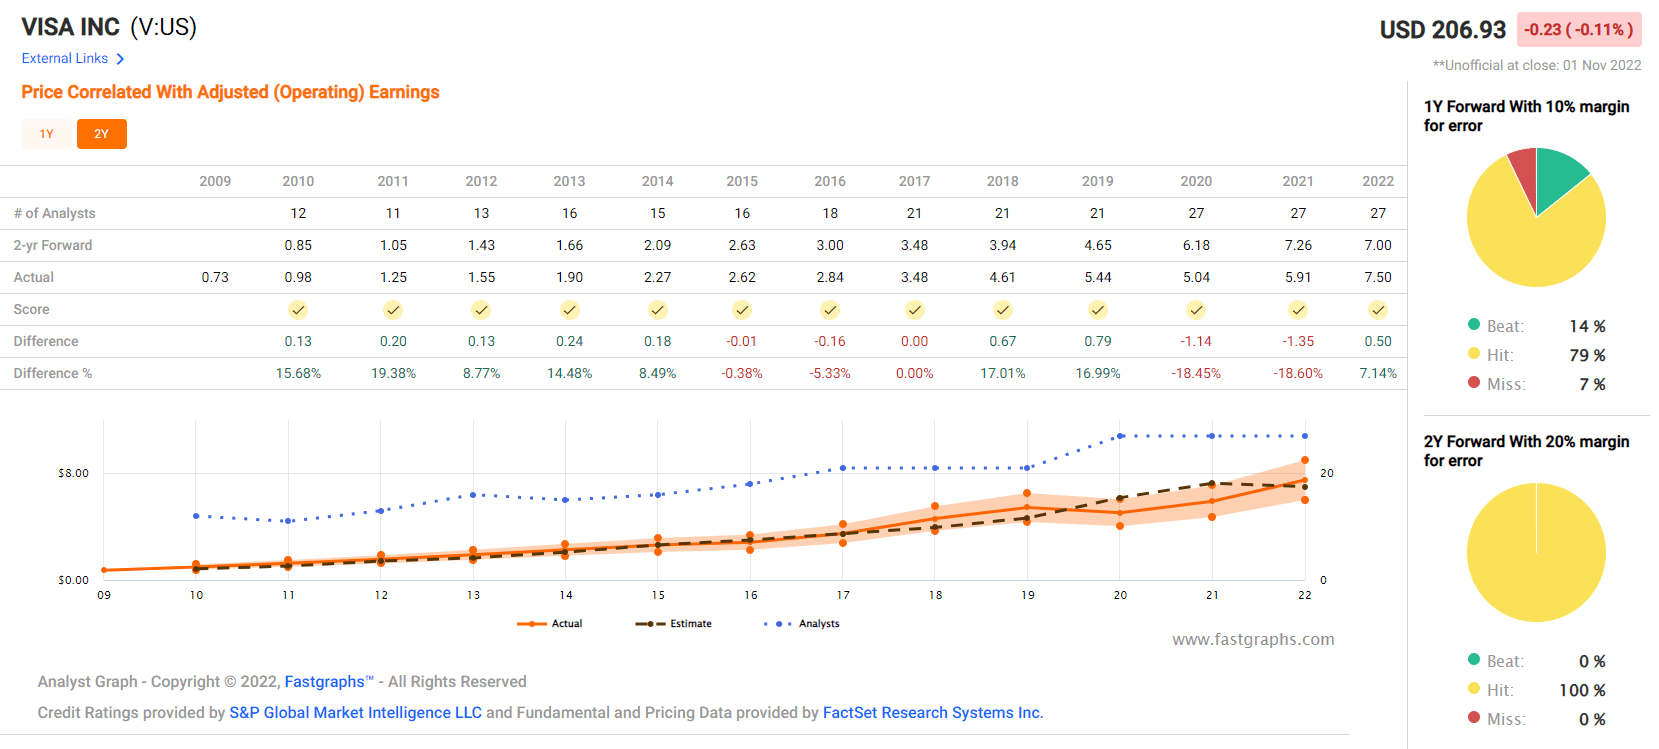
Visa’s business is so stable and its management so good that it basically almost always grows as analysts expect.
FAST Graphs, FactSet FAST Graphs, FactSet FAST Graphs, FactSet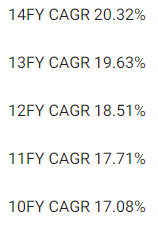
Visa is expected to keep growing at its historical rate, potentially for a few more decades, thanks to having an addressable market measured in the tens of trillions.
Long-Term Return Potential: Ignoring Valuation
| Investment Strategy | Yield | LT Consensus Growth | LT Consensus Total Return Potential | Long-Term Risk-Adjusted Expected Return | Long-Term Inflation And Risk-Adjusted Expected Returns | Years To Double Your Inflation & Risk-Adjusted Wealth |
10-Year Inflation And Risk-Adjusted Expected Return |
| Visa | 1% | 17.8% | 18.7% | 13.1% | 10.8% | 6.7 | 2.79 |
| Nasdaq | 0.8% | 11.8% | 12.5% | 8.6% | 6.3% | 11.4 | 1.85 |
| Schwab US Dividend Equity ETF | 3.5% | 8.5% | 12.0% | 8.4% | 6.2% | 11.7 | 1.82 |
| Dividend Aristocrats | 2.6% | 8.5% | 11.1% | 7.8% | 5.5% | 13.1 | 1.71 |
| S&P 500 | 1.8% | 8.5% | 10.3% | 7.2% | 4.9% | 14.6 | 1.62 |
(Source: DK Research Terminal, Morningstar, FactSet, Ycharts)
Visa is expected to keep running circles around almost every popular investment strategy on Wall Street, including the dividend aristocrats, S&P and the Nasdaq.
Visa Total Returns Since 2008
(Source: Portfolio Visualizer Premium)
Visa has been delivering Buffett-like 20% returns since its IPO, doubling the market’s returns, just as analysts expect in the future.
(Source: Portfolio Visualizer Premium)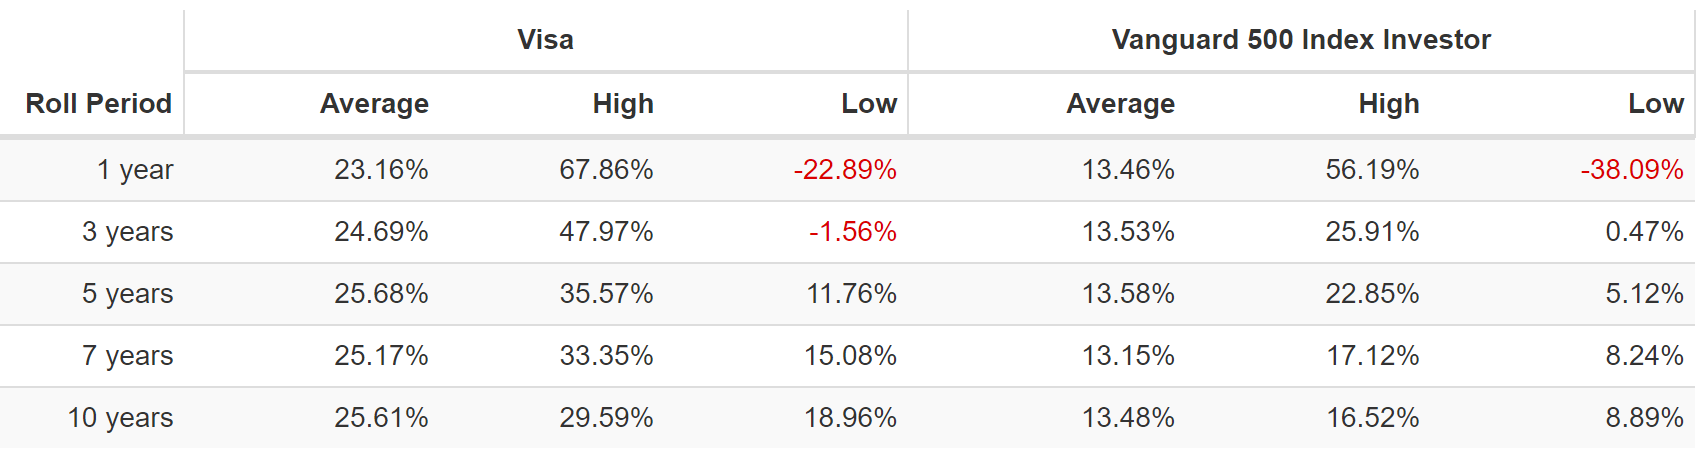
From bear market lows it’s capable of as much as 30% annual returns for the next 10 years and 36% annual returns for the next five.
- 4.7X returns in 5 years
- 14X return in 10 years
(Source: Portfolio Visualizer Premium)
Visa might not yield much today but over time its hyper-growth rate really adds up.
- 2009 yield: 0.7%
- 2022 yield on cost: 10.5%
- income growth over 13 years: 23.2% CAGR = 3X faster than the S&P 500
Inflation-Adjusted Consensus Total Return Potential: $1,000 Initial Investment
| Time Frame (Years) | 8.0% CAGR Inflation-Adjusted S&P 500 Consensus | 8.8% Inflation-Adjusted Aristocrat Consensus | 16.4% CAGR Inflation-Adjusted Visa Consensus | Difference Between Inflation-Adjusted Visa Consensus And S&P Consensus |
| 5 | $1,468.65 | $1,526.66 | $2,139.56 | $670.91 |
| 10 | $2,156.93 | $2,330.70 | $4,577.72 | $2,420.79 |
| 15 | $3,167.77 | $3,558.19 | $9,794.30 | $6,626.54 |
| 20 | $4,652.33 | $5,432.16 | $20,955.50 | $16,303.16 |
| 25 | $6,832.64 | $8,293.08 | $44,835.54 | $38,002.90 |
| 30 | $10,034.74 | $12,660.73 | $95,928.34 | $85,893.60 |
(Source: DK Research Terminal, FactSet)
If Visa grows as expected, 16.4% adjusted for inflation, then it could deliver nearly 5X real returns over the next decade, and could be a potential 21X bagger over the next 20.
| Time Frame (Years) | Ratio Inflation-Adjusted Visa Consensus/Aristocrat Consensus | Ratio Inflation-Adjusted Visa Consensus vs. S&P consensus |
| 5 | 1.40 | 1.46 |
| 10 | 1.96 | 2.12 |
| 15 | 2.75 | 3.09 |
| 20 | 3.86 | 4.50 |
| 25 | 5.41 | 6.56 |
| 30 | 7.58 | 9.56 |
(Source: DK Research Terminal, FactSet)
That’s twice the return potential of the S&P over a decade and 5X over the next 20 years.
Reason Three: A Wonderful Company At A Wonderful Price
(Source: FAST Graphs, FactSet) (Source: FAST Graphs, FactSet)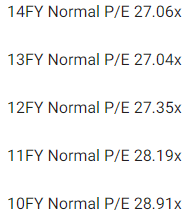
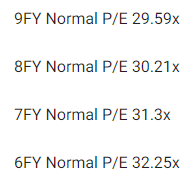
For 14 years, outside of bear markets and bubbles, billions of investors have paid 27X to 32X earnings for Visa.
- a 90% statistical probability this range includes historical fair value
| Metric | Historical Fair Value Multiples (15-Years) | 2021 | 2022 | 2023 | 2024 | 2025 | 12-Month Forward Fair Value |
| 5-Year Average Yield | 0.63% | $212.70 | $285.71 | $285.71 | $315.87 | $339.68 | |
| 13-Year Median Yield | 0.63% | $212.70 | $285.71 | $285.71 | $315.87 | $339.68 | |
| 15- Year Average Yield | 0.69% | $194.20 | $260.87 | $260.87 | $288.41 | $310.14 | |
| Earnings | 30.21 | $82.17 | $232.92 | $261.32 | $292.13 | $338.65 | |
| Average | $115.48 | $264.43 | $272.85 | $302.52 | $331.54 | $271.72 | |
| Current Price | $206.93 | ||||||
|
Discount To Fair Value |
-79.19% | 21.75% | 24.16% | 31.60% | 37.58% | 23.84% | |
|
Upside To Fair Value (including dividend) |
-44.19% | 27.79% | 31.86% | 46.20% | 60.22% | 32.18% | |
| 2022 EPS | 2023 EPS | 2022 Weighted EPS | 2023 Weighted EPS | 12-Month Forward EPS | Historical Average Fair Value Forward PE | Current Forward PE |
Current Forward Cash-Adjusted PE |
| $7.71 | $8.65 | $1.04 | $7.49 | $8.52 | 31.9 | 24.3 | 19.5 |
Visa’s historical fair value, including a very stable dividend yield, is about 32X earnings, and today it trades at 24.3X, 19.5X adjusted for cash.
- a 1.1 PEG, hyper-growth Ultra SWAN at a reasonable price according to Peter Lynch
| Rating | Margin Of Safety For Very Low Risk 13/13 Ultra SWAN Quality Companies | 2022 Fair Value Price | 2023 Fair Value Price |
12-Month Forward Fair Value |
| Potentially Reasonable Buy | 0% | $264.43 | $272.85 | $271.72 |
| Potentially Good Buy | 5% | $251.21 | $259.21 | $258.13 |
| Potentially Strong Buy | 15% | $224.77 | $231.92 | $230.96 |
| Potentially Very Strong Buy | 25% | $188.41 | $204.64 | $203.79 |
| Potentially Ultra-Value Buy | 35% | $171.88 | $177.35 | $176.62 |
| Currently | $206.93 | 21.75% | 24.16% | 23.84% |
| Upside To Fair Value (Including Dividends) | 28.66% | 32.73% | 32.18% |
Visa is a potentially strong buy for anyone comfortable with its risk profile and very close to its very strong buy price.
Risk Profile: Why Visa Isn’t Right For Everyone
There are no risk-free companies and no company is right for everyone. You have to be comfortable with the fundamental risk profile.
Visa’s revenue is tied to the amount and volume of consumer purchases, which creates macroeconomic sensitivity. Both Visa and Mastercard have paid substantial fines historically related to the oligopolistic nature of the industry, and legal and regulatory risk is intrinsic to the business model, given merchants’ desires to lower fees. While Visa’s and Mastercard’s positions in the current electronic payment industry are largely set, it continues to evolve in ways that could reduce their volume or profitability. Some governments have shown a preference for local payment networks, which could freeze Visa out of certain markets and impede the value it drives from its global network.
We see the company’s largest ESG risk as data security. Any company involved in processing payments has potential exposure to breaches in its systems.” – Morningstar
Visa’s Risk Profile Includes
- modest economic cyclicality (7% EPS decline in the pandemic)
- disruption risk (large institutions are trying to create replacements to the Visa network, including through blockchain)
- political/regulatory risk – anti-trust risk domestically and globally
- M&A execution risk (small bolt-on acquisitions)
- labor retention risk (tightest job market in over 50 years and finance is a high paying industry)
- cybersecurity risk: hackers and ransomware
- currency risk: 54% of sales are from outside the US
Long-Term Risk Management Analysis: How Large Institutions Measure Total Risk
- see the risk section of this video to get an in-depth view (and link to two reports) of how DK and big institutions measure long-term risk management by companies
DK uses S&P Global’s global long-term risk-management ratings for our risk rating.
- S&P has spent over 20 years perfecting their risk model
- which is based on over 30 major risk categories, over 130 sub categories, and 1,000 individual metrics
- 50% of metrics are industry specific
- this risk rating has been included in every credit rating for decades
The DK risk rating is based on the global percentile of how a company’s risk management compares to 8,000 S&P-rated companies covering 90% of the world’s market cap.
Visa Scores 84th Percentile On Global Long-Term Risk Management
S&P’s risk management scores factor in things like:
- supply chain management
- crisis management
- efficiency
- labor relations
- talent retention and training
- innovation management
- privacy protection
- information/cyber security
- customer relationship management
- climate strategy adaptation
- environmental policy management
- corporate governance
- brand management
Visa’s Long-Term Risk Management Is The 120th Best In The Master List (76 Percentile In The Master List)
| Classification | S&P LT Risk-Management Global Percentile |
Risk-Management Interpretation |
Risk-Management Rating |
| BTI, ILMN, SIEGY, SPGI, WM, CI, CSCO, WMB, SAP, CL | 100 | Exceptional (Top 80 companies in the world) | Very Low Risk |
| Strong ESG Stocks | 86 |
Very Good |
Very Low Risk |
| Visa | 84 |
Very Good |
Very Low Risk |
| Foreign Dividend Stocks | 77 |
Good, Bordering On Very Good |
Low Risk |
| Ultra SWANs | 74 | Good | Low Risk |
| Dividend Aristocrats | 67 | Above-Average (Bordering On Good) | Low Risk |
| Low Volatility Stocks | 65 | Above-Average | Low Risk |
| Master List average | 61 | Above-Average | Low Risk |
| Dividend Kings | 60 | Above-Average | Low Risk |
| Hyper-Growth stocks | 59 | Average, Bordering On Above-Average | Medium Risk |
| Dividend Champions | 55 | Average | Medium Risk |
| Monthly Dividend Stocks | 41 | Average | Medium Risk |
(Source: DK Research Terminal)
Visa’s risk-management consensus is in the top 24% of the world’s highest quality companies and similar to that of such other blue-chips as:
- Lowe’s (LOW): Ultra SWAN dividend king
- T. Rowe Price (TROW): Ultra SWAN dividend aristocrat
- BlackRock (BLK): Ultra SWAN
- 3M (MMM): Ultra SWAN dividend king
- Royal Bank of Canada (RY): Ultra SWAN
The bottom line is that all companies have risks, and Visa is very good, at managing theirs according to S&P.
How We Monitor Visa’s Risk Profile
- 36 analysts
- two credit rating agencies
- 38 experts who collectively know this business better than anyone other than management
When the facts change, I change my mind. What do you do, sir?” – John Maynard Keynes
There are no sacred cows at iREIT or Dividend Kings. Wherever the fundamentals lead, we always follow. That’s the essence of disciplined financial science, the math behind retiring rich and staying rich in retirement.
Bottom Line: Buy Visa Now While You Still Have The Chance
Let me be clear: I’m NOT calling the bottom in Visa (I’m not a market-timer).
Sleep Well At Night doesn’t mean “can’t fall hard in a bear market.”
Fundamentals are all that determine safety and quality, and my recommendations.
- over 30+ years, 97% of stock returns are a function of pure fundamentals, not luck
- in the short term; luck is 25X as powerful as fundamentals
- in the long term, fundamentals are 33X as powerful as luck
While I can’t predict the market in the short term, here’s what I can tell you about Visa.
- One of the highest quality, safest, and most dependable hyper-growth blue-chips on earth.
- 18.7% CAGR long-term total return consensus, better than almost any popular investment strategy.
- 24% historically undervalued, a potentially strong buy
- 19.5X cash-adjusted earnings (1.1 PEG, hyper-growth at a reasonable price)
- 160% consensus return potential over the next five years, 18% CAGR, about 3X more than the S&P 500
- 2X the risk-adjusted expected returns of the S&P 500 over the next five years
If you want to take advantage of this bear market, Visa is a great way to do that.
This company’s AA-credit rating, incredible profitability, 86th percentile risk management, and 18% growth rate is the stuff rich retirement dreams are made of.
And today you can buy it at an attractive 24% historical discount, making it a potentially strong buy for anyone comfortable with its risk profile.
Be the first to comment