

David Lienemann/Getty Images News
This year’s sea of red across sectors and industries has been tough for the bulls. One niche, though, has seen some positive relative price action in 2022. Aerospace and defense stocks, as measured through several popular ETFs are flat to even positive. The three largest industry funds are the iShares U.S. Aerospace & Defense ETF (ITA), the Invesco Aerospace & Defense ETF (PPA), and the SPDR S&P Aerospace & Defense ETF (XAR). The second-largest holding in XAR is a volatile and speculative stock: Virgin Galactic (NYSE:SPCE).
SPY vs. Popular Aerospace & Defense ETFs YTD
Stockcharts.com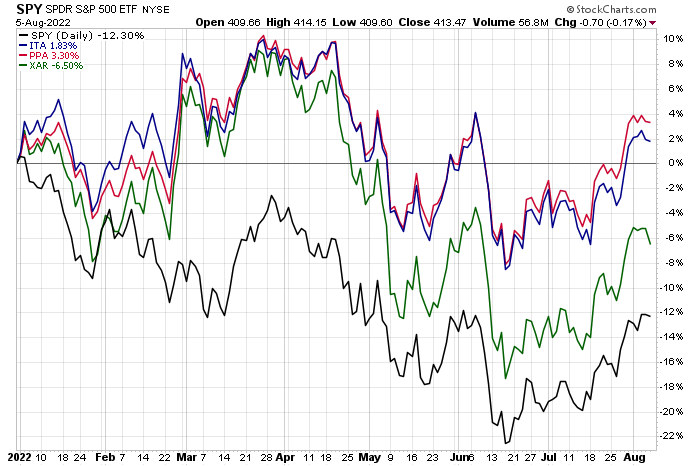
According to Bank of America Global Research, Virgin Galactic designs and manufactures spacecraft and carrier aircraft intended for commercial space tourism. Unlike airlines or commercial aircraft OEMs, SPCE plans to operate commercially and has nearly full vertical integration capabilities in structures, assembly, propulsion, and avionics. The concept company is not yet profitable and commercial operations have not yet begun. Commercial operations are expected to begin in 2022.
The California-based $1.75 billion market cap Industrial sector stock in the Aerospace & Defense industry features earnings that are solidly in the red, according to The Wall Street Journal. There’s extremely high short interest in SPCE – to the tune of 24.6%. Last Thursday night’s Q2 earnings report was met with intense selling pressure Friday. Shares cratered as the firm postponed commercial flights and plans to sell up to $300 million worth of common equity, according to MT Newswires.
Analysts at BofA see losses per share improving through 2024, but that is a long time to wait for potential profits to occur. Moreover, the company does not generate positive free cash flow. This is a dismal fundamental situation. The company’s debt is also concerning – its debt to assets ratio is above 40% according to Fidelity Investments.
SPCE: EPS, Valuation, Free Cash Flow Forecasts
BofA Global Research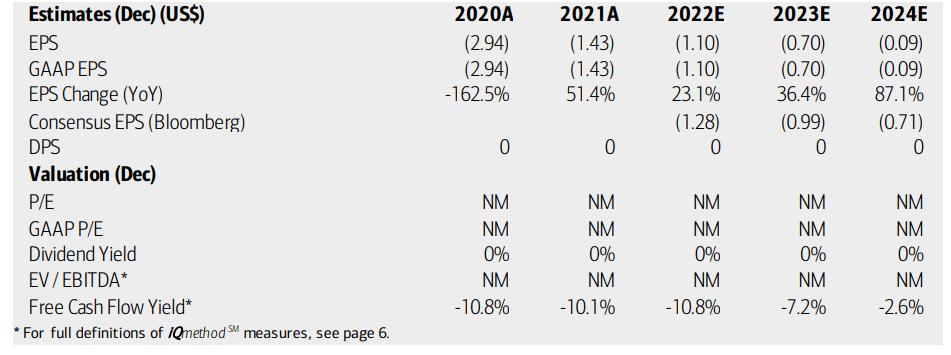
Virgin Galactic’s corporate event calendar is light now that Q2 earnings are in the books. The next quarterly report is unconfirmed for Monday, November 7th, AMC, according to Wall Street Horizon.
Virgin Galactic Corporate Event Calendar
Stockcharts.com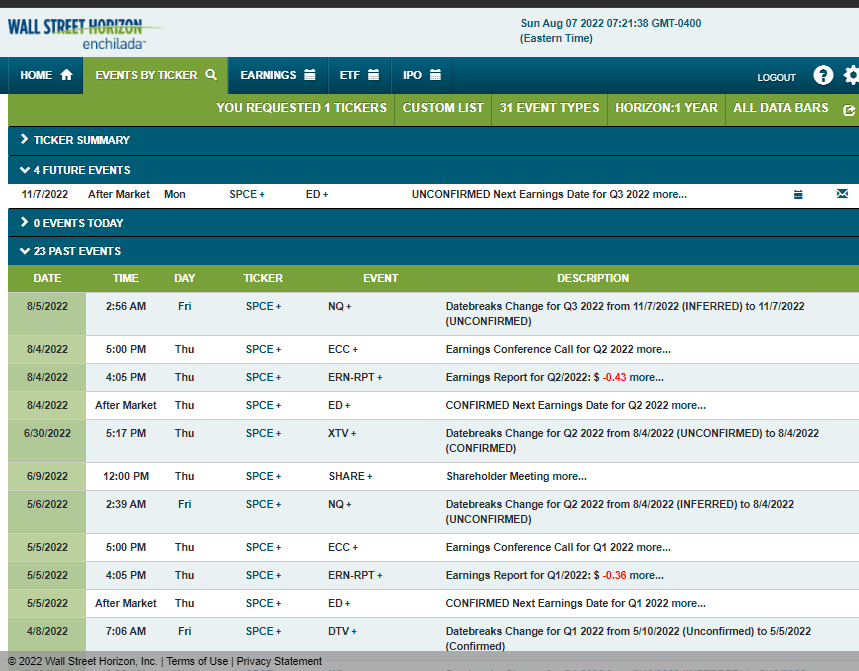
The Technical Take On Virgin Galactic Stock
What a wild ride it has been for SPCE since late 2019. Shares skyrocketed from the single digits a few years ago to above $60 at the meme stock mania crescendo of February 2021. Remarkably, the stock plunged to $14 late in the first half of last year before thrusters turn on again – sending shares back up to near $60.
The last 13 months have been brutal for Virgin Galactic bulls though. The stock fell a whopping 91% in less than a year. After optimism built off the May low of $5 to last week’s high near $8.50, bears roared following a second consecutive EPS miss.
Friday’s price action suggests while short-term rallies might happen, the bears remain in control. There’s resistance at $11 and $14. The $6.50 to $6.70 area could be interesting from a support point of view, but I would avoid the stock given this downtrend.
SPCE: Bearish Double Top & Downtrend
Stockcharts.com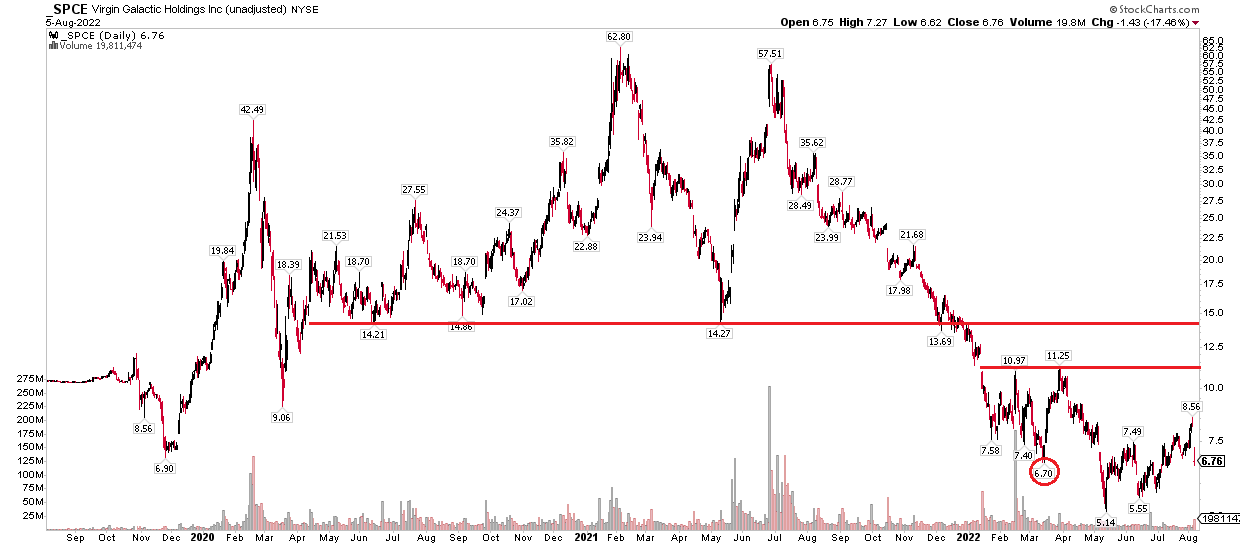
The Bottom Line
SPCE looks challenged from here. Negative earnings and a bearish chart make me recommend avoiding the stock. While there could be some weak near-term support, buying shares in this unprofitable concept company today is simply trying to pick a bottom. I’d stick with more traditional aerospace and defense names with reliable earnings and dividends.
Be the first to comment