

Khosrork
This article was published on Dividend Kings on Wed, January 18th, 2023.
Is there such a thing as a safe “one stock” retirement portfolio? You bet there is.
A few months back, Brad Thomas and I did this article explaining why (SCHD), the gold standard of high-yield blue-chip ETFs, is a great choice for anyone seeking safe high-yield today, strong income growth, and a rich retirement in the decades to come.
But I’ve since learned of an even better “one stock to rule them all” buy and hold forever blue-chip. One that is slightly better than SCHD for younger investors seeking long-term maximum retirement income.
That would be the Vanguard Dividend Appreciation ETF (NYSEARCA:VIG), my new favorite “one stock retirement” pick.
Don’t get me wrong; I’m not saying you should sell SCHD. I own both myself, and SCHD is the largest equity position in the DK ZEUS Income Growth Portfolio.
Dividend Kings ZEUS Income Growth Portfolio: My Dream Portfolio (What I’m Putting All My Life Savings Into As Fast As Possible)
| Stock | Yield | Growth | Total Return | Weighting | Weighted Yield | Weighted Growth | Weighted Return |
| ETF Bucket | |||||||
| VIG (fast-growing aristocrats, future aristocrats) | 1.9% | 10.0% | 11.9% | 8.33% | 0.2% | 0.8% | 1.0% |
| SCHG (growth blue-chips) | 0.6% | 12.8% | 13.4% | 8.33% | 0.1% | 1.1% | 1.1% |
| SCHD (high-yield blue-chips) | 3.4% | 8.6% | 12.0% | 16.67% | 0.6% | 1.4% | 2.0% |
| Hedging Bucket | |||||||
| EDV (long bonds) | 4.1% | 0% | 4.1% | 16.67% | 0.7% | 0.0% | 0.7% |
| DBMF (managed futures) | 9.0% | 0% | 9.0% | 8.33% | 0.8% | 0.0% | 0.8% |
| KMLM (managed futures) | 9.4% | 0.0% | 9.4% | 8.33% | 0.8% | 0.0% | 0.8% |
| Hyper-Growth Blue-Chip Bucket | |||||||
| AMZN | 0.0% | 19.2% | 19.2% | 5.56% | 0.0% | 1.1% | 1.1% |
| LOW | 2.0% | 20.6% | 22.6% | 5.56% | 0.1% | 1.1% | 1.3% |
| MA | 0.6% | 23.2% | 23.8% | 5.56% | 0.0% | 1.3% | 1.3% |
| High-Yield/Value Blue-Chip Bucket | |||||||
| BTI | 7.4% | 10.4% | 17.8% | 2.78% | 0.2% | 0.3% | 0.5% |
| ENB | 6.3% | 4.9% | 11.2% | 2.78% | 0.2% | 0.1% | 0.3% |
| MO | 8.3% | 5.0% | 13.3% | 2.78% | 0.2% | 0.1% | 0.4% |
| HASI | 4.3% | 10.8% | 15.1% | 2.78% | 0.1% | 0.3% | 0.4% |
| BAM | 4.0% | 14.6% | 18.6% | 2.78% | 0.1% | 0.4% | 0.5% |
| NEP | 4.1% | 13.5% | 17.6% | 2.78% | 0.1% | 0.4% | 0.5% |
| Total | 4.5% | 10.3% | 14.2% | 100.00% | 4.1% | 8.5% | 12.6% |
(Sources: DK Research Terminal, FactSet, Morningstar)
This is what I’ll spend the next few years building with all of my savings.
Why is VIG my favorite single “one stock retirement” choice? Why not SCHD, which yields much more and has basically the same return potential.
Let me show you why VIG is what I’d own if I could own just one stock for the rest of my life.
VIG: The Best Aristocrat Portfolio On Wall Street
My motto is safety and quality first, prudent valuation, and sound risk management always.
And when it comes to safety and quality, both VIG and SCHD are hard to beat.
ETF Research Center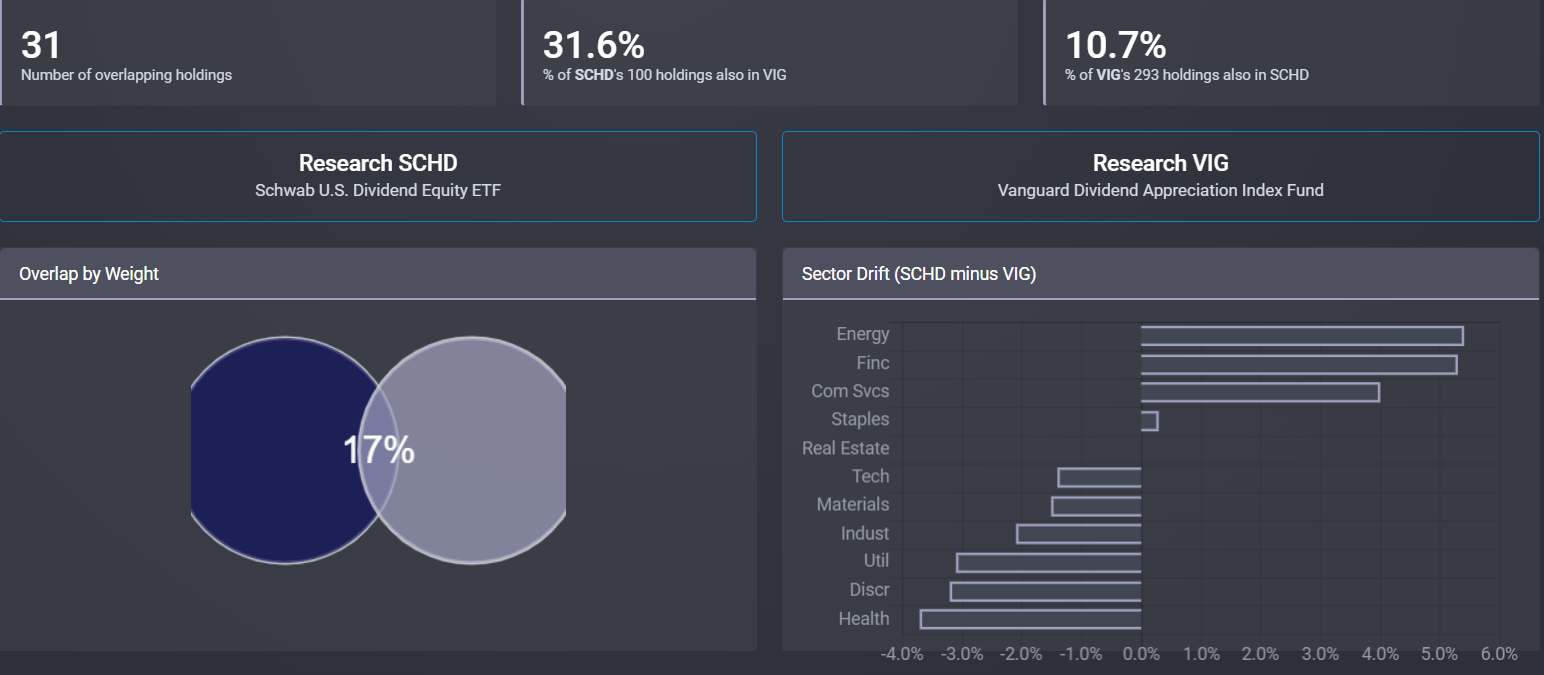
There is modest overlap between the two, but far below the 70% cutoff the IRS uses (per Morningstar) to determine whether an ETF is “substantially identical.”
What do these ETFs own?
SCHD is a 5-star silver-rated ETF, according to Morningstar, that owns some of the best high-yield blue-chips on earth.
VIG is a 5-star gold-rated ETF with the best fast-growing aristocrats and future aristocrats.
Top 50 Holdings Of SCHD And VIG
Fundvisualizer Fundvisualizer Fundvisualizer Fundvisualizer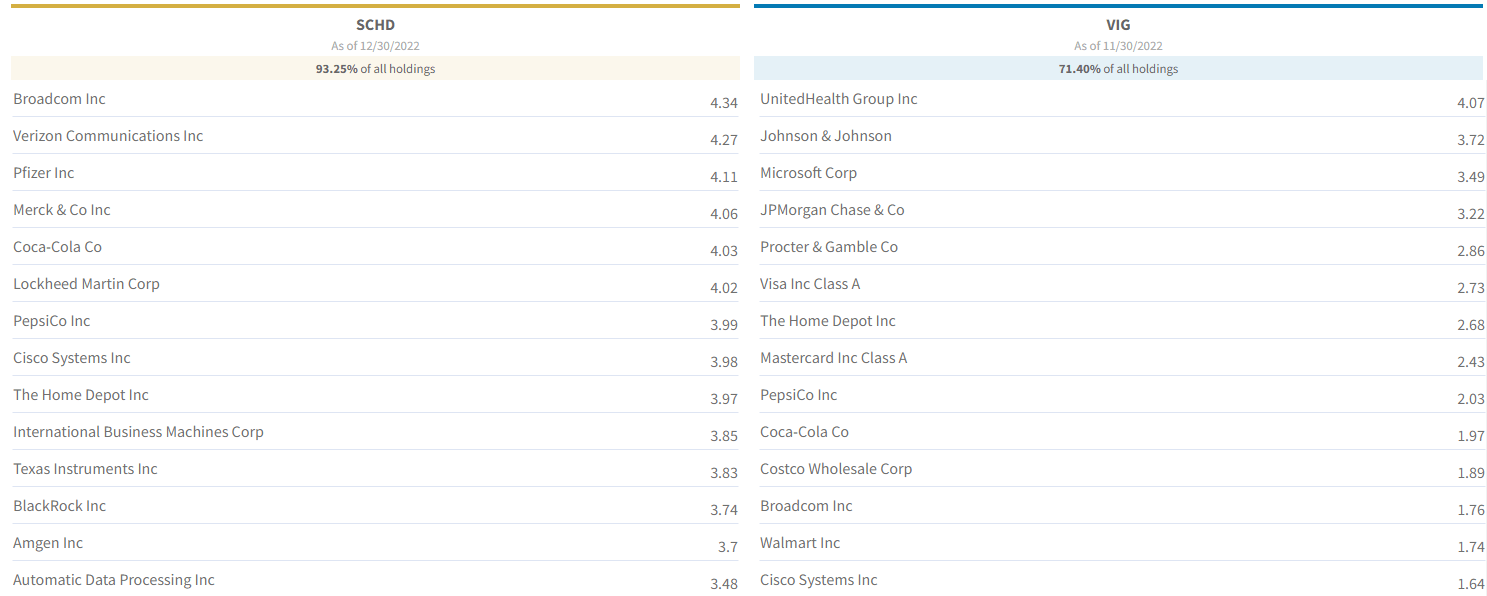
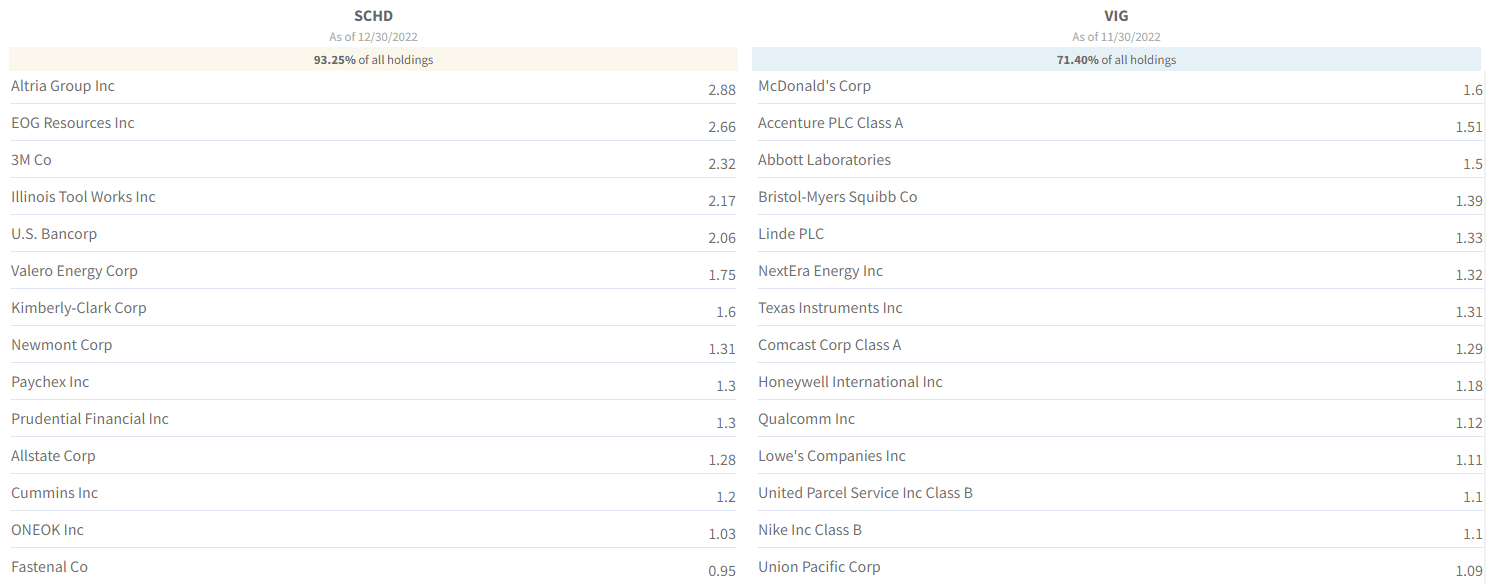
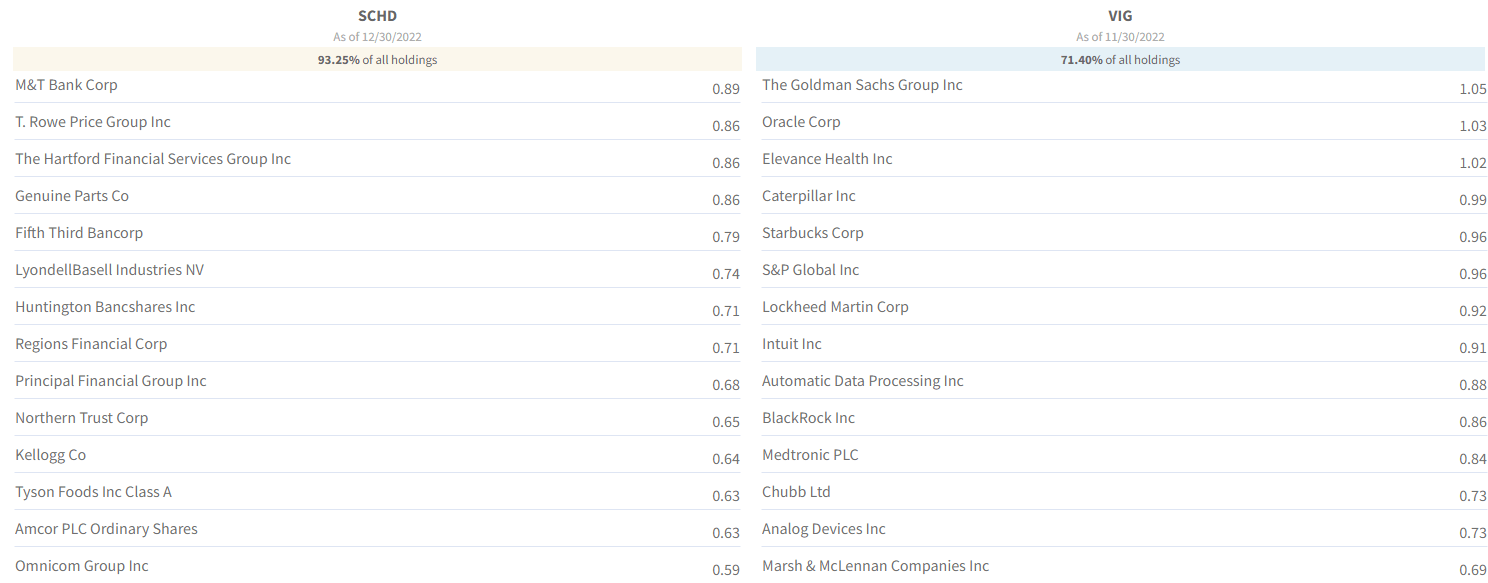
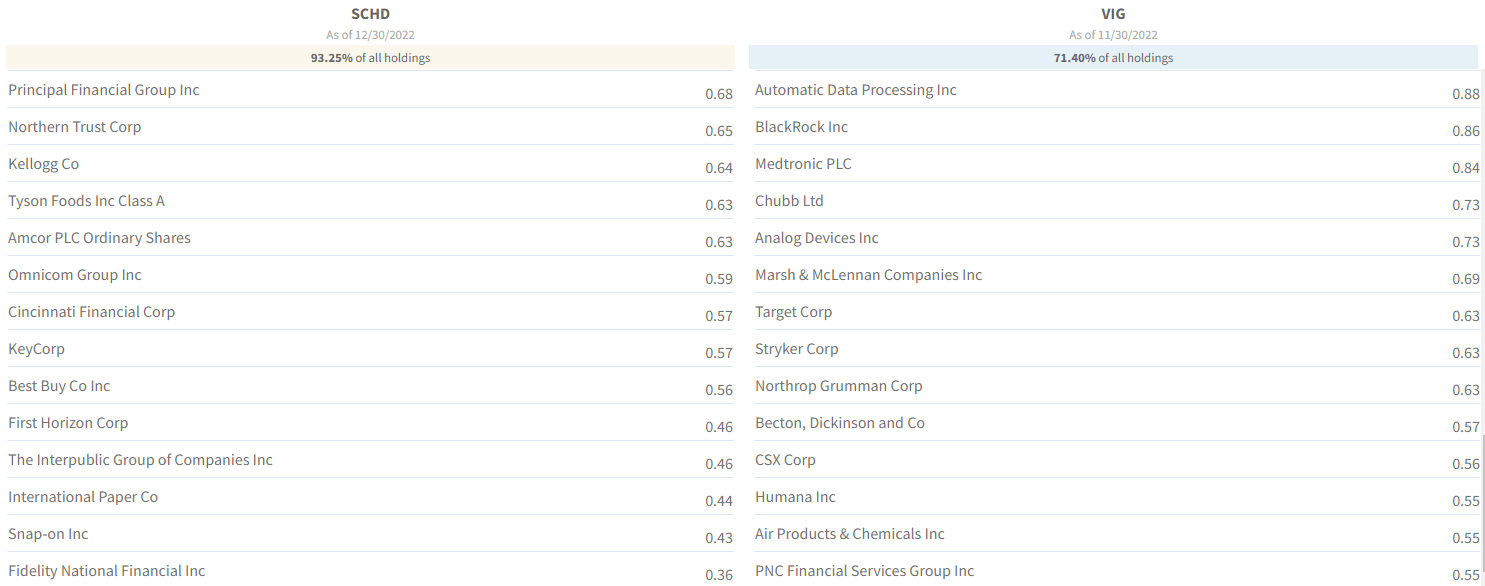
92% of SCHD’s assets are in its top 50 stocks. Outside of IBM (IBM), I can’t find fault with SCHD’s top names.
But by the time you get out of the top 25, there are plenty of good but not exceptional companies.
For example, International Paper (IP) is hardly a name I’d recommend for most investors.
But VIG? The closest thing I can find to a company I might not want to own in the top 50 holdings, which make up 71% of this ETF, is PNC Financial (PNC), which is one still one of the best regional banks in America.
In other words, SCHD is very high quality, but VIG is almost exclusive world-beater blue-chip quality, the best of the best.
SCHD And VIG Sectors
Fundvisualizer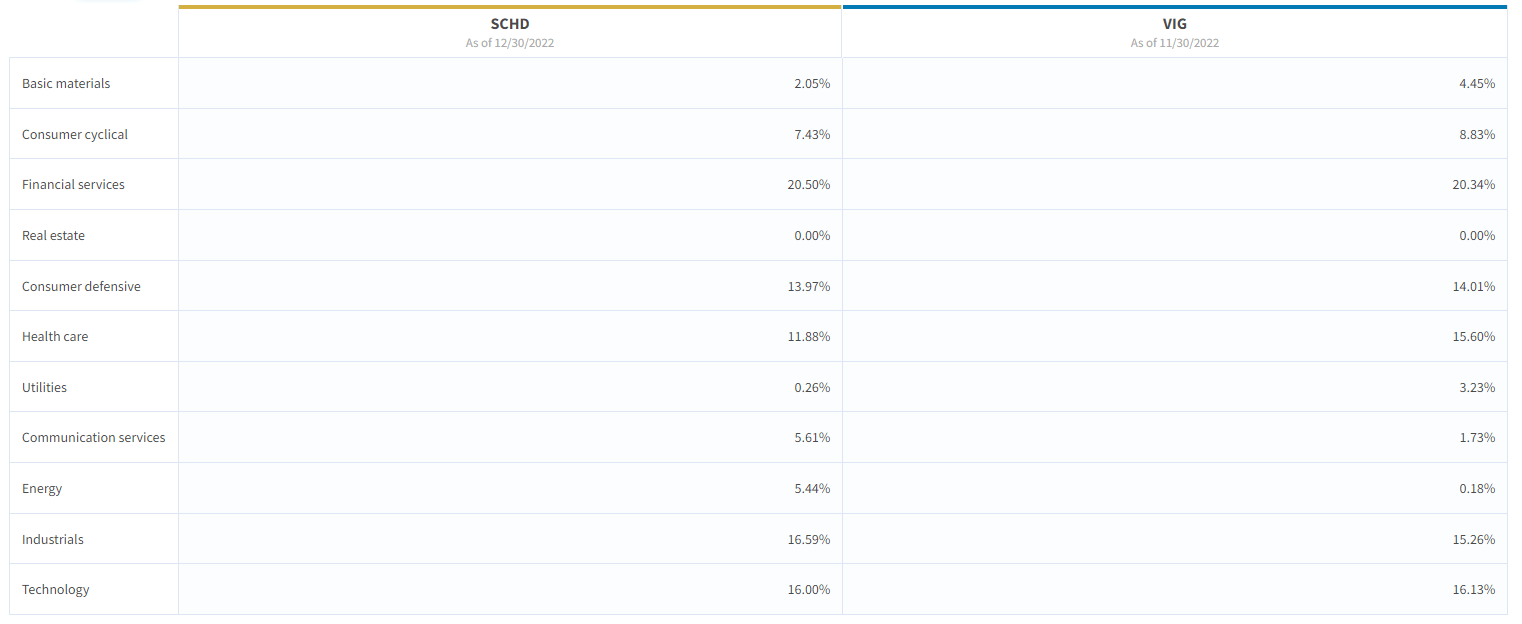
The only fault I can find with their sector allocations is a lack of REITs based on their portfolio screening rules.
How VIG Selects Its Stocks
The fund tracks the S&P U.S. Dividend Growers Index, which provides a market-cap-weighted portfolio of stocks with at least ten consecutive years of increasing their regular dividend payments. Securities must have more than $100 million in market cap and $1 million in three-month median daily trading value to be eligible for additions. Existing constituents face lower thresholds to reduce turnover. On top of the long lookback period, the index excludes stocks with unsustainable yields that are likely to have trouble growing their dividends. The index removes existing constituents ranking in the top 15% by indicating annual yield and new eligible securities in the top 25%. Selected constituents are weighted by their float-adjusted market cap, subject to a 4% cap on any individual holdings’ weight. – Morningstar
VIG starts with dividend contenders (10+ year streaks) and then applies S&P quality criteria on top of that. And then uses a 4% max risk cap to ensure solid risk management.
How SCHD Selects Its Stocks
The Dow Jones U.S. Dividend 100 Index, which this fund fully replicates, features 100 stocks that have paid dividends for at least ten consecutive years and boast the financial health to continue their streak….
The index mines the broad market for constituents but favors value stocks because it incorporates yield into stock selection….
This fund’s focus on fundamentals promotes durable yield, as stocks on firm financial footing are well-positioned to continue dividend policies. It also allows the fund to tap into the quality factor, historically tied to market-beating performance. The fund’s profitability measures, like return-on-invested capital, comfortably exceed the Russell 1000 Value Index, its category benchmark. Dividend-oriented companies with healthy balance sheets tend to be more insulated from the market’s movements, so this fund usually strikes a defensive stance.
This portfolio weights stocks by market cap, an efficient approach that channels the market’s collective view of each stock’s relative value. The fund takes a modified approach, limiting each stock’s weight to 4% of the portfolio and each sector’s weight to 25%. Concentration can bubble up in lean portfolios like this, but these measures help the fund stay diversified. – Morningstar
SCHD has the best overall quality screening method I’ve seen, and the only reason its top holdings are slightly lower quality than VIG’s are due to its focus on yield, giving it a value tilt.
SCHD risk management is superb, just like VIG. But VIG has something SCHD doesn’t have, which is a far more diversified portfolio.
VIG: Almost 300 Of The Best Aristocrats And Future Aristocrats
Morningstar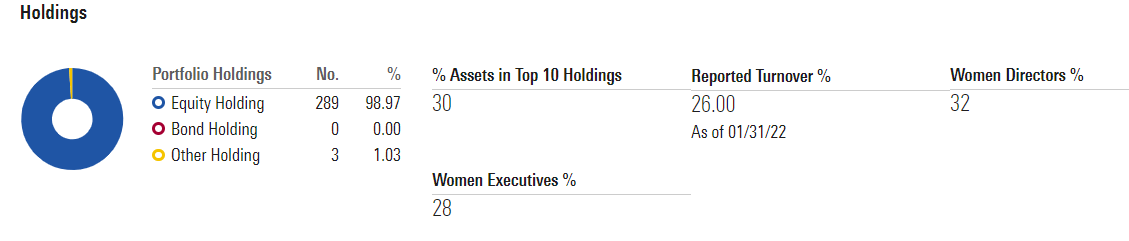
VIG has almost 3X as many companies as SCHD because it has not capped on how many companies it owns. There are hundreds of quality aristocrats and future aristocrats, and VIG will own them all.
- Apple (AAPL) is likely to be added in 2023 with a 4% weighting.
VIG’s 26% annual turnover is also very good, minimizing how much taxes you have to pay.
SCHD: 100 Exceptional High-Yield Blue-Chips
Morningstar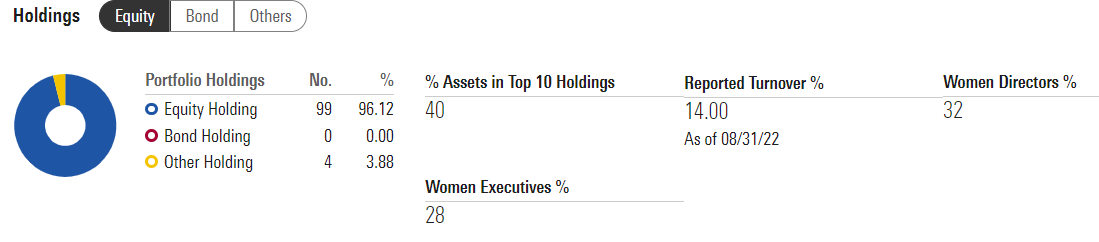
That’s not to say SCHD has a high turnover. In fact, it’s slightly lower than VIG’s.
VIG Quality: Exceptional
SCHD Quality: Very Good
Morningstar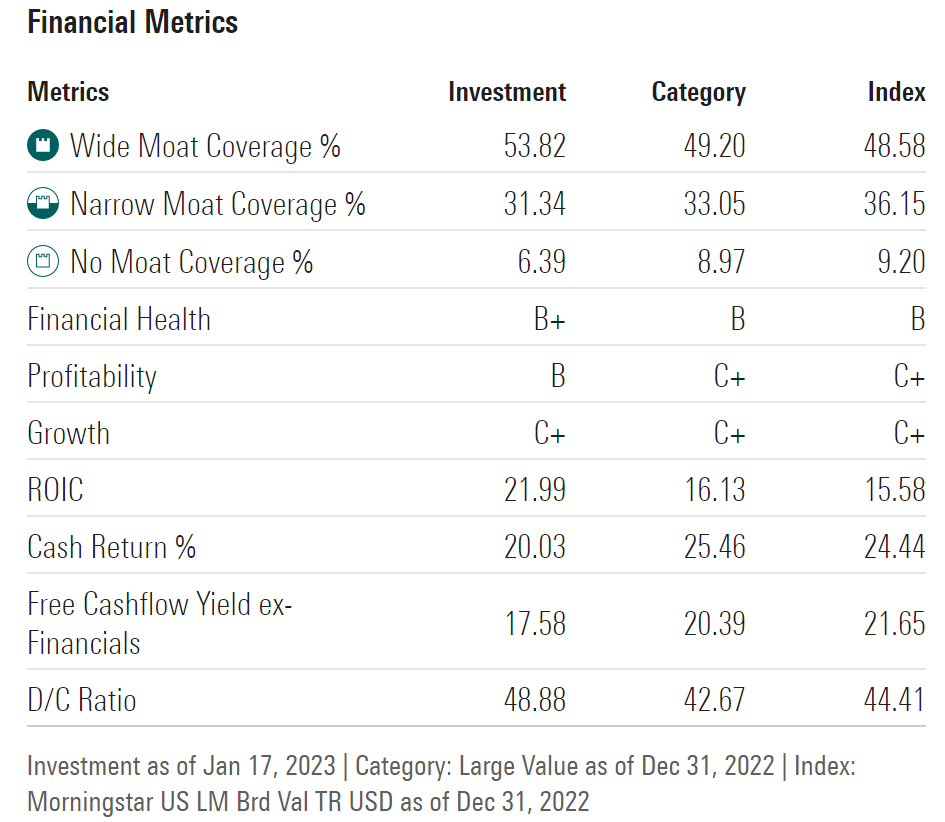
SCHD’s quality is very good, with solid 22% returns on invested capital, very strong balance sheets, and 18% free cash flow margins.
The 49% payout ratio is well below the 60% rating agencies consider safe for most dividend stocks.
VIG Quality: Exceptional
Morningstar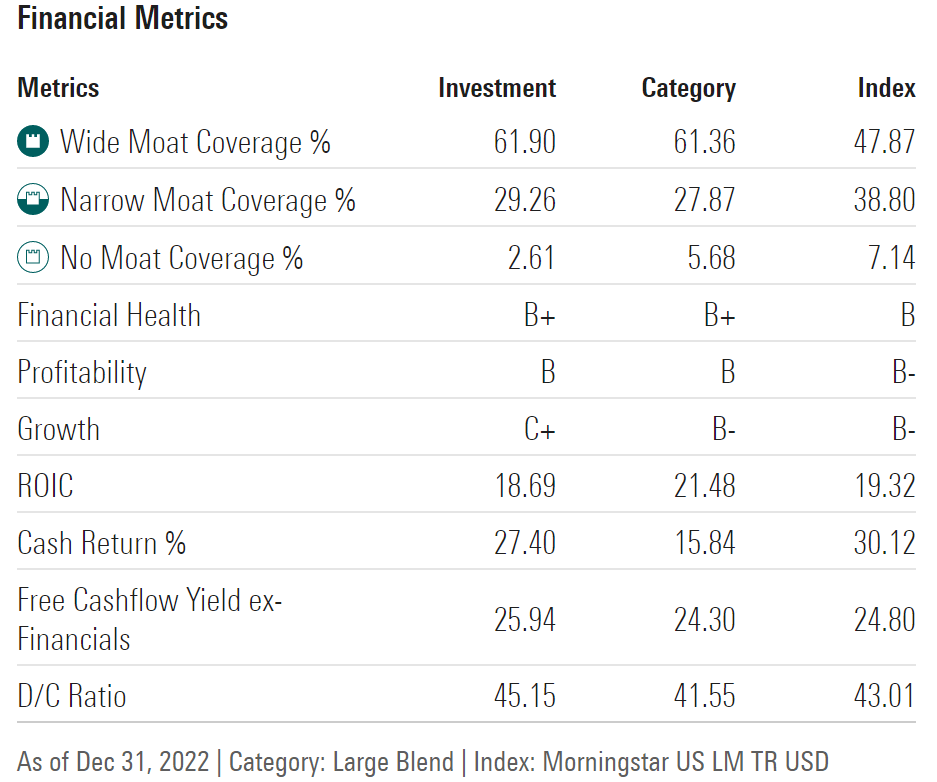
VIG’s quality is slightly superior to SCHD’s, with 97% of companies having a moat vs. 94% for SCHD.
The free cash flow margins of 26% are amazing. That’s slightly higher than Apple’s, and that’s the average for the entire portfolio!
The payout ratio of 45% is slightly safer than SCHD’s and naturally is what you’d get from a portfolio focused on the best aristocrats and future aristocrats.
- SCHD is also focused on future aristocrats but of slightly lower quality and higher yield
But here’s the biggest reason I love VIG, most of all, among my three world-beater gold-standard ETFs.
The Best Dividend Dependability Of Any ETF
You might think the dividend aristocrat ETF (NOBL) would have the most stable dividends of any ETF on earth. After all, with literally every holding having a 25+ year dividend growth streak, how could it not?
But if you think that NOBL has a non-variable income, you’d be wrong.
Portfolio Visualizer Premium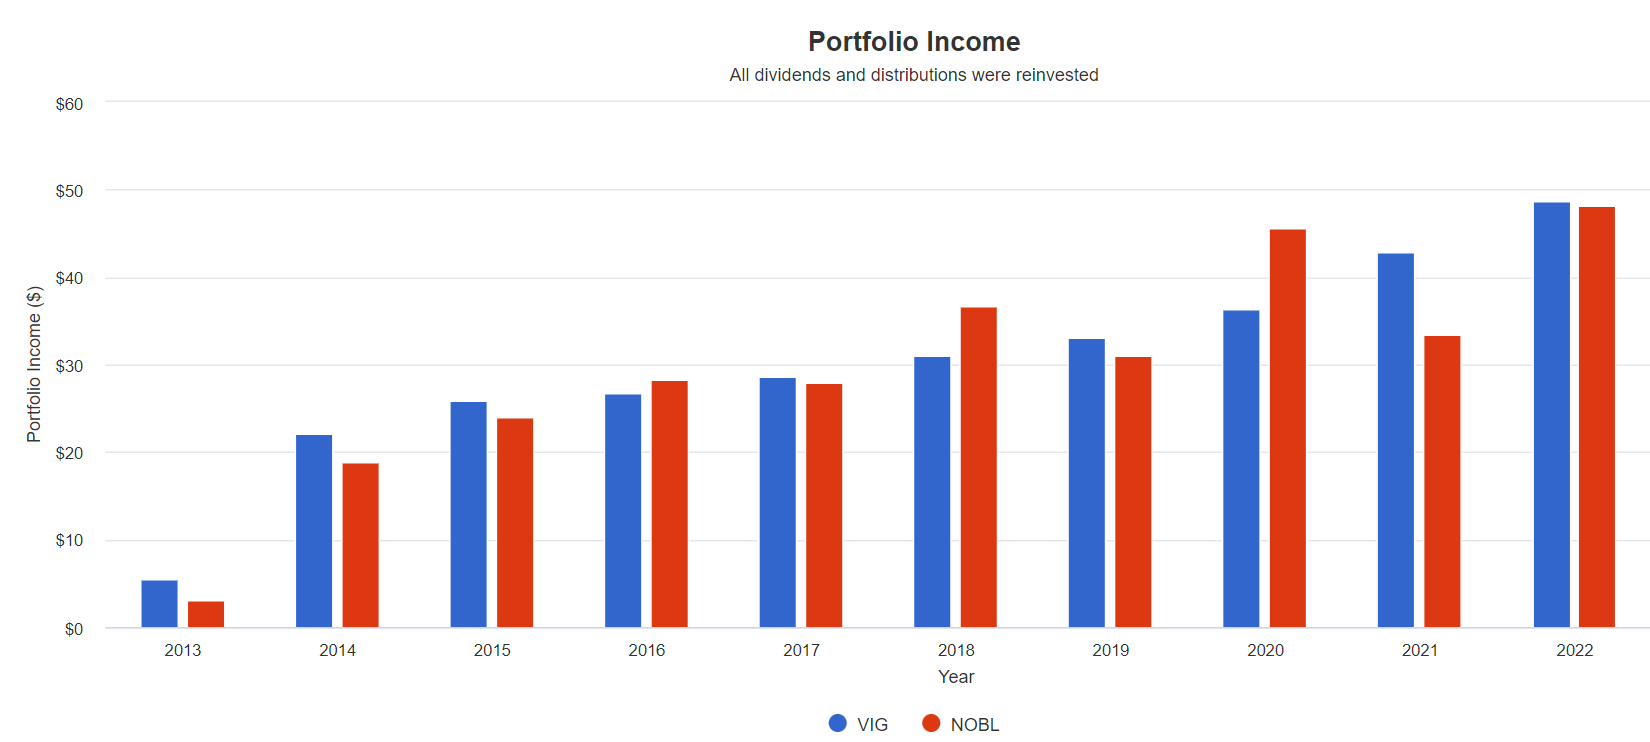
Because NOBL is equally weighted and rebalances twice per year, it will occasionally deliver lower income in any given year.
Not so with VIG, which benefits from market cap weighting up to 4% of the portfolio.
But do you know what’s truly astonishing? Not just that VIG has beaten NOBL for annual dividend growth dependability since Proshares created it in 2013.
VIG is the only ETF I’ve ever found that has never had an annual dividend cut.
Portfolio Visualizer Premium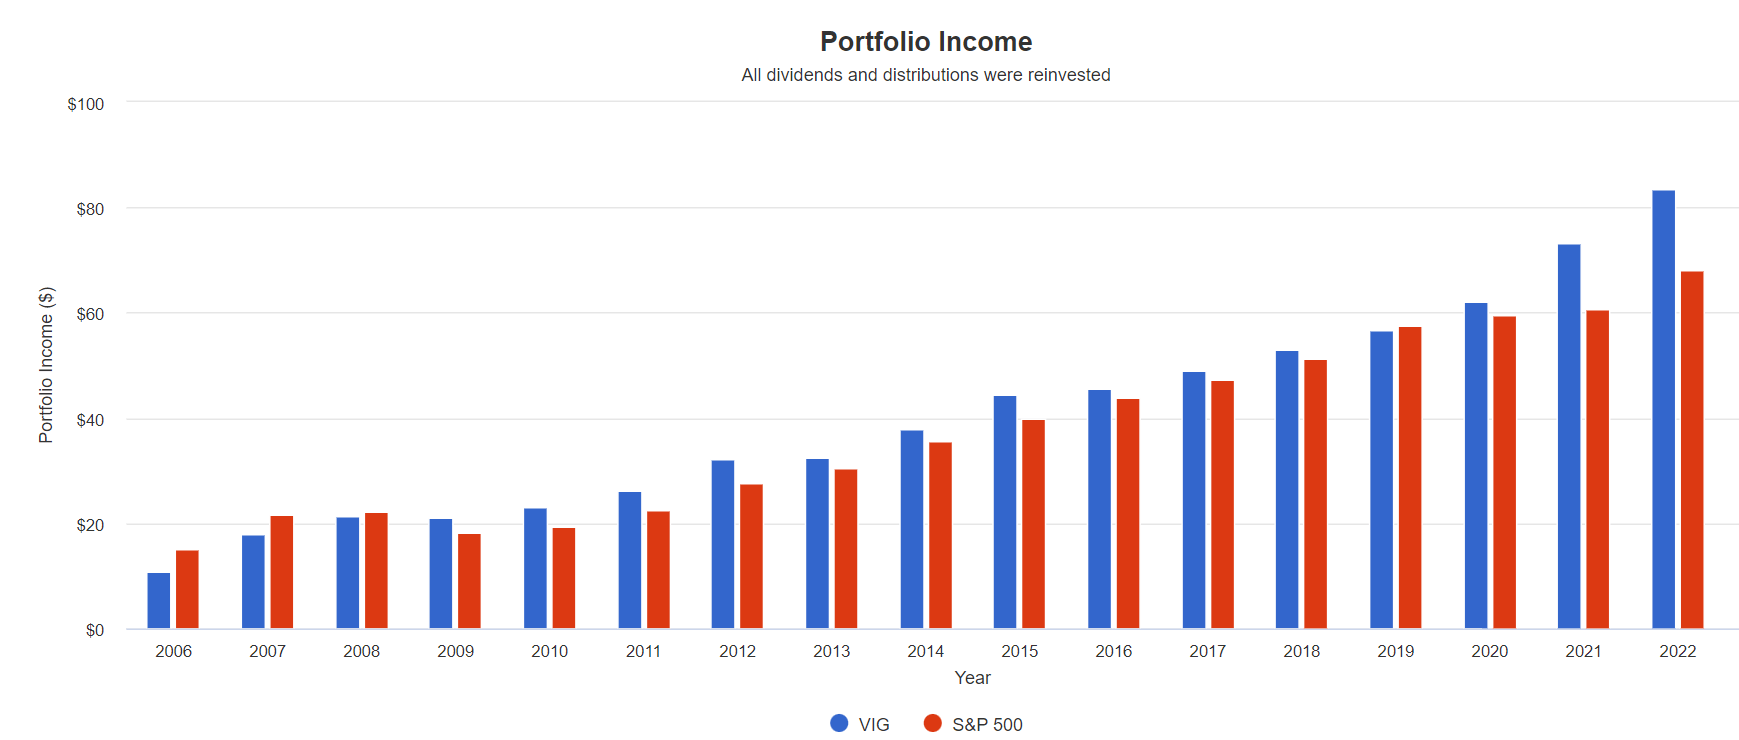
VIG’s dividends were flat during the Great Recession, while the S&P 500’s fell 25%.
VIG has been around since 2006 and has rising dividends in 15 out of those 16 years, and never a down year as far as income goes.
- 10.7% annual income growth vs. 7.8% S&P 500
In the future, analysts expect about 11% to 13% income growth from VIG, just as it’s delivered over the last 15 years.
What does that mean for long-term income growth investors?
Inflation-Adjusted Income Growth Consensus Forecast: Per $1,000 Initial Investment
| Time Frame (Years) | 9.7% CAGR Inflation-Adjusted VIG Income Growth Consensus | Inflation-Adjusted Yield On Cost |
| 5 | $27.84 | 2.8% |
| 10 | $40.79 | 4.1% |
| 15 | $59.77 | 6.0% |
| 20 | $87.58 | 8.8% |
| 25 | $128.33 | 12.8% |
| 30 (retirement time frame) | $188.03 | 18.8% |
| 35 | $275.51 | 27.6% |
| 40 | $403.69 | 40.4% |
| 45 | $591.51 | 59.2% |
| 50 | $866.71 | 86.7% |
| 55 | $1,269.95 | 127.0% |
| 60 (investing lifetime) | $1,860.79 | 186.1% |
| 100 (Charity Trust time frame) | $39,536.20 | 3953.6% |
(Source: Morningstar)
If you’re over the age of 70, then VIG’s superior income growth potential probably isn’t worth much.
- Social Security Administration estimates 10% of retired couples will live to 100+
But if you’re under 70, then the power of the world’s best and future aristocrats is clear.
And, if, like me, you want to leave a charitable trust to donate to your favorite causes, then the power of double-digit real income growth is potentially world-changing.
Bottom Line: VIG Is The Ultimate “One Stock Retirement Plan”
You might think that the ultimate “one stock retirement plan” must be as diversified as possible. But you’d be wrong.
Historical Returns Since 2008
Portfolio Visualizer Premium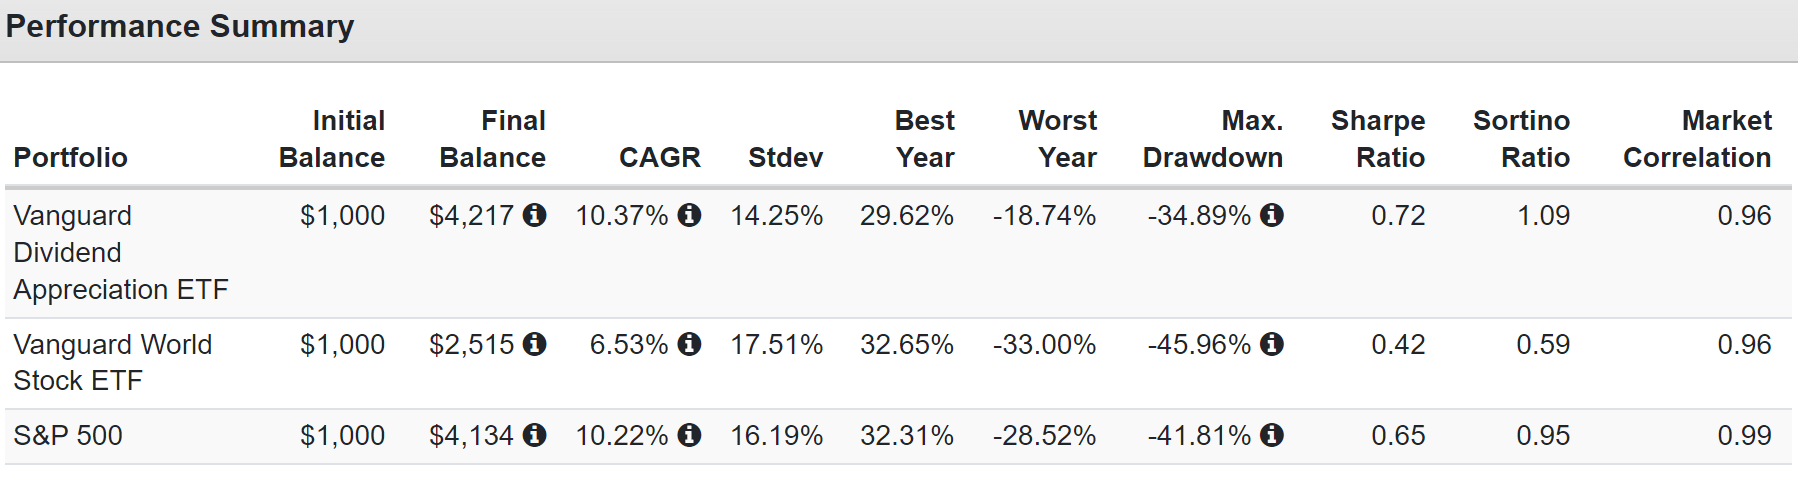
VT is the Vanguard World ETF and owns 9,378 companies. But most of those are low-quality names that just “de-worsify” your savings.
VIG strikes a glorious balance between diversification and quality. And it has far lower volatility over time, especially in extreme market crashes.
- the benefits of supreme quality and income dependability
It owns literally every US high-quality aristocrat and future aristocrat. In the future, it might own 350 or even 400 companies.
But rest assured that if VIG owns it, it’s worth owning.
Legacy Research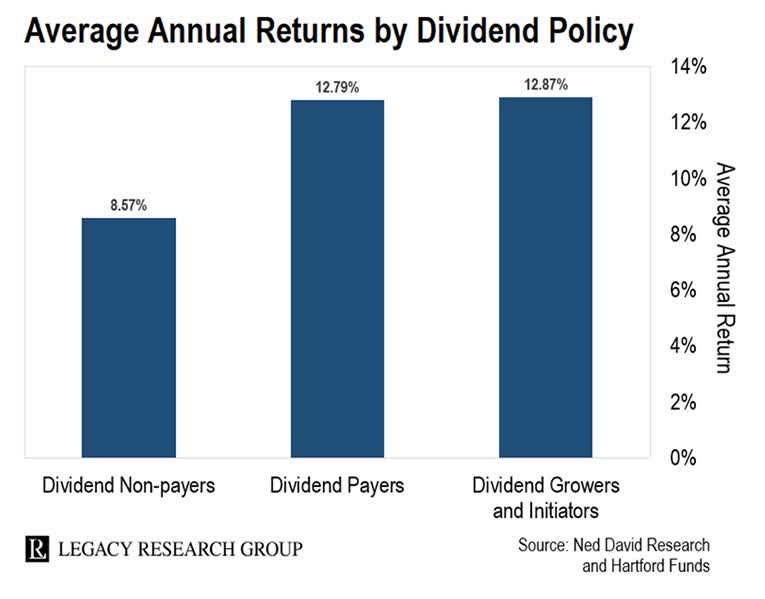
Are analyst forecasts for 12% long-term returns from VIG realistic? That’s what dividend growth blue-chips have delivered for the last 50 years. They also delivered 7X the inflation-adjusted returns of non-dividend stocks.
Now that’s not to say that SCHD isn’t a world-beater blue-chip ETF because it most assuredly is.
- SCHD has a 10-year dividend growth streak and no down years
- it might have matched VIG’s incredible dividend dependability in the Great Recession, but we’ll never know for sure
If you want the best high-yield single-stock retirement plan? SCHD is it.
They don’t get any better than VIG if you want the highest quality single stock aristocrat and future aristocrat portfolio.
Do I recommend anyone buy just one stock for their life savings? Not unless you want something you can buy and hold forever, without every rebalancing or even looking at your portfolio.
- Not a terrible idea if you hate bear markets like in 2022
But really, why not own both SCHD and VIG? In fact, I’d recommend SCHG as well. Why? Because analysts think that the 50% fastest growing companies in the S&P 500 will deliver 13% long-term returns, about 1% more than VIG and SCHD.
How realistic is that? US large-cap growth has delivered 13.5% annual returns for the last four decades.
LazyPortfolioETF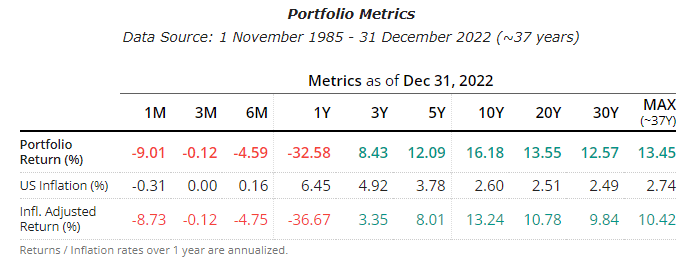
The point is that you don’t have to own just a single stock. Because if you combine the world’s best blue-chips you can accomplish something truly extraordinary.
LazyPortfolioETF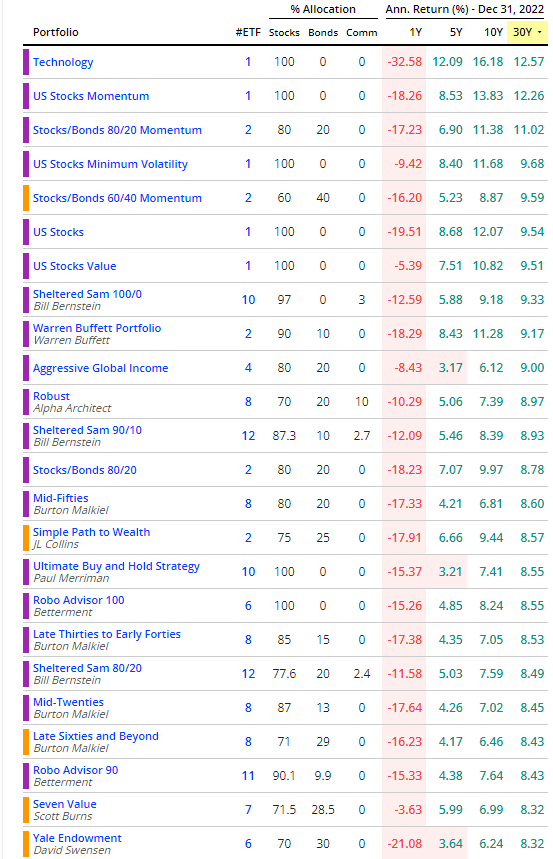
The best-performing investment strategy in the last 30 years was tech stocks, like what SCHG owns.
ZEUS Income Growth: The Power Of 15 Of The World’s Best Blue-Chip Assets
| Metric | S&P | ZEUS Income Growth | X Better Than S&P 500 |
| Yield | 1.7% | 4.1% | 2.41 |
| Growth Consensus | 8.5% | 8.5% | 1.00 |
| LT Consensus Total Return Potential | 10.2% | 12.6% | 1.24 |
| Risk-Adjusted Expected Return | 7.1% | 8.8% | 1.24 |
| Safe Withdrawal Rate (Risk And Inflation-Adjusted Expected Returns) | 4.9% | 6.6% | 1.34 |
| Conservative Time To Double (Years) | 14.8 | 11.0 | 1.34 |
(Source: DK Research Terminal, FactSet)
Guess what else has historically generated 12% to 13% returns and is expected to deliver about 12% to 14% returns in the future? The ZEUS Income Growth Portfolio.
ZEUS Income Growth Vs. 60/40, S&P, And Nasdaq During Bear Markets Since December 2007
| Bear Market | ZEUS Income Growth | 60/40 | S&P | Nasdaq |
| 2022 Stagflation | -14% | -21% | -28% | -35% |
| Pandemic Crash | -9% | -13% | -34% | -13% |
| 2018 | -10% | -9% | -21% | -17% |
| 2011 | 4% | -16% | -22% | -11% |
| Great Recession | -20% | -44% | -58% | -59% |
| Average | -10% | -21% | -33% | -27% |
| Average Decline vs. Benchmark | NA | 48% | 30% | 36% |
| Median Decline | -10% | -16% | -28% | -17% |
| Median Decline Vs. Benchmark | NA | 63% | 36% | 59% |
(Source: Portfolio Visualizer Premium, Charlie Bilello, Ycharts)
4.1% yield today, 12% to 14% returns tomorrow, and volatility so low it’s like riding over the worst market potholes in a Rolls Royce.
That’s why I plan to own VIG, SCHD, and SCHG, along with 12 other blue-chips.
That’s 578 of the world’s best companies, which count every human being on earth as a customer.
The risk of losing money long-term is effectively zero unless the world ends, in which case we won’t care.
But guess how long it takes to rebalance this portfolio every year? Five minutes using the DK rebalancing tool.
How much does it cost? 0.25% expense ratio, less than NOBL’s 0.35%.
So, that’s the power of the world’s best dividend blue-chips.
- higher and safer yield
- historical returns that match the Nasdaq
- future consensus returns that surpass the Nasdaq
- 10% average bear market peak declines (70% less than the S&P)
- 20X lower cost than hedge funds and 33% cheaper than the dividend aristocrat ETF
- 99.97% probability of success over the next 50 years
This is what I’ve spent seven years studying as an analyst. Not just how to pick a single stock but how to build the ultimate sleep-well-at-night high-yield portfolio that can truly do it all.
Yield, value, growth, quality, and ultra-low volatility, ZEUS Income Growth does it all and better than almost anything else on Wall Street.
And all in a 15-stock portfolio that’s the epitome of da Vinci’s famous quote:
Simplicity is the ultimate sophistication. – Leonardo da Vinci
Be the first to comment