

RomoloTavani
Investment Thesis
As an ETF analyst, one of my biggest challenges is balancing the value of a fund’s performance history with the fundamentals of its current portfolio. They don’t always align, and in terms of how many investors that impacts, one of the best examples is with the Vanguard Dividend Appreciation ETF (NYSEARCA:VIG). Notwithstanding its excellent track record, which I confirmed to be among the most consistent over the last ten years, I began having reservations late last year when I downgraded VIG to a hold.
Today’s article provides an update on VIG’s fundamentals alongside three other dividend ETFs you may already own: DGRO, DGRW, and SCHD. On the plus side, analysts are more bullish on VIG than these three peers, which may clear a path to short-term outperformance. However, given its low 2.03% dividend yield and its second-priciest valuation among dividend ETFs, a “hold” rating is the best I can do today. I look forward to explaining why in more detail below.
ETF Overview
VIG tracks the S&P U.S. Dividend Growers Index, changing from the NASDAQ U.S. Dividend Achievers Select Index one year ago, as described here by Retired Investor. As many of you know, VIG is often covered here on Seeking Alpha, and there have been several discussions about whether the Index represents an improvement over the previous proprietary Index. My feeling is that the changes weren’t significant. The Index still requires 10+ years of consecutive dividend growth, excludes REITs, and has the same liquidity requirements, as detailed below.
Morningstar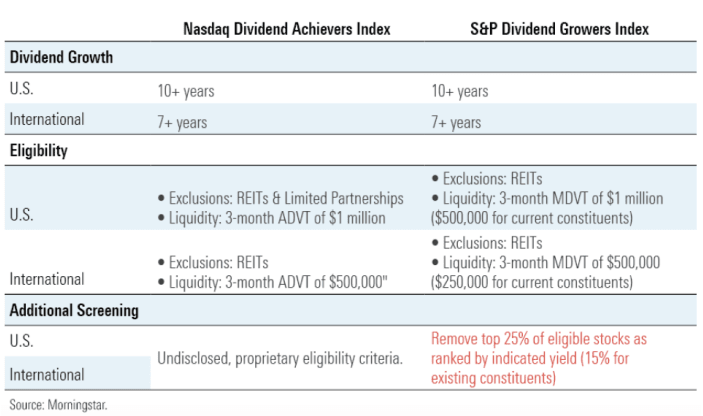
However, the new Index specifically states it removes the top 25% yielding stocks (15% for current constituents). I’m confident this some version of this criterion was also likely applied under the old method. In addition, high-yielding companies that no longer qualify usually have comparatively lower market capitalizations, and VIG remains a float-adjusted market-cap-weighted Index. In his August 2021 article, Retired Investor noted how there were only 20 new additions at the time. Still, the top ten list remained intact (albeit with different weightings, which is typical for any Index).
The Index reconstitutes annually beginning on the third Friday of March and applies a single constituent weighting cap of 4%. Constituents are reviewed monthly for ongoing eligibility, and the Index rebalances quarterly in March, June, September, and December.
Performance Analysis
I mentioned how VIG has an excellent track record. Since its launch in May 2006, VIG has gained an annualized 8.88% vs. 9.00% for the SPDR S&P 500 ETF Trust (SPY) and experienced less volatility, which led to better risk-adjusted returns (Sharpe and Sortino Ratios).
Portfolio Visualizer
I used the log scale above to highlight VIG’s downside protection during the Great Financial Crisis. By falling about 9-10% less from October 2007 to February 2009, SPY shareholders couldn’t catch up until about 2015. This follows the pattern of how less-volatile ETFs usually behave. I think it’s likely that if we hadn’t had an extended 10+ year bull market in the 2010s, VIG would probably have come out ahead over the entire period.
More recently, VIG has lagged DGRO, DGRW, and SCHD since DGRO’s launch in June 2014. However, it’s still been one of the least-volatile dividend ETFs, as evidenced by its lower standard deviation (13.32%) and lowest maximum drawdown (17.16%) figures.
Portfolio Visualizer
In a previous article, I calculated rolling six-month returns over the last ten years for all U.S. equity ETFs with sufficient history. I’ve identified 28 large-cap dividend- and value-focused ETFs and presented rankings for their “worst,” “average,” “median,” and “best” six-month return periods in the table below. Using “average” and “median” rankings, I also calculated a consistency ranking because sometimes, an ETF’s ten-year performance chart is skewed by one or two good or bad stretches. Finally, I calculated an “overall” ranking, which is merely an average of the five metrics and something I use for guidance purposes. Below are the results.
The Sunday Investor
VIG is the second-largest by assets under management and has an attractive 0.06% expense ratio, but it’s also the fourth-best performer over the last ten years behind PEY, SDY, and SCHD. VIG’s low standard deviation is reflected in the “best” and “worst” rankings of 26 and 2, respectively. This means that VIG’s best six-month period (25.63% from April – September 2020) was only 26th best among all ETFs, but its 15.69% decline from January – June 2022 was the second-best.
Unfortunately, that 15.69% decline to start the year was the worst out of all ETFs over that same period. DGRO, DGRW, and SCHD all did a fair bit better, especially SCHD, which outperformed by nearly 6%.
Portfolio Visualizer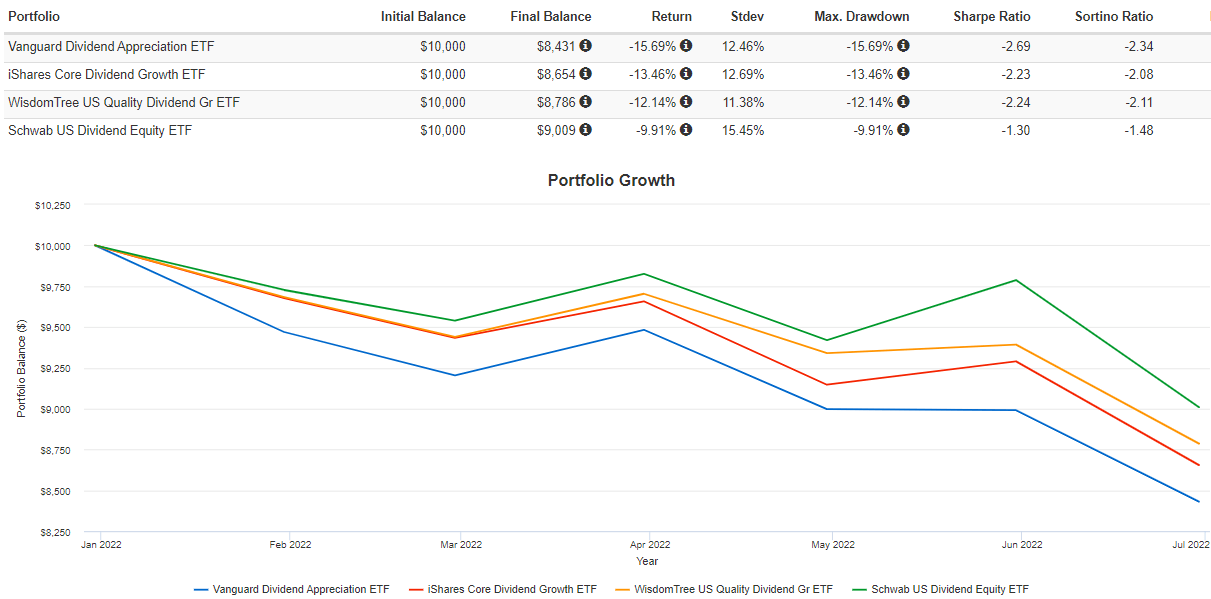
These results coincide with my bearish take on VIG and demonstrate why it’s important to judge an ETF based on the fundamentals of its current holdings. Relying on past performance is helpful, but when an ETF’s track record and fundamentals don’t align, there’s a problem.
ETF Analysis
Sector Exposures
The following table is from Morningstar and compares VIG’s GICS sector exposures with SPY, DGRO, DGRW, and SCHD. All three ETFs have relatively high exposure to Technology stocks, at least relative to other dividend ETFs, but they diverge mainly on Consumer Staples and Financials. Notably, all four have negligible exposures to Energy, Materials, Real Estate, and Utilities. It’s one key reason they’ve underperformed more focused high-dividend ETFs like HDV lately. Even SCHD is behind almost 10% YTD, and I think getting a healthy exposure to these sectors is in most investors’ best interests.
Morningstar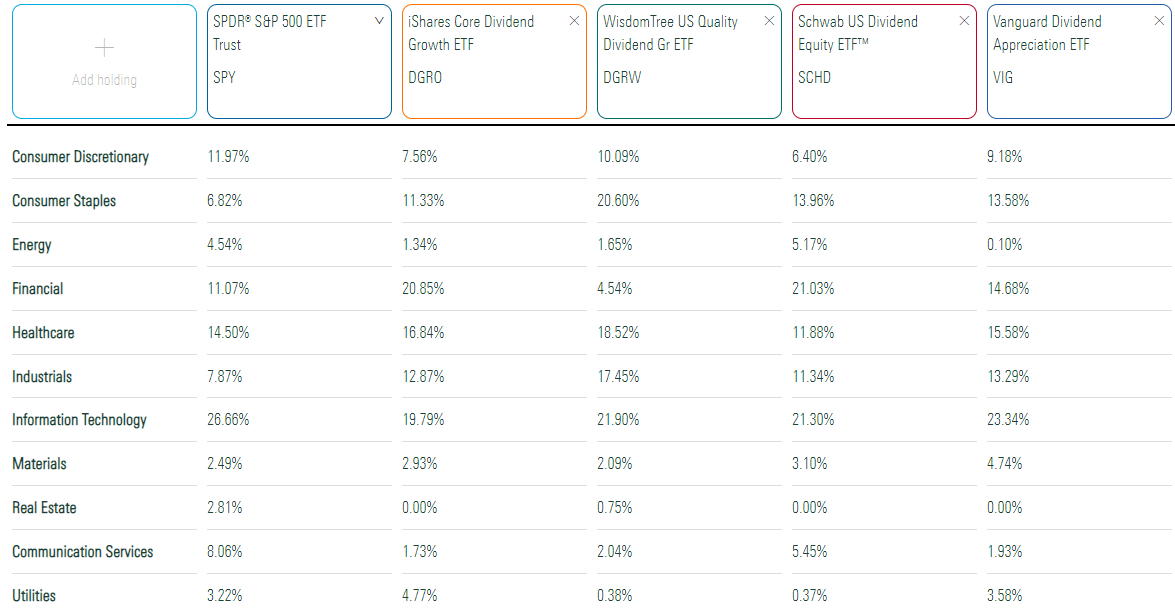
Industry Exposures
To dig deeper, we can identify VIG’s top 25 industries and the top three holdings within each industry. These 25 industries total 75.20% of the ETF, making VIG one of the most diversified dividend ETFs on the market. Data Processing & Outsourced Services stocks like Visa (V) and Mastercard (MA) are prominent, but so are Health Care stocks like UnitedHealth Group (UNH) and Abbott Laboratories (ABT). VIG also has some solid exposure to Semiconductor stocks through Broadcom (AVGO) and Texas Instruments (TXN) and holds the two dominant Soft Drink companies: Coca-Cola (KO) and PepsiCo (PEP).
The Sunday Investor
Top Ten Holdings
Vanguard recently redesigned its site, which is less investor-friendly, in my view. Holdings are updated only every month and often lag about 1.5 months behind. Nevertheless, for a diversified ETF like VIG, month-to-month changes aren’t usually significant. Here are the top 10, which total 28.07%.
Vanguard
We see at the bottom of the image that there are 289 holdings. Furthermore, the top 25 total 50.76%, and the top 50 total 71.25%. For anyone interested in scanning through the holdings list, you can probably stop at page five and still get a good idea about VIG’s holdings, or use my industry exposures table above for quick reference.
Fundamentals By Company
The following table highlights selected fundamental metrics for VIG’s top 25 holdings. The bolded bottom rows are summary metrics for the entire fund alongside DGRO, DGRW, and SCHD.
The Sunday Investor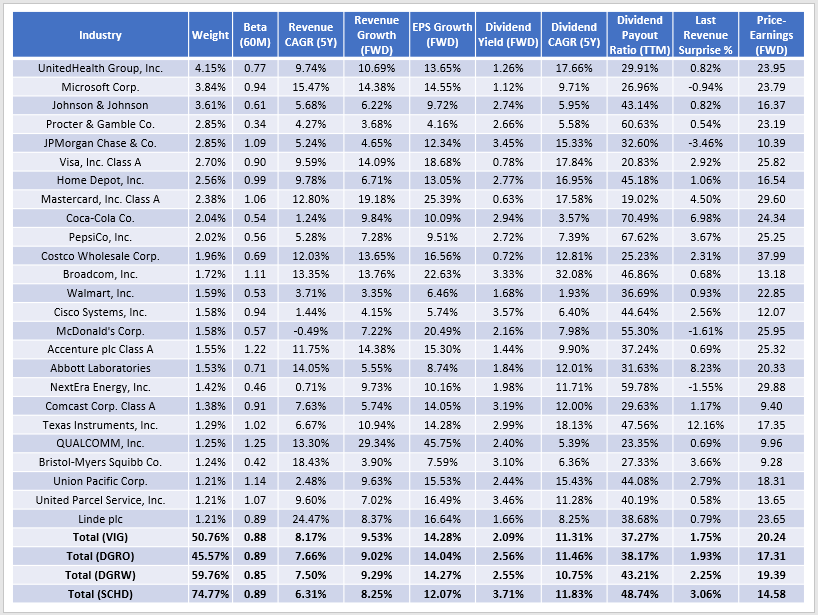
Notice how VIG has almost 25% less allocation to its top 25 holdings than SCHD. DGRO is even better at nearly 30% less. These features are important if it’s your primary dividend ETF holding. The benefits diminish as you add more ETFs to your portfolio because, ideally, you’re doing so in a way that minimizes fund overlap. Besides, diversification isn’t just about concentration in its top holdings. Consider how VIG’s concentration in its top 25 industries is 75.20% compared to 75.65%, 81.42%, and 91.04%. Therefore, while it has a diversification advantage, it’s perhaps not as big as you think.
Second, all four ETFs have around the same five-year beta: 0.88, 0.89, 0.85, and 0.89. Given these figures, plus their similarities in sector exposures, we can reasonably assume they will all have around the same level of downside protection. It could come down to how Financials perform going forward. VIG plays it kind of in the middle at 14.68%, but if the Fed achieves its goal of a soft landing and the economy remains strong, chances are it will underperform DGRO and SCHD but outperform DGRW, which has only 4.54% exposure.
VIG, DGRO, and DGRW have similar historical and estimated sales growth, as well as estimated earnings per share growth. Out of the 64 dividend-focused ETFs I track, this places them around the 25th percentile, which is excellent. Investors looking for more 20%+ growth can look to the tech-focused First Trust Rising Dividend Achievers ETF (RDVY) or lean harder into more value-themed ETFs like the iShares Select Dividend ETF (DVY) and its sub-10% EPS growth rate. SCHD’s is 12.07%, which is about average, but you’re getting a substantial discount in exchange. SCHD currently trades at just 14.58x forward earnings compared to 20.24x, 17.31x, and 19.39x for VIG, DGRO, and DGRW. For just 2% less earnings growth, I think it’s a pretty good tradeoff.
Readers often point to VIG’s outstanding dividend growth record as a reason to invest. Seeking Alpha gives VIG an overall “A” Dividend Grade because of its long track record and 8.08% dividend growth rate over the last five years.
Seeking Alpha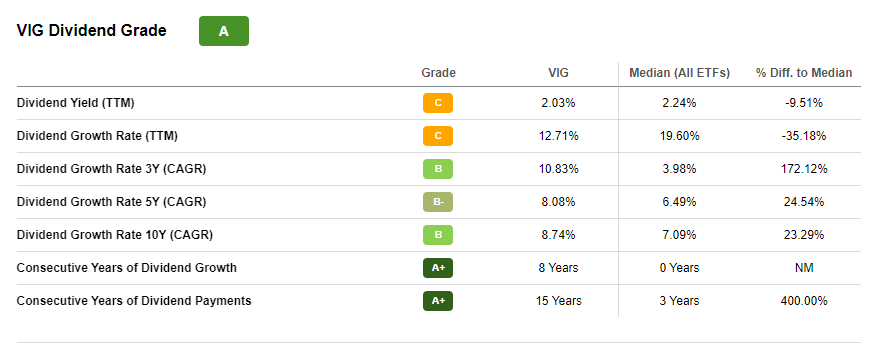
VIG isn’t known for its high yield, but the basic premise is that if you keep reinvesting dividends over five or ten years, your dividend paycheck will soon be substantial. That’s true, but I also want readers to know that it’s likely true with other ETFs like DGRO, DGRW, and SCHD. According to the earlier table, all four ETFs have five-year dividend growth rates of 11-12% based on current holdings. DGRW’s gross yield of 2.55% is 0.46% higher than VIG’s, and investors should still come out ahead after adjusting for DGRW’s higher fees. DGRO looks better because you don’t have to worry much about its 0.08% expense ratio. And SCHD looks the best because its current gross yield is 3.71%, has the highest five-year dividend growth rate, and has a cheap 0.06% expense ratio.
Price Momentum and Quarterly Surprises
This next section looks at how each ETF’s current holdings have performed over the short- and medium-term. This view helps us take out each ETF’s reconstitutions and allows us to focus on each fund’s holdings “as is.”
The Sunday Investor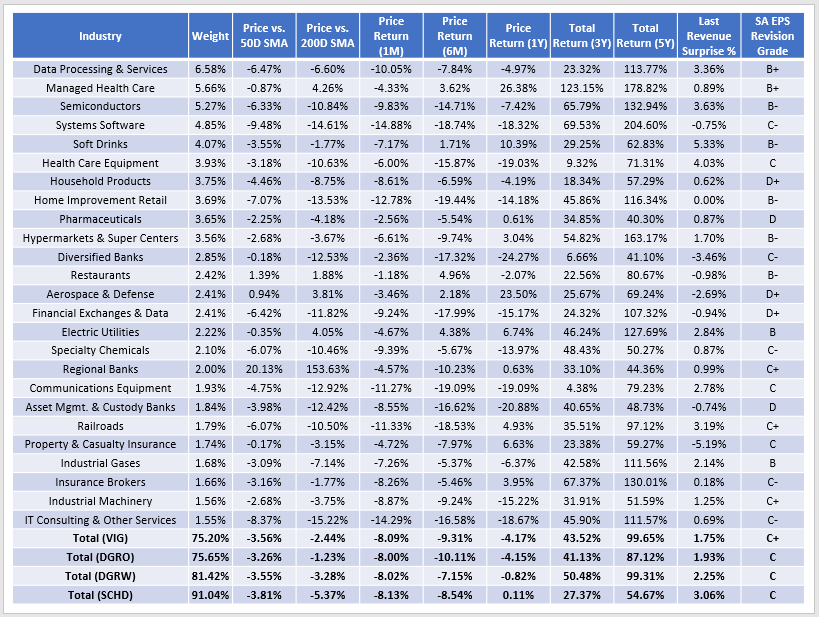
VIG and DGRW’s constituents have provided nearly double the total return over the last five years. DGRO is close at 87.12%, while SCHD’s is the outlier at 54.67%. This is due to Semiconductors and Systems Software stocks, which SCHD lacks. We’ve seen these industries pull back sharply this year, trading 10.84% and 14.61% below their 200-day moving average prices. Continuing this trend would harm VIG, but these stocks are also prominent in ETFs like SPY. Historically, they’ve helped VIG achieve a strong total return, but they don’t do much in terms of improving the portfolio’s dividend yield.
This table includes each industry’s most recent quarterly revenue surprise and Seeking Alpha’s EPS Revision Grades. VIG’s constituents had a positive 1.75% surprise last quarter, which was relatively low, especially compared with SCHD. Microsoft (MSFT) disappointed with a -0.94% sales surprise. JPMorgan Chase (JPM) also disappointed analysts by 3.46%, and S&P 500 surprises remained below 3% for the fourth consecutive quarter. There’s a lack of enthusiasm on Wall Street, and I think this is why low P/E stocks and ETFs are doing well.
However, one anomaly is VIG’s superior EPS Revision Grade compared to DGRO, DGRW, and SCHD (C+ vs. C). It’s a sliver of hope for those counting on a turnaround and suggests analysts are slightly more bullish on the high P/E companies VIG favors. For example, Visa and Mastercard have A- and B Grades and trade at 25.82x and 29.60x forward earnings. These stocks account for 5.08% of VIG but 1.17% for DGRO, 1.89% for DGRW, and 0% for SCHD. A rebound would undoubtedly be welcome news for VIG shareholders.
Seeking Alpha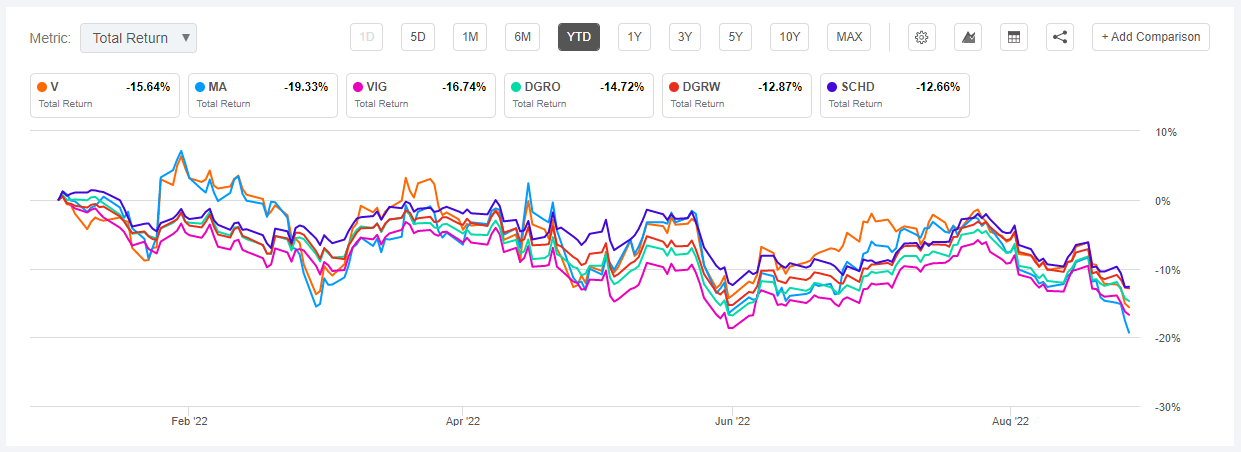
Investment Recommendation
VIG has an excellent track record, scoring points for total ten-year returns and overall consistency. However, its fundamentals are still important, given that’s what owners hold today. The bottom line is that VIG’s 2.03% yield is well below average and what DGRO and DGRW feature. Its constituents have a five-year dividend growth rate of 11.31%, similar to what DGRO, DGRW, and SCHD offer. Finally, while its 14.28% estimated EPS growth rate is impressive, DGRO and DGRW offer the same growth but at a lower valuation. More defensive investors can opt for SCHD, which provides a nearly six-point discount on future earnings for just 2% less growth.
On the plus side, analysts are showing positive sentiment for stocks like Visa and Mastercard, which VIG overweights. They’ve declined substantially this year, and although their valuations remain relatively elevated, we may be nearing the end of high dividend / low P/E stocks being favored. That’s the primary threat to my thesis that VIG will underperform, but I still choose to stay cautious given the many uncertainties in the market. I hope my reasoning makes sense, and as always, I look forward to discussing this further in the comments section below.
Be the first to comment