

AndreyPopov/iStock via Getty Images
Investment Thesis
The Vanguard Dividend Appreciation ETF (NYSEARCA:VIG) is the most popular U.S. dividend ETF, with over $66 billion in assets under management. With an ultra-low 0.06% expense ratio and a 202% ten-year total return, I’d be surprised if it’s not on your radar. Nevertheless, I cautioned investors in November 2021 and several times last year, citing its high valuation and the importance of not relying on historical returns. The result was a 9.81% decline in 2022 and 1.99% decline over the last year. Both figures place VIG in the third-quartile for performance.
However, I want to express my optimism about VIG again. The market environment substantially changed over the last year, and VIG no longer has such a vast growth gap with the SPDR S&P 500 ETF (SPY). Furthermore, neither SPY, the iShares Core Dividend Growth ETF (DGRO), nor the Schwab U.S. Dividend Equity ETF (SCHD) features the same degree of positive earnings momentum as VIG. This article will compare the fundamentals for all four ETFs and provide a forecasted portfolio for next month’s reconstitution. After assessing these details, I’m confident you’ll come to the same positive conclusion as I have.
VIG Overview
Strategy Discussion: The Yield Trap Screen
Effective September 20, 2021, VIG has tracked the S&P U.S. Dividend Growers Index after previously tracking the NASDAQ U.S. Dividend Achievers Select Index. After reviewing articles and comments on articles of other contributors, there’s debate whether VIG’s historical performance carries weight anymore. I think it does, as key features like consistent dividend growth and the exclusion of REITs remain the same. Furthermore, the S&P U.S. Dividend Growers Index explicitly removes the top 25% of eligible stocks as ranked by indicated yield (15% for existing constituents).
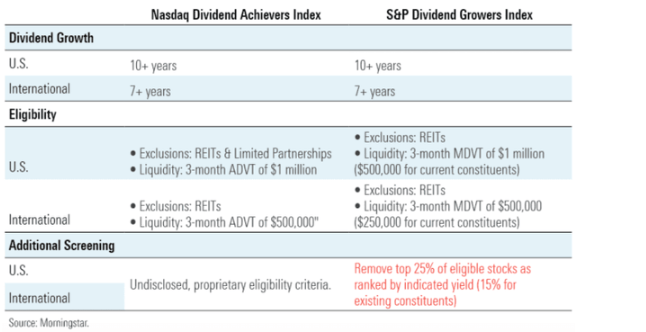
Morningstar
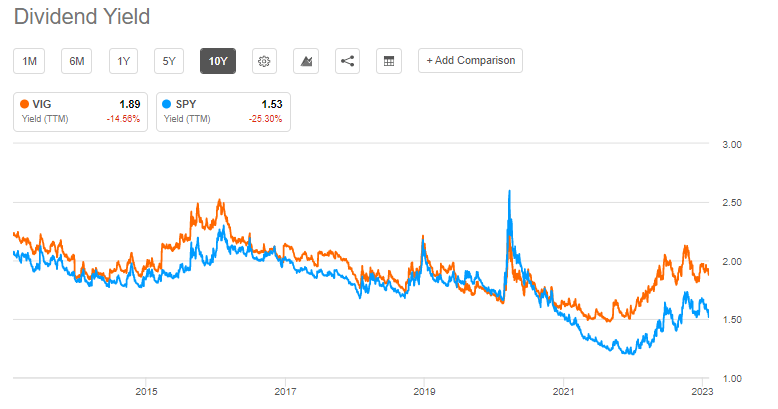
The Nasdaq Dividend Achievers Index used undisclosed, proprietary criteria but likely used a similar yield trap screen. Remember that VIG has never been a high-yielding fund. The expectation would be a decrease in VIG’s dividend yield if such a screen were not in place. However, the spread compared to SPY is greater today than in the last ten years.
Seeking Alpha
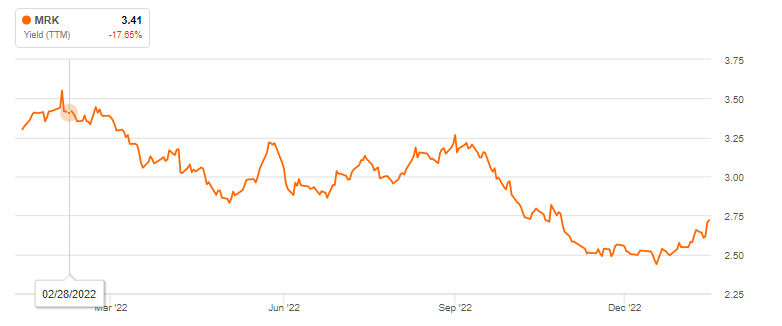
I cross-checked based on the holdings details I previously downloaded. Before the Index change, VIG held 248 securities. The following year, VIG had approximately 280 securities with just 12 removals. The most significant was Merck & Co. (MRK). The reference date for assessing eligibility based on yield is the last business day of February, when MRK’s trailing and forward yields were 3.41% and 3.72%. That likely was just enough to place inside the top 15%. Otherwise, the Index change was not impactful. In this example, the removal of MRK was harmful, as the stock gained 34% over the last year.
Seeking Alpha
Top Holdings and Sector Exposures
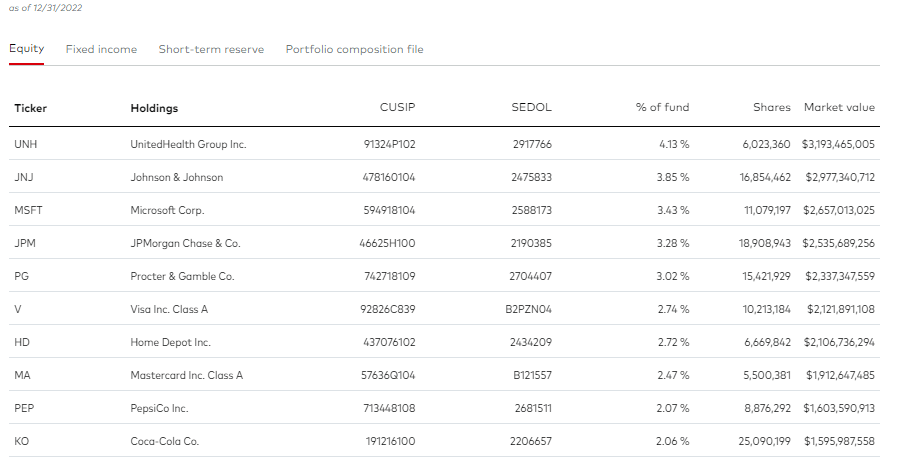
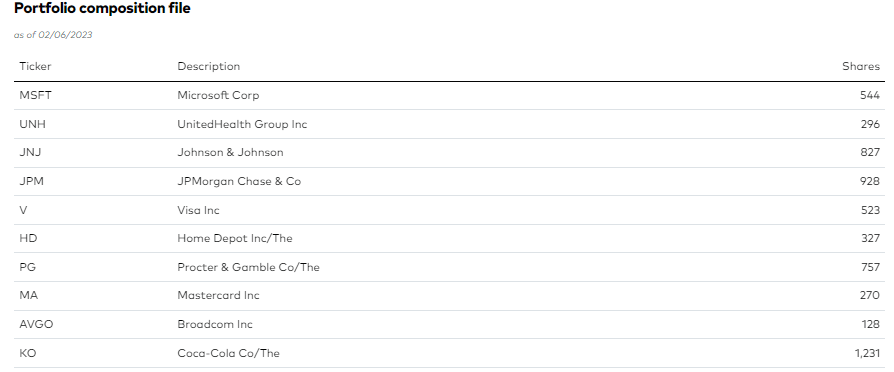
Vanguard re-designed its fund pages last year, and I don’t like the changes. Holdings are updated mid-month and can be delayed by around 45 days. VIG’s top ten holdings, as of December 31, 2022, are led by UnitedHealth Group (UNH), Johnson & Johnson (JNJ), and Microsoft (MSFT).
Vanguard
However, according to the portfolio composition file, Microsoft is currently the largest holding, followed by UnitedHealth Group and Johnson & Johnson. Broadcom (AVGO) has entered the top ten, and Visa (V) has jumped five spots with a weighting of 2.74%.
Vanguard
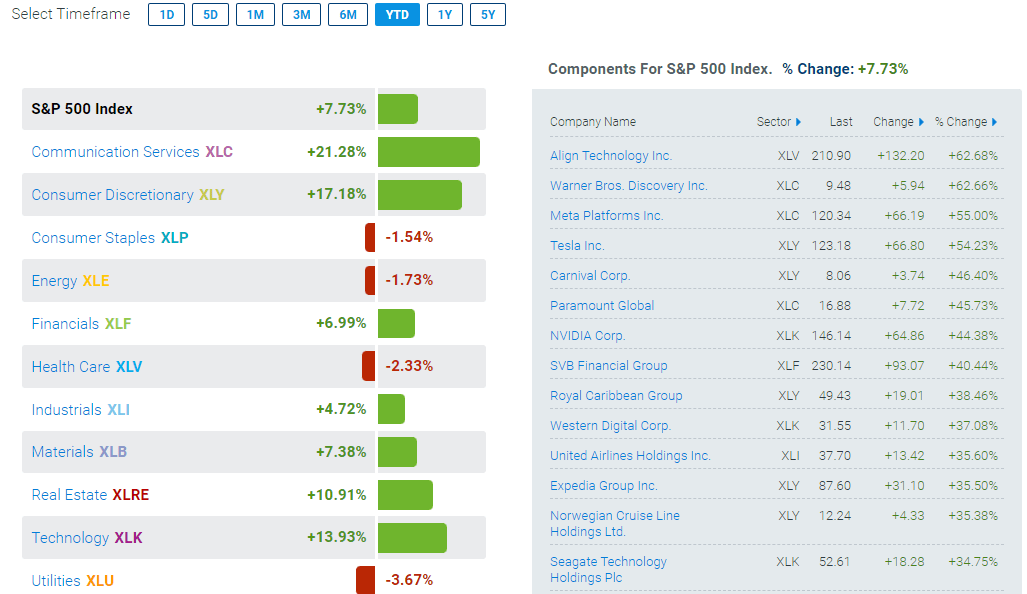
I usually don’t bother noting these changes but given the significant variances in sector returns this year, it was necessary. State Street’s Sector SPDR Tracker highlights how Communication Services and Consumer Discretionary are up 21.28% and 17.18% YTD, while three defensive Sectors (Consumer Staples, Health Care, Utilities) and Energy are down. The table to the right highlights how several more speculative stocks, like Meta Platforms (META) and Tesla (TSLA), have delivered 50%+ gains. VIG doesn’t include these names, but it’s still noteworthy because it suggests valuations will be less critical in 2023. In other words, my thesis in November 2021 may not apply anymore, and we should consider evaluating VIG from a growth and momentum perspective instead.
State Street
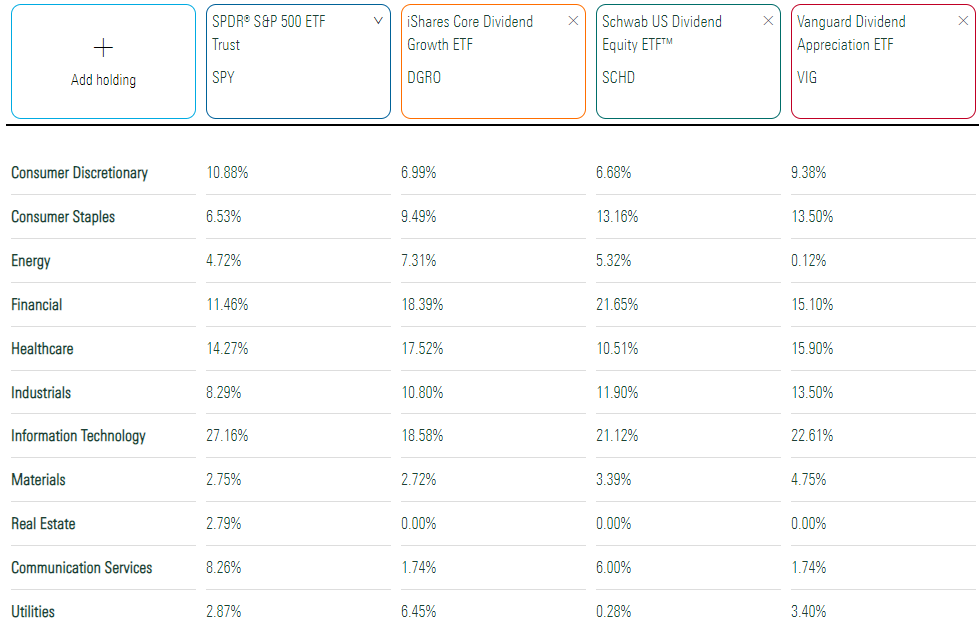
The following table highlights sector exposure differences for VIG, SPY, DGRO, and SCHD. VIG’s allocations are slightly off due to the issue described earlier. Current allocations put Consumer Staples, Health Care, and Utilities exposure at 0.56%, 1.07%, and 0.58% lower. Meanwhile, Financials and Technology are up 0.44% and 1.41%.
Morningstar
DGRO already went through its annual reconstitution, while SCHD’s will occur next month. Currently, VIG’s 24.02% Technology exposure is close to SPY’s 27.16%, indicating it’s the group’s most “market-like” dividend fund. VIG excludes Apple (AAPL) and underweights Microsoft and leans more into Data Processing & Outsourced Services stocks like Visa and Mastercard (MA)). There are still some excellent diversification benefits of pairing VIG with SPY, even though their sector exposures appear similar.
VIG Performance Analysis
VIG vs. SPY
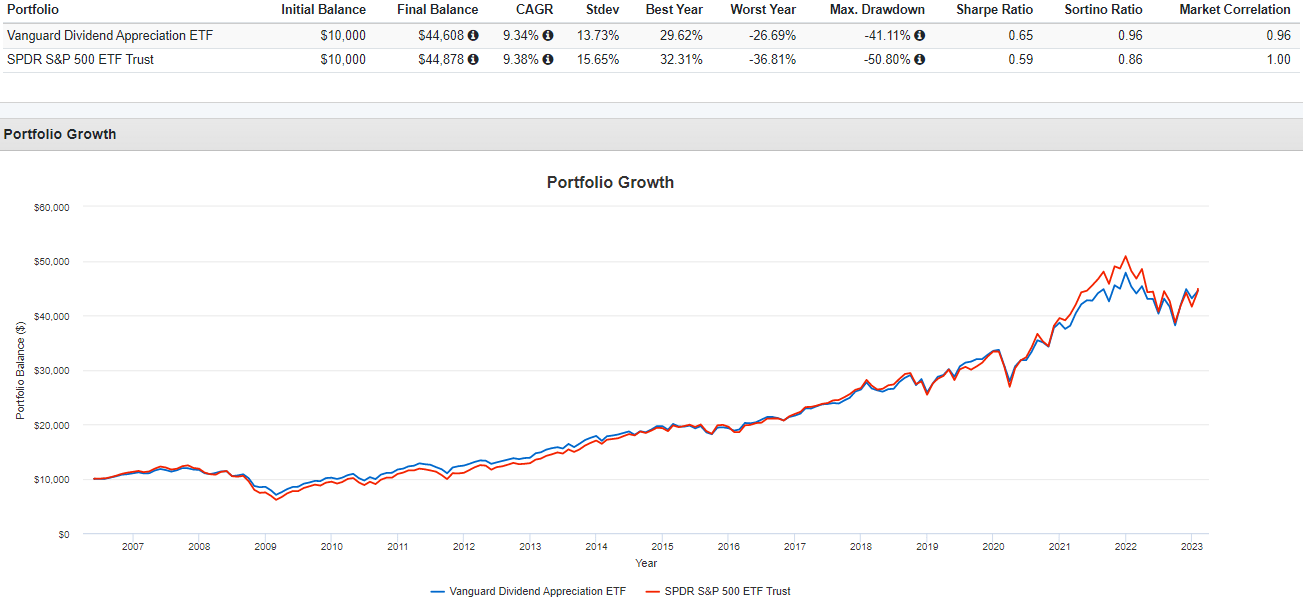
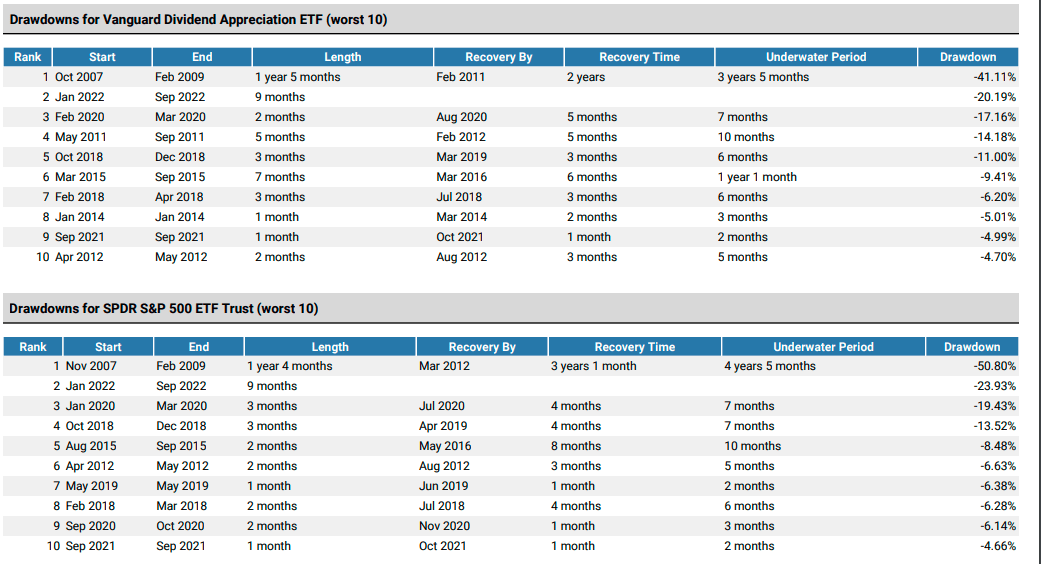
VIG launched in May 2006 and has delivered an annualized 9.34% gain compared to 9.38% for SPY. Its key advantage was a lower annualized standard deviation (13.73% vs. 15.65%) and a lower maximum drawdown (41.11% vs. 50.80%). These are Great Financial Crisis figures, and VIG fully recovered by February 2011, 13 months quicker than SPY.
Portfolio Visualizer
A speedy recovery from drawdowns is a nice feature. The tables below highlight how VIG’s drawdowns are usually lower than SPY’s, and the recovery times are faster. While neither ETF has recovered from the January to September 2022 drawdown, VIG is closer. Since January 2022, VIG is off 6.75% compared to 11.77% for SPY. These metrics are important, especially for dividend investors who tend to be conservative. Most investors with an average time horizon can handle a 20-30% decline. However, it’s completely different to experience a 50% decline with recovery more than four years away. Unless you’ve been there before, it’s difficult to know whether you would “stay the course,” and I think investors should strive to reduce unnecessary risk in their portfolios wherever possible.
Portfolio Visualizer
VIG vs. SPY, DGRO, SCHD
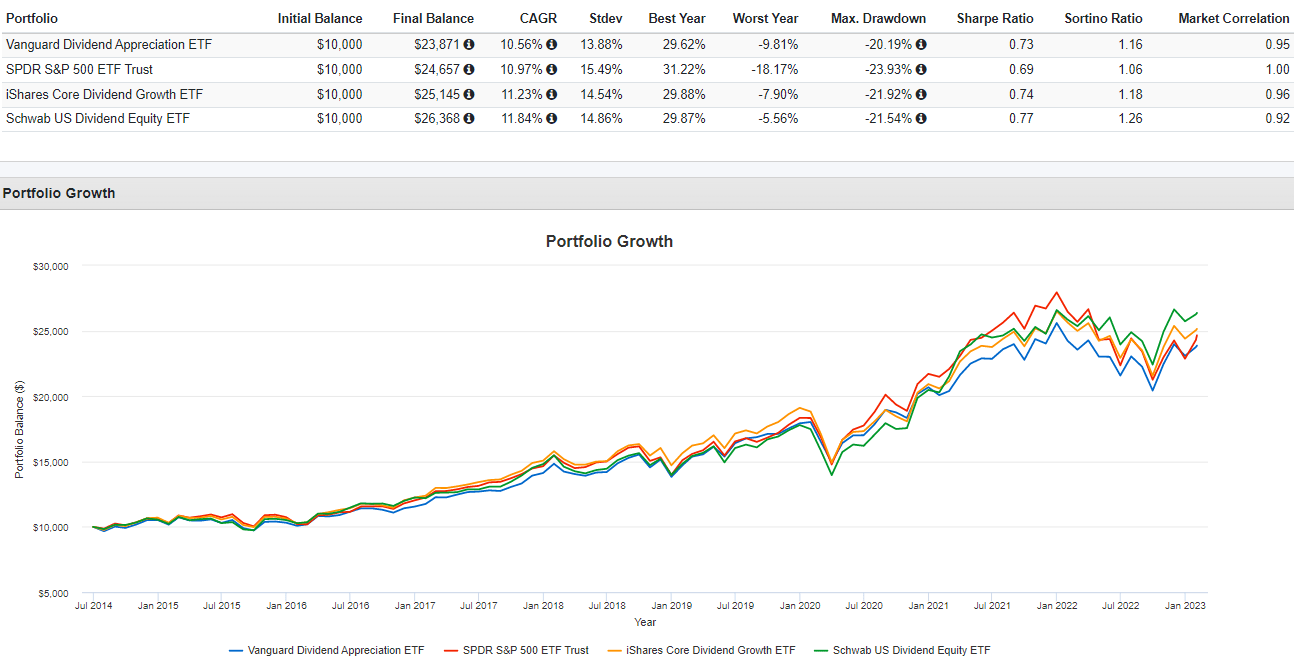
The following chart highlights more recent returns since June 2014, DGRO’s inception date. VIG underperformed all three funds. Its volatility and drawdown advantage were there, but these results suggest it’s not the best dividend fund. ETF investing isn’t a popularity contest, and even though VIG has over $66 billion in AUM, DGRO and SCHD are no slouches either at $25 billion and $47 billion. SCHD outperformed VIG by 6.68% last year, so despite its higher volatility, it seems like a safer pick.
Portfolio Visualizer
VIG vs. The Entire U.S. Dividend ETF Market
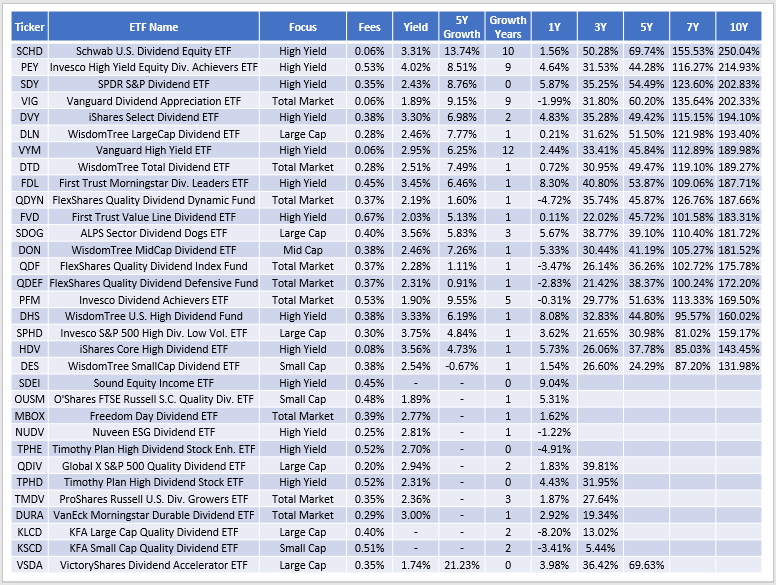
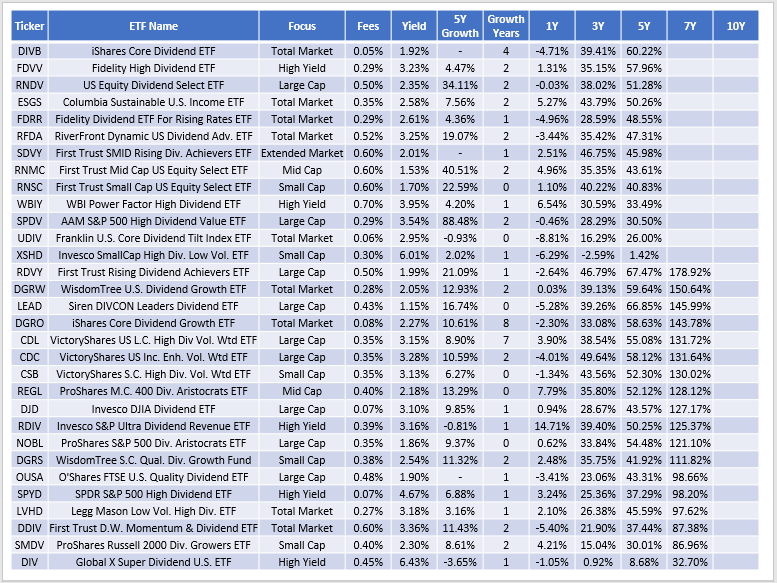
Finally, I’ve provided historical returns for all 63 U.S. dividend ETFs in the following two tables. Ten-year total returns through January 2023 sort these ETFs, and I’ve also included the following:
- Trailing dividend yield.
- Five-year dividend growth rate.
- The number of years of consecutive dividend growth.
The Sunday Investor
The Sunday Investor
Regarding consistently strong dividend growth, there are few funds with impressive track records, but VIG is one of them. Its 9.15% five-year dividend growth rate ranks #19, tied with PEY for the third-longest consecutive growth streak at nine years. Still, SCHD is stronger on both these metrics, plus it has a higher 3.31% yield and superior ten-year returns (250% vs. 202%). Over the last year, VIG’s 1.99% decline ranked just #46.
VIG Analysis
Two months ago, I ranked VIG compared to 100 large-cap peers, concluding that a purchase made little sense considering its valuation, profitability, and expected growth. I noted its superior earnings momentum as indicated by the EPS Revision Score I calculated using Seeking Alpha Factor Grades. Still, it was lower than SCHD’s at the time, so I couldn’t justify a buy rating.
I didn’t expect a substantial drop in EPS Revisions Score for most peers while VIG held firm (5.83/10 to 5.67/10). I’m encouraged by this metric and its earnings growth advantage as we move through the earnings season. The following table highlights selected metrics for VIG’s top 25 companies, with summary metrics for all four ETFs in the bottom rows.
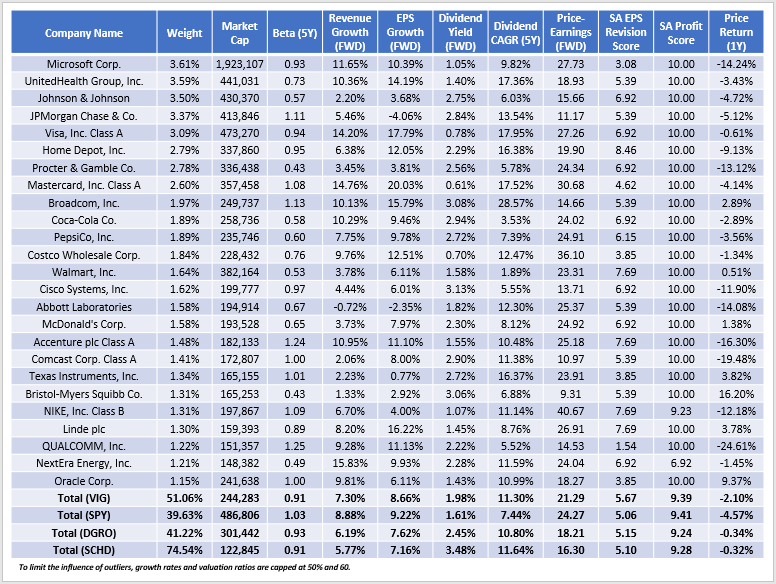
The Sunday Investor
A few observations:
1. VIG has 51% of assets in these holdings and a weighted-average $244 billion market capitalization, twice the size of SCHD. SPY’s is $487 billion, but if you exclude Apple, Alphabet (GOOGL, GOOG), and Amazon (AMZN), it drops to $288 billion. Therefore, they’re structurally similar, and if you’re looking to avoid some of these mega-cap names, VIG makes sense.
2. VIG’s five-year beta is 0.91, supporting the lower volatility discussed earlier. There aren’t many volatile industries included, except for Semiconductors. Led by Broadcom, VIG holds six with betas between 1.01 and 1.59.

Seeking Alpha
3. VIG has substantially closed the earnings growth gap with SPY since my November 2021 review. At the time, VIG’s 13.46% estimated earnings growth rate was 15.70% less than SPY. Today, it’s only 0.56% (8.66% vs. 9.22%). Its growth rate is also better than DGRO’s and SCHD’s, the latter I tried to improve by combining it with two complementary ETFs. VIG’s overall ranking on this metric is #16/63. Although 15 others have better growth rates, all but two (LEAD, HDV) come with a substantial profitability sacrifice.
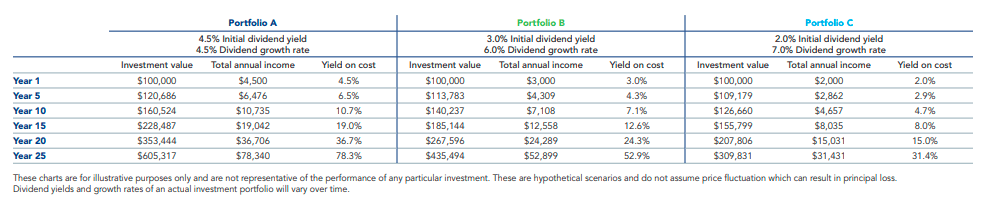
4. VIG’s constituents yield 1.98%, and I expect a 1.92% net yield after deducting fund fees. The 11.30% five-year dividend growth rate indicates the streak will continue, primarily since it’s supported by solid sales and earnings growth. Still, the yield is low, and income investors should look elsewhere. Federated Hermes highlights the importance of a high starting yield. In these scenarios, which exclude price appreciation, Portfolio A (high yield, low growth) still produces the best yield on cost over the long run.
Federated Hermes
5. VIG trades at 21.29x forward earnings, 2.98 points below SPY. DGRO and SCHD trade at 18.21x and 16.30x forward earnings, so they’re cheaper alternatives that benefitted from a cautious 2022. The ProShares S&P 500 Dividend Aristocrats ETF (NOBL) is the only peer with a higher valuation (21.78x forward earnings). However, VIG generally holds higher-quality and higher-growth companies, which is my preference.
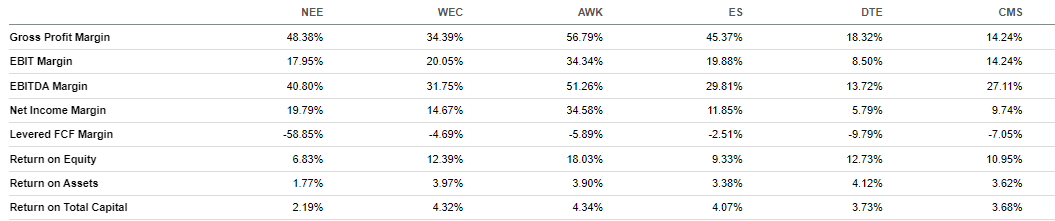
6. VIG’s 9.39/10 Profitability Score, derived from individual Seeking Alpha Factor Grades, ranks #10/63 and is just as good as SPY. Most top holdings have a perfect 10/10 Score (A+ Grade), and you will only run into profitability issues once you get down to the assets outside the top 100. The key exception is NextEra Energy (NEE), #24 on VIG’s list. Utility stocks generally have average scores with low return on asset and total capital ratios and negative free cash flow margins. Here are VIG’s top six that total 2.23% of the fund.
Seeking Alpha
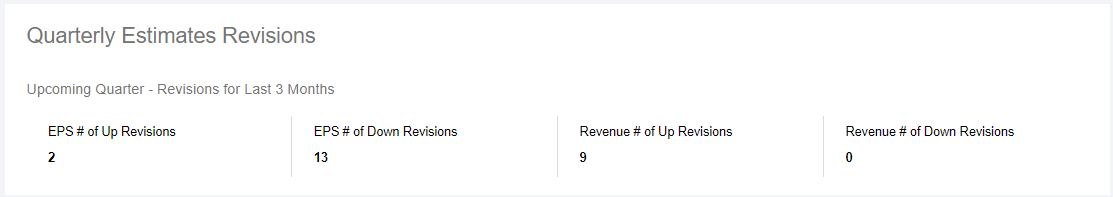
7. VIG’s 5.67/10 EPS Revision Score is substantially better than SPY, DGRO, and SCHD. It’s a key reason for my optimism, so let’s look at how VIG is handling this earnings season.
The Sunday Investor
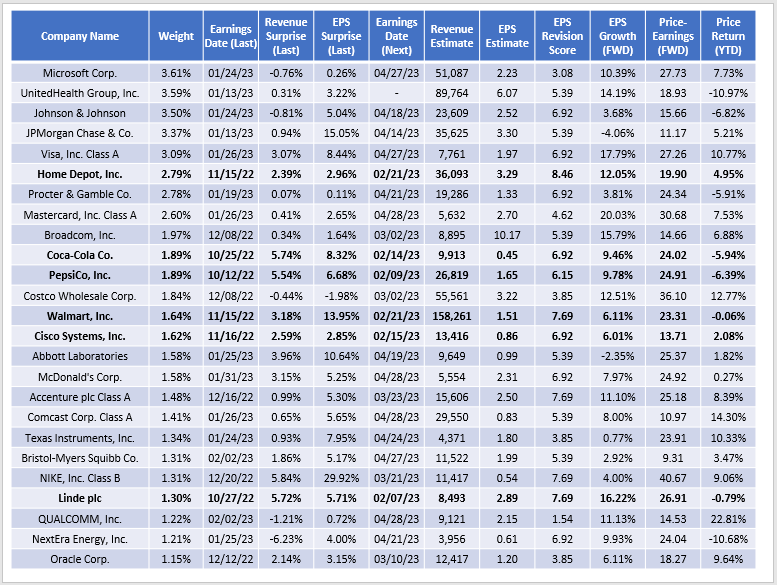
Several top holdings have already reported, eliminating some of VIG’s earnings risk. Microsoft disappointed with a flat sales and earnings surprise and left analysts doubting management guidance. Shares are still up 7.73%, but that’s only about half what the Technology Select Sector SPDR ETF (XLK) has delivered. In contrast, UnitedHealth Group is down 11% YTD after posting a 3.22% earnings surprise. Most analysts have downgraded earnings expectations over the last three months, which might be driving the decline.
Seeking Alpha
Home Depot (HD), Coca-Cola (KO), and Walmart (WMT) are names to watch over the next two weeks. Homebuilders rallied 5% last week, boosting Home Depot and Lowe’s (LOW), #27 on VIG’s holdings list. Most analysts (7/9) increased their EPS targets for Coca-Cola over the last three months. Finally, three quarters have increased earnings targets for Walmart, a relatively safe stock that’s been flat over the previous two years.
Reconstitution Predictions
Key Addition Based on Dividend Growth: Apple
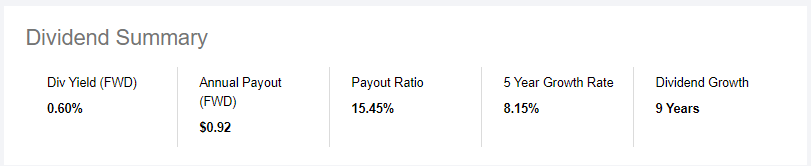
Seeking Alpha provides the number of years of consecutive dividend growth on its “Dividend Scorecard” page for most U.S. securities. For example, Walmart is on a 49-year streak, easily meeting VIG’s 10-year minimum.
Seeking Alpha
I scanned Seeking Alpha’s database for securities with nine or ten years of consecutive dividend growth that aren’t included in the Invesco Dividend Achievers Portfolio ETF (PFM). PFM doesn’t have a yield trap screen and reconstitutes in March, so it should help us understand the starting universe for VIG. I found 70 securities, excluding REITs and a few limited partnerships. The top ten and their market capitalizations (in millions) are listed below:
- Apple: 2,446,695
- Bank of America (BAC): 291,323
- AbbVie (ABBV): 256,696
- Danaher (DHR): 196,532
- Morgan Stanley (MS): 166,545
- Mondelez International (MDLZ): 90,008
- ResMed (RMD): 32,996
- Nasdaq (NDAQ): 29,747
- Vulcan Materials (VMC)
- Hartford Financial Services Group (HIG): 23,784
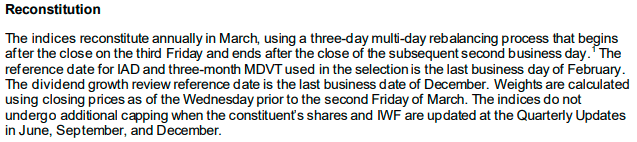
Apple paid a split-adjusted $0.0946/share dividend to shareholders of record on November 12, 2012. The company has increased dividends yearly, with a $0.23/share payment made to shareholders of record on November 7, 2022. That’s ten consecutive years of increases, and the Index methodology clearly states how the reference date for dividend growth review is the last business date of December.
S&P Dow Jones Indices
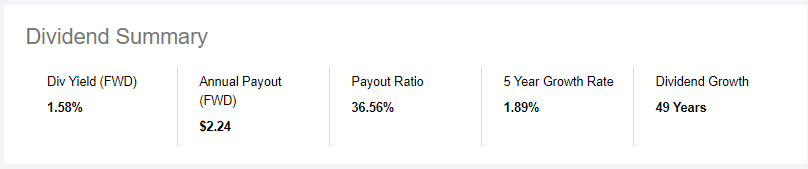
This addition will push VIG’s yield down further while doing little to improve its dividend growth feature. The stock yields 0.60% and has an 8.15% five-year dividend growth rate.
Seeking Alpha
The Index should only remove two current holdings from the starting universe: Activision Blizzard (ATVI) and Gentex (GNTX), with weightings of 0.44% and 0.06%, respectively. Generally, the “Dividend Achievers” status is becoming less unique, which may decrease the benefits of the strategy.
Finally, Exxon Mobil (XOM) is a potential addition because its 3.25% forward dividend yield is close to the 25% mark (23.54%). A solid February share price gain should be enough to push it through. Merck & Co. is well-above at 34.30%, while Broadcom and Cisco Systems (CSCO) are right around the 25% mark and can go either way.
Projected Portfolio
Based on this research, I compiled fundamental metrics for my expected version of VIG if the Index reconstituted today. As a reminder, the Index is free-float market-cap-weighted and places a 4% weight limit on each security.
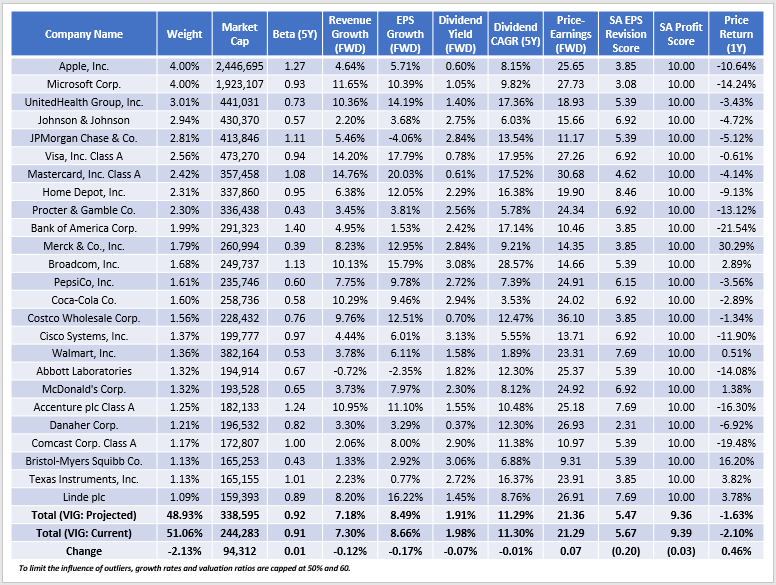
The Sunday Investor
My projections indicate an increase in the portfolio’s beta from 0.91 to 0.92. Estimated growth and valuation remained essentially the same, though the expected yield dropped 0.07% because of Apple and the rebalancing of Microsoft to the maximum 4% weighting. Unfortunately, the EPS Revision Score declined to 5.47/10. If this materializes, it would be disappointing, but a lot can change as we progress through earnings season. It’s prudent to wait for more information before changing my rating.
Investment Recommendation
VIG was worth a fresh look for several reasons:
1. Its expected sales and earnings growth rates are close to SPY’s and more robust than most dividend peers. This factor will be essential if market sentiment changes, and there are early signs this is occurring based on impressive YTD returns from riskier sectors like Technology.
2. VIG’s EPS Revision Score held firm over the last couple of months while other peers, including DGRO and SCHD, declined. This score suggests analysts are more bullish on VIG’s holdings, which could provide a tailwind as we progress through earnings season.
3. I expect Apple to join the ETF when its Index reconstitutes next month. I’m not thrilled with this change, as it makes VIG less unique and drives down the fund’s already low dividend yield.
I’ve decided to hold off on providing a buy recommendation until the reconstitution is complete, but I wanted to put it on your radar before that happened. I hope you enjoyed this analysis, and I look forward to the discussion in the comments section below.
Be the first to comment