

Dilok Klaisataporn
Investment Thesis
Last week, I analyzed the Schwab U.S. Dividend Equity (SCHD) against 100 dividend- and value-focused ETFs. It was one of the best choices available, excelling on dividend growth and yield, volatility, risk-adjusted returns, and overall profitability. Today, I want to apply the same ranking system to another top-rated and successful fund: the Vanguard Dividend Appreciation ETF (NYSEARCA:VIG).
In past articles, I reasoned that investors should avoid VIG as market sentiment deteriorated because it trades at a persistently high valuation: 21.57x forward earnings. Furthermore, VIG’s dividend features are only average and has poor growth potential and earnings momentum. Therefore, I’m comfortable maintaining my hold rating, and I hope this article’s information on over 30 sub-factors will help you make the best decision for your portfolio.
Creating The ETF Universe
Recognizing that VIG investors are only somewhat dividend-focused compared to SCHD investors, selecting an entirely new ETF universe to rank against was necessary. Morningstar classifies VIG as a Large Blend ETF and SCHD as a Large Value ETF, so I want to avoid unfairly penalizing VIG for its lack of high yield when that isn’t the expectation. Instead, I want to be as objective as possible and set my personal biases aside. To create an appropriate ETF comparison universe for VIG, I selected large- and total-market blend ETFs meeting the following conditions:
- have a minimum of $300 million in assets under management
- be broad-based and not sector-focused
- invest primarily in U.S. equities
- not regularly use risk-management strategies like covered call writing
- not following an ESG strategy
- be passively managed
- have a trailing dividend yield below 2.50%
These screens resulted in a universe of 100 ETFs, and my system ranks each based on ten equal-weighted factors:
- ETF Basics (AUM, Volume, Fees, Market Capitalization)
- Diversification (Assets In Top 25 Companies & Industries, Sector Variances)
- Market Volatility (2Y Beta, 5Y Beta)
- Dividends (Historical and Estimated Yield, Growth)
- Growth (Sales, EBITDA, Earnings Per Share)
- Valuation (Price-Earnings, Price-Sales, Price-Cash Flow)
- Profitability (ROE, ROA, ROTC, Cash To Total Debt, EBITDA Margin)
- Price Momentum (Price vs. 50D SMA, 100D SMA, and 200D SMA)
- Market Sentiment (Sales Surprises, Earnings Surprises, EPS Revisions)
- Risk-Adjusted Returns (3Y, 5Y, 10Y)
I want to emphasize my approach to analyzing ETFs that places importance on how each is constructed today. Past performance reveals how well a strategy worked in a specific market environment. In contrast, analyzing an ETF’s current holdings removes the confusion caused by high turnover and highlights the factors driving the fund today. If you can identify which set of factors will prevail in a particular environment, you can also determine which ETFs will likely outperform. Still, even if you disagree with my approach, this article provides scores for each factor listed above, so it’s a simple matter of re-weighting them based on your preferences.
ETF Basics
Assets Under Management
VIG is our sample’s sixth most popular ETF, with $62.8 billion in net assets. Larger ETFs include SPY, IVV, VOO, VTI, and VTV. Therefore, VIG receives a strong 95/100 score on this metric. As discussed in my article on SCHD, ETFs with high assets under management give legitimacy to the fund provider and the overall strategy. When you screen for a broad-based ETF to buy, VIG will likely come up, creating an availability bias. Marketers count on it because they know you’re more likely to purchase something if you see it often enough and know many others have already done the same. Whether that demonstrates good judgment is open for debate, but I expect VIG to become even more dominant. It’s just so difficult for smaller ETFs to succeed, even if the strategy is superior.
Volume
Volume is the number of shares traded daily, and it’s important for investors because they will eventually need the freedom to unload any shares at a fair price. The ETF Database reports that VIG has had an average of 1.72 million shares traded daily over the last three months. That’s the 18th best, earning VIG a score of 83/100. There are also several lesser-known ETFs with impressive volume figures, including the iShares Core Dividend Growth ETF (DGRO) and the Pacer US Cash Cows 100 ETF (COWZ). DGRO and COWZ have average trading volumes of 1.91 million and 1.72 million.
However, market makers provide a second level of liquidity for ETFs. Through creation and redemption, they can almost always exchange the basket for a fair price, provided the underlying holdings are liquid. That is why nearly all large-cap ETFs trade at or near their net asset values and have minimal median bid-ask spreads. In VIG’s case, it’s just 0.01%, and this information is usually provided directly by the provider.
Vanguard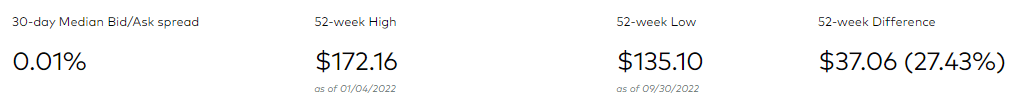
Fees
In addition to assets under management, fees are often a crucial screen for investors, as they should be. High-fee ETFs destroy wealth over the long term because they compound. In my SCHD analysis, I estimated that an ETF with a 0.60% expense ratio would reduce your gains by 12.17% over 20 years, assuming a 10% annual return. Fortunately, VIG’s expense ratio is just 0.06%, and you will only lose 1.27% of your gains to fees. VIG’s expense ratio is the 20th lowest, earning VIG 81/100 on this metric. Several ETFs have a 0.03% expense ratio, including VTI, SCHX, ITOT, SCHB, SPTM, and ILCB. Meanwhile, the BNY Mellon U.S. Large Cap Core Equity ETF (BKLC) leads the way by charging no fees. BKLC tracks the Morningstar Large Cap Index, representing the largest 70% capitalization of the investable universe.
Market Capitalization
Market capitalization is not included in my rankings system because large-cap ETFs are not necessarily better than small-cap ETFs. However, for information purposes only, VIG’s weighted-average market capitalization of $236.18 billion is the 57th largest in our sample. Assuming you favor larger companies, its would-be score of 44/100 indicates that it’s less concentrated in mega-cap companies than most peers. However, I view this favorably right now. There’s been an apparent movement away from mega-caps lately, and ETFs like VIG have an advantage.
Overall, VIG scores well on the ETF basics section. By averaging the three scores used, VIG ranks 86.33/100 on these metrics, as summarized below.
The Sunday Investor
Diversification
There is debate about whether good diversification is a positive or negative feature for an ETF. On the one hand, a well-diversified ETF has a better chance of being well-rounded and, thus, is less likely to steer you wrong in the long run. On the other hand, if your goal is to beat the market, having a different composition than a market ETF is required. Diversified ETFs may be less-focused, but all things equal, I still prefer an ETF to invest across a reasonable number of companies, industries, and sectors. Therefore, my rankings reflect that, and I measure diversification in three ways:
- percentage of assets in the top 25 holdings
- percentage of assets in the top 25 industries
- the sum of the absolute differences by sector
Percentage of Assets In The Top 25 Holdings
VIG is a reasonably well-diversified ETF with 50.87% of assets in its top 25 holdings. This allocation qualifies it as a core holding, potentially as a replacement for an S&P 500 Index ETF like SPY, IVV, VOO, or SPLG. However, nearly all ETFs in our sample are well-diversified. VIG’s percentage of assets in its top 25 holdings is only 81st lowest, earning it a score of 20/100.
Percentage of Assets In The Top 25 Industries
I prefer analyzing an ETF by industry because it’s a nice compromise between an individual holdings diversification analysis and a sector diversification analysis. Unfortunately, it’s necessary to calculate this metric yourself.
VIG has 75.41% of assets in its top 25 industries, the 71st best (30/100). Suppose you’re looking to maximize industry diversification. In that case, the best options are the Invesco S&P 500 Equal Weight ETF (RSP) and the Invesco Russell 1000 Equal Weight ETF (EQAL), which have about 50% of assets in its top 25 industries. For a more focused approach, try the VanEck Morningstar Wide Moat ETF (MOAT) or the SPDR Dow Jones Industrial Average ETF (DIA). These ETFs have exposure to about 25-30 industries each.
Sum of Absolute Variances By Sector
This metric is one I calculate myself, so it won’t be available elsewhere. On the basis that a perfectly diversified fund will have a 9.09% sector weighting (9.09% x 11 sectors = 100%), we can measure an ETF’s sector diversification by summing all the absolute variances for each sector. To illustrate, VIG has a 1.70% weighting in the Communication Services, so it’s 7.39% underweight a perfectly diversified portfolio. The process is to add all these figures for each sector, regardless of whether it’s underweight or overweight, and funds with the highest total values are considered less diversified.
VIG’s total value is 71.49% or 82nd lowest. Therefore, my ranking system gives it a score of 19/100. However, many investors see low diversification as a positive feature. Depending on what other ETFs you hold, there’s little value in adding ultra-diversified ETFs on top of each other, and doing so would likely result in what’s called “diworsification.” Eventually, too many stocks become a detriment to your portfolio, so there’s some value in being selective. VIG scores a 23/100 on diversification, as summarized below. However, for those using VIG as a tactical add-on, you can reverse that score to 77/100 instead.
The Sunday Investor
Market Volatility
Utilizing the two- and five-year beta figures Seeking Alpha provides for most securities, we can calculate weighted-average portfolio betas for each ETF even if the fund wasn’t trading for that long. This approach is more accurate because it represents what you own today rather than what the ETF held historically. Rules-based ETFs rotate their holdings on a fixed schedule, and if the screens used are sensitive, or the strategy selects very few holdings, portfolio turnover can be high, and past results may mislead you.
There isn’t a “correct” portfolio beta. It’s merely a reflection of the amount of risk you’re willing and able to take on. For example, the Invesco S&P 500 Low Volatility ETF (SPLV) has a 0.66 five-year beta, while the Invesco S&P 500 High Beta ETF (SPHB) is at 1.50. By definition, market ETFs are around 1.00, so you can use that to benchmark how aggressive you want to be.
VIG’s two- and five-year betas are currently 0.85 and 0.89, or the 32nd and 17th lowest in the sample. Most dividend growth investors are more defensive, so I will rank low-volatility ETFs more favorably. Therefore, VIG earns a 69/100 and 84/100 ranking on these metrics. Overall, VIG’s market volatility ranking is a solid 76.5/100.
The Sunday Investor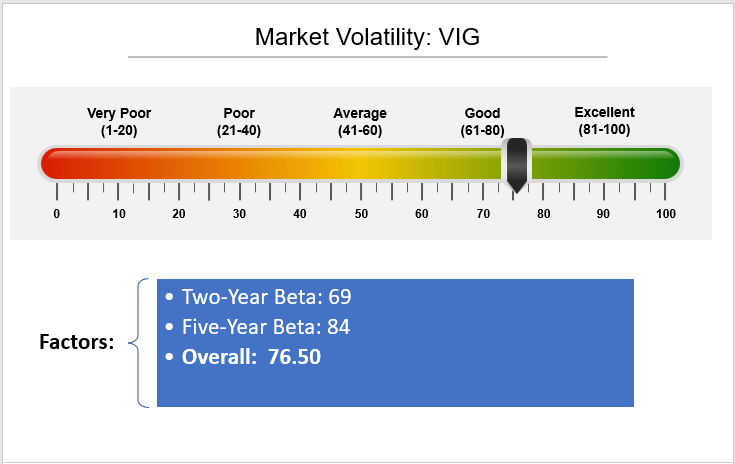
Dividends
I will measure how well VIG scores on dividends in four ways:
- Current Trailing Dividend Yield
- Current Five-Year Dividend Growth Rate
- Estimated Dividend Yield Based On Current Holdings
- Five-Year Dividend Growth Rate Based On Current Holdings
First, VIG’s trailing dividend yield is 1.86%, the 32nd best, and its historical five-year dividend growth rate is 8.08% or the 27th best. Therefore, VIG’s scores on these two metrics are 69/100 and 74/100, respectively.
To estimate an ETF’s dividend yield, I calculated the weighted-average yield of its current holdings and subtracted the expense ratio. While other factors can impact net distributions, this method is usually a good approximation. I’ve estimated VIG’s dividend yield to be 1.91%, close to its 1.86% trailing dividend yield and the 32nd highest (69/100) in the sample. VIG’s current holdings have an impressive 11.28% five-year dividend growth rate, third-best (98/100) behind the First Trust Rising Dividend Achievers ETF (RDVY) and DGRO. That’s great news for dividend growth investors, but the relatively low starting yield means investors will need a long-time horizon before their portfolio can generate substantial income. DGRO looks slightly better, as its estimated yield is 2.33% or 0.42% more than VIG.
That said, VIG scores well on dividends for a large-cap blend ETF. By averaging the four sub-factor scores, I rate it at 77.5/100.
The Sunday Investor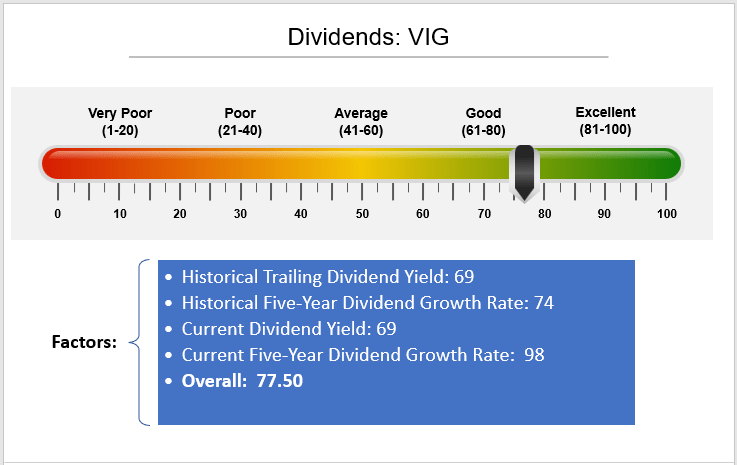
Growth
I measure an ETF’s growth based on three forward-looking metrics: sales growth, EBITDA growth, and EPS growth. Then, as an additional check, I look at an ETF’s weighted-average Seeking Alpha Growth Grade (on an adjusted ten-point scale), which considers how well stocks compare against their sector peers. A well-balanced portfolio needs a good growth component, so it doesn’t miss out on strong, sometimes irrational, bull markets like in 2020.
VIG’s one-year estimated sales growth rate is 8.56%, or only the 85th best in the sample (16/100). You’ll find several other dividend-focused nearby, like the WisdomTree U.S. Dividend Growth ETF (DGRW) at 8.03% and the O’Shares FTSE U.S. Quality Dividend ETF (OUSA) at 7.98%. Dividend investors should expect lower growth because each time a company pays a dividend, they have less money to invest in the business.
VIG’s one-year estimated EBITDA growth rate of 10.02% is also 85th-best (16/100). For reference, SPY has an EBITDA growth rate of 13.43%, which is a significant sacrifice for only a slight increase in dividend yield. Finally, VIG’s estimated EPS growth rate of 12.24% is 75th-best (26/100). The improvement is likely due to VIG’s above-average allocation to Financials stocks, whose earnings are lifted due to higher interest rates. Overall, I’ve scored VIG a poor 19.33/100 on growth, summarized below.
The Sunday Investor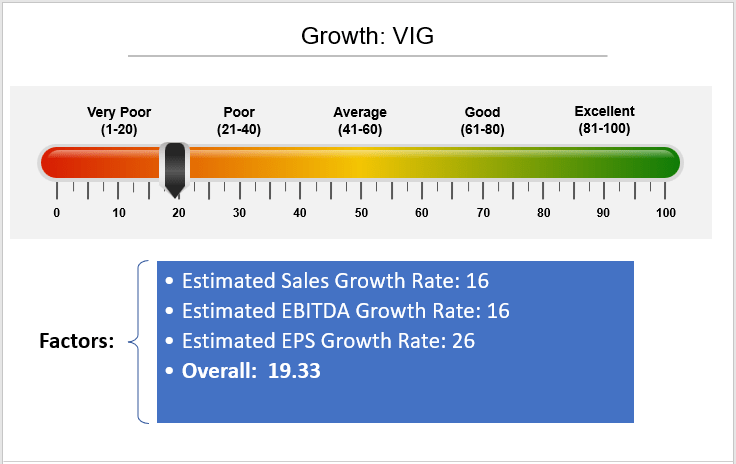
VIG’s weighted-average Seeking Alpha Growth Score is 3.08/10, or 87th highest in the sample (14/100). This additional metric confirms that VIG isn’t a great growth ETF and may have difficulty keeping up in a bull market. For reference, SPY’s Growth Score is 3.72/10, or 59th highest.
Valuation
Although an almost infinite number of factors go into a stock price, we generally expect low-growth companies to be trading at low valuations, too. I measure valuation based on three traditional metrics: forward price-earnings ratio, trailing price-sales ratio and trailing price-cash flow ratio.
VIG trades at 21.57x forward earnings or the 55th lowest. Surprisingly, it’s just 0.01x more expensive than the concentrated iShares S&P 100 ETF (OEF), which has a 12.87% EPS growth rate. Valuation turned me off VIG over the last year, as I couldn’t rationalize it based on its low sales, EBITDA, and earnings growth. This analysis examines other factors influencing a stock’s price, but on this metric, VIG’s ranking stands at just 46/100.
VIG’s trailing price-sales ratio is 4.53, or 57th lowest (44/100). Again, many ETFs trade at cheaper valuations, including DGRO (3.90) and DIA (4.01). S&P 500 Value ETFs like VOOV, IVE, and SPYV are at 3.50 and have better growth rates. For growth-at-a-reasonable-price investors, these are far more attractive. Finally, VIG’s trailing price-cash flow ratio is 19.89, the 57th lowest (44/100). VIG’s average valuation rating is 44.67/100, summarized below.
The Sunday Investor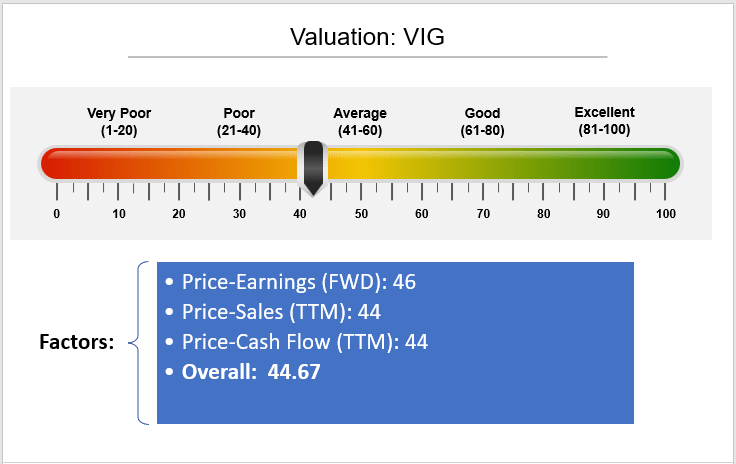
Profitability
While VIG isn’t great from a GARP perspective, investors should be willing to pay for quality. A company’s profitability is a good proxy for quality, and there’s something to be said for companies that consistently make money in any environment. This “profitability premium” is often apparent with large-cap ETFs, and my system measures it in five ways:
- Return on Equity
- Return on Assets
- Return on Total Capital
- Cash To Total Debt
- EBITDA Margins
VIG’s trailing return on equity ratio is a solid 28.72%, good enough for the 21st best in the sample (80/100). It has a 10.31% return on assets ratio (56/100) and a 15.33% return on total capital ratio (65/100). These scores are pretty good, and readers wanting more exposure to high-profitability companies can consider ETFs with “quality” in the name, such as the Invesco S&P 500 Quality ETF (SPHQ). Any mega-cap ETF will also work, as they overweight the largest companies that tend to be the most profitable.
The cash-to-total debt ratio is a company’s operating cash flow divided by its total debt. When calculating, I excluded holdings in the Financials and Real Estate sectors since the metric is often irrelevant for companies in those sectors. VIG’s weighted-average cash to total debt ratio is currently 0.54, only 72nd best (29/100). Finally, VIG’s 27.66% EBITDA margins are 44th best (57/100), and overall, the ETF scores an average of 57.40/100 on profitability, as summarized below.
The Sunday Investor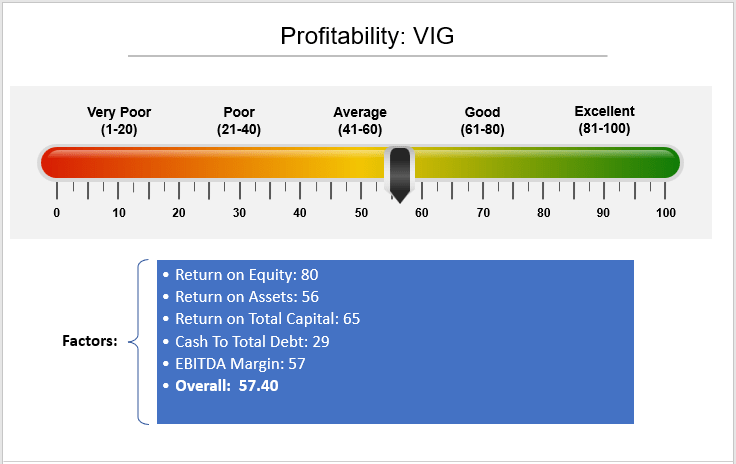
This score is disappointing. Between VIG’s low growth and average profitability, we’re running out of reasons why VIG trades at a premium relative to most of its peers. VIG’s 9.42/10 weighted-Seeking Alpha Profitability Score is still excellent. However, there are 26 others with better scores. The claim that VIG’s premium is justified because it selects only the highest-quality companies is unfounded.
Price Momentum
One way to measure price momentum is to compare an ETF’s price against its average 50-day, 100-day, and 200-day moving prices. We can remove any impact of portfolio turnover by looking at the ETF’s holdings; fortunately, Seeking Alpha readily provides this information. VIG’s holdings currently trade 6.65%, 4.77%, and 3.05% above these three moving average prices, good enough for scores of 68/100, 58/100, and 66/100. These scores average 64/100, which I consider good on my rankings scale. Still, S&P 500 Value ETFs were superior choices this year, and even DGRO has outperformed VIG by about 2% and has better dividend metrics.
The Sunday Investor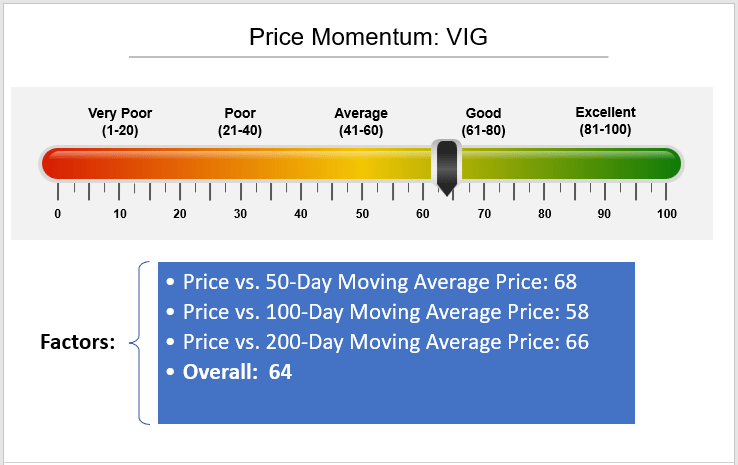
Market Sentiment
Market sentiment is often unappreciated by fundamental investors, and predicting direction is left to the technical analysts, whose approaches may be questionable. However, my solution is to track sales and earnings surprises each quarter, which is how a company’s results compare to analyst expectations. These figures are real, easy to interpret, and explain many sentiment changes over the last 15 years. The three metrics I use to measure market sentiment are:
- last quarterly sales surprise
- last quarterly earnings surprise
- EPS Revision ratings provided by Seeking Alpha
VIG’s weighted-average Q3 2022 sales surprise was 2.19%, which is about the same as SPY’s 2.18%. Unfortunately, there are 80 other ETFs whose constituents had higher sales surprises, so VIG gets a poor 20/100 score. VIG’s weighted-average Q3 2022 earnings surprise figure was 5.56%, or 57th best (44/100).
Finally, I rely on Seeking Alpha’s EPS Revision ratings to track Wall Street analyst consensus ratings. In a way, it doesn’t matter if their analysis is even correct. An investor may correctly assess that a stock is significantly undervalued. Still, if Wall Street is against it for any reason, that investor may wait a long time before they’re proven correct. I’ve learned the importance of accepting the direction the market is heading. That’s what the EPS Revision rating can help you do, and VIG’s is 5.83/10. It may sound unimpressive, but it’s the 9th-best score in our sample (92/100). It’s one reason you can use to justify VIG’s valuation, but that may be a stretch.
The Sunday Investor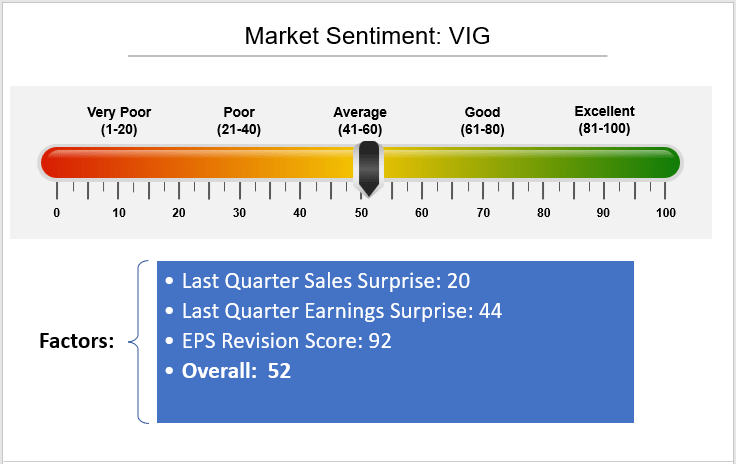
Risk-Adjusted Returns
Risk-adjusted returns are an ETF’s annualized returns divided by its annualized standard deviation based on monthly returns. I calculate three-, five-, and ten-year risk-adjusted returns for all U.S. Equity ETFs.
Through October, VIG’s three-year return-to-risk ratio was 0.52, or 10th best out of 96 ETFs. Its five-year return-to-risk ratio was 0.67, the best in our sample that included 89 ETFs. Finally, VIG’s ten-year return-to-risk ratio was 0.90, or fourth-best behind the iShares MSCI Minimum Volatility ETF (USMV), the First Trust Capital Strength ETF (FTCS), and the Invesco S&P 500 Quality ETF. A ten-year total returns chart, assuming reinvested dividends, is shown below for the four ETFs.
Portfolio Visualizer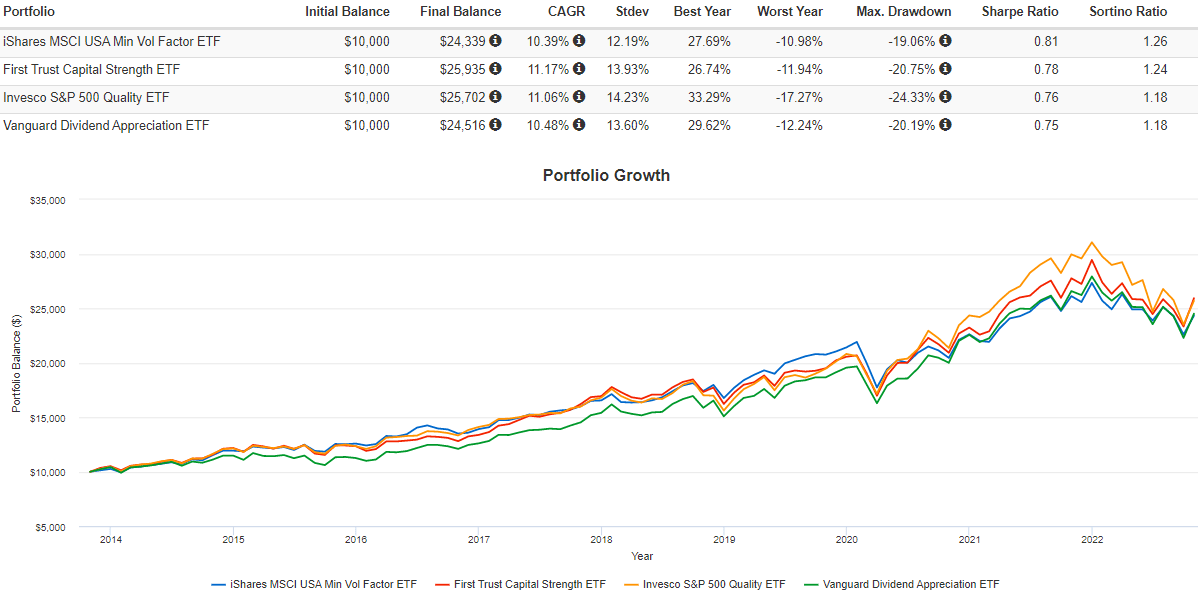
VIG’s three scores average 96/100, which is terrific. Even when including all multi-sector ETFs, VIG ranks ninth-best on ten-year risk-adjusted returns, behind QQQ, USMV, SCHD, IWY, FTCS, SPHQ, VONG, and IWF. For a large-cap blend ETF, that’s extremely impressive, so it’s easy to understand why so many investors turn to VIG.
The Sunday Investor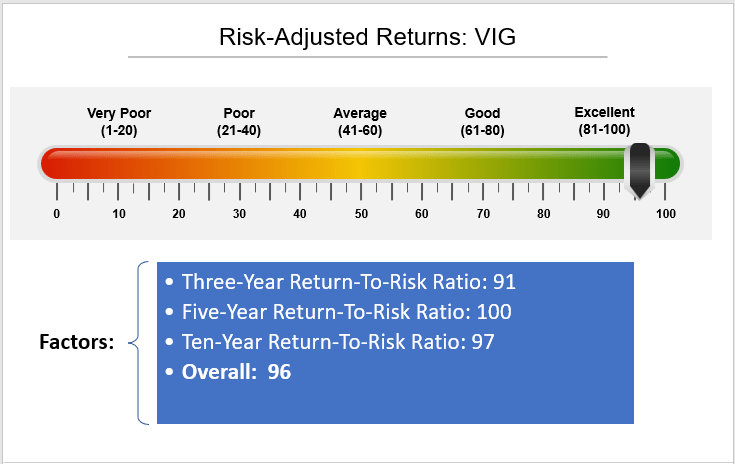
Overall Ranking
Following the same equal-weight approach as I did with SCHD, VIG’s overall score is 59.67, as summarized below. Its best features are its fund basics, which include low fees, high assets under management, and excellent risk-adjusted returns. If you want a focused portfolio, it also scores reasonably well on dividends, market volatility, EPS Revisions, and diversification. The downsides include low growth and a valuation that doesn’t compensate investors enough.
The Sunday Investor
Compared to all other ETFs in the sample, VIG is the 16th best, which is excellent. If you’re considering only the top ten by assets under management, only the Vanguard Value ETF (VTV) ranks better (3rd best). Therefore, VIG appears to be a solid large-cap blend ETF, and it’s evident that other funds also have their fair share of flaws.
However, when I run VIG against the same dividend and value comparators I did for SCHD, it scores only the 26th best. VIG’s value ranking decreased to 5.67 from 44.67, and its dividend ranking fell to 51.50 from 77.50. This data supports the concept that while VIG may be a suitable alternative to broad-based market ETFs like SPY, there are several better options for dividend- and value-focused investors.
The Sunday Investor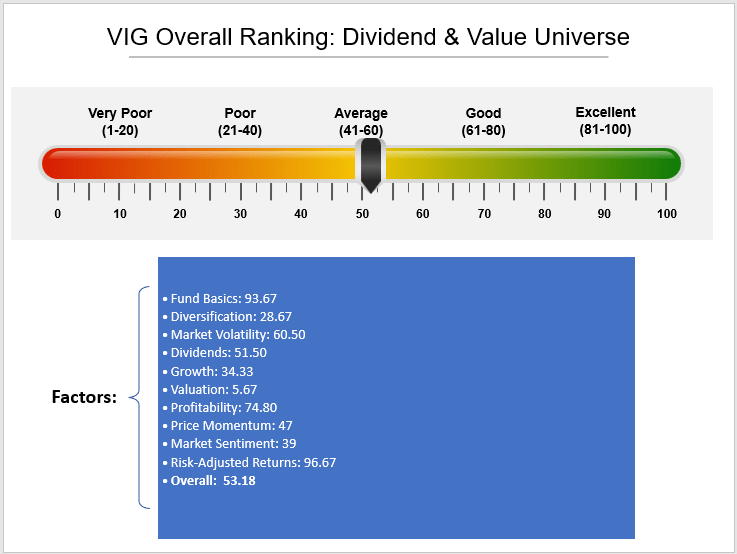
Fundamental Analysis
Finally, I want to take a closer look at VIG’s current top 25 holdings and compare the ETF’s metrics with four others you may be deciding between:
- SPDR S&P 500 ETF
- iShares Core Dividend Growth ETF
- Vanguard Value ETF
- Schwab U.S. Dividend Equity ETF
SCHD wasn’t part of the selection universe used for this analysis, but I wanted to include it so readers could see what a top-rated high-dividend ETF offers.
The Sunday Investor
Each of these ETFs offers something unique, but SCHD easily beats VIG on many fronts. In addition to better dividend yield and growth, SCHD trades at a valuation of 4.90 points lower (16.67 vs. 21.57). It also has a similar five-year beta, better price and earnings momentum, and a comparable profitability score. That leaves VIG with only modestly better sales and earnings growth rates and better diversification to explain its premium. It just doesn’t make much sense at these prices. This table highlights some of the culprits, including Microsoft (MSFT), Visa (V), and Procter & Gamble (PG), which all have average or low growth rates but still trade at 25x forward earnings. SCHD doesn’t hold these companies, nor four others in VIG’s top ten list (UNH, JNJ, JPM, MA).
This table also illustrates how easy it is to achieve VIG’s 1.97% dividend yield (1.91% after fees). DGRO’s net yield should be about 2.33%, and even VTV will net you around 2.43%. Although VTV isn’t technically a dividend ETF, 93.56% of its constituents by weight pay a dividend. Given its 3.93-point discount to VIG on forward earnings and comparable volatility, growth, price momentum, and earnings momentum scores, it deserves to be in the mix.
Finally, SPY looks the weakest of the five. Most people own some version of it, but it’s probably not the best ETF to add to. It has nearly identical valuation and profitability to VIG but weaker dividend metrics and lower price and earnings momentum figures.
Investment Recommendation
I hope this analysis helped explain why VIG is not high on my list of dividend ETFs to buy. Although it looks superior to SPY, VIG’s valuation makes little sense when considering what other ETFs offer regarding growth and profitability. One bright light is its above-average EPS Revision score, indicating that Wall Street has a more positive view of its holdings, which could lead to solid near-term performance. However, higher-yielding ETFs like DGRO, VTV, and SCHD trade at much cheaper valuations, and they’re the smarter play, in my opinion. Thank you for reading, and I look forward to the discussion below.
Be the first to comment