

PhonlamaiPhoto
Investment Summary
In our last note on ViewRay, Inc. (NASDAQ:VRAY) we specified several growth levers that have started engaging for the company. We suggested a price range of $3.20-$4.45, and clarified several points for observation downstream. To name a few:
- Q2 outside US (“OUS”) revenue increased 727% YoY to $6.4mm on strong order volume. US turnover up $7mm. We were seeking upside on this.
- Backlog expansion of 27% YoY to $353mm with ~500bps gross margin from newly-booked orders.
- Heavy retracement in share price across 2022 due to the broad selloff in equities. We were looking for the stock to break through key fibonacci levels [See, previous analysis: “Exhibit 5: Technical factors for VRAY”]..
- Revenue guidance revised to $83mm at the upper range with forecasted cash burn of ~$83mm.
To summarize what’s changed to support the buy thesis:
- Revised FY22 revenue guidance with management more confident on the lower end of range.
- Reversal in broad market positioning as equities and other risk assets catch a bid in the October/November roll.
- Backlog continues to grow, ending at $350mm for the third quarter, whilst asset turnover, inventory turnover ramp up.
- Supportive valuations backed by the increased in revenue guidance.
With that in mind, VRAY has since pushed through our suggest price range, followed up by a strong third quarter. Hence, we are now far more constructive on the stock. Net-net, we revise to a buy, and revise our suggested price range to $5.10-$7.55.
Broad Market Trends – Key macro points
Risk assets have caught a bid at the roll into November. Equity factors are thus key in gauging positioning within the latest snapback rally. Surprisingly, growth and momentum factors have lagged of late despite their high-beta status to the benchmark [Exhibit 1].
Broadly speaking softening Treasury yields and a weakening dollar index are chiefly responsible for the reversal in equities [Exhibit 3]. VRAY is scoring high on momentum [Exhibit 2] and so we’d urge investors to keep this in mind with respect to position/risk sizing, along with portfolio positioning for the stock, with momentum strategies pressured in H2 FY22.
Exhibit 1. US Risk Factor Premia performance
Data: Seeking Alpha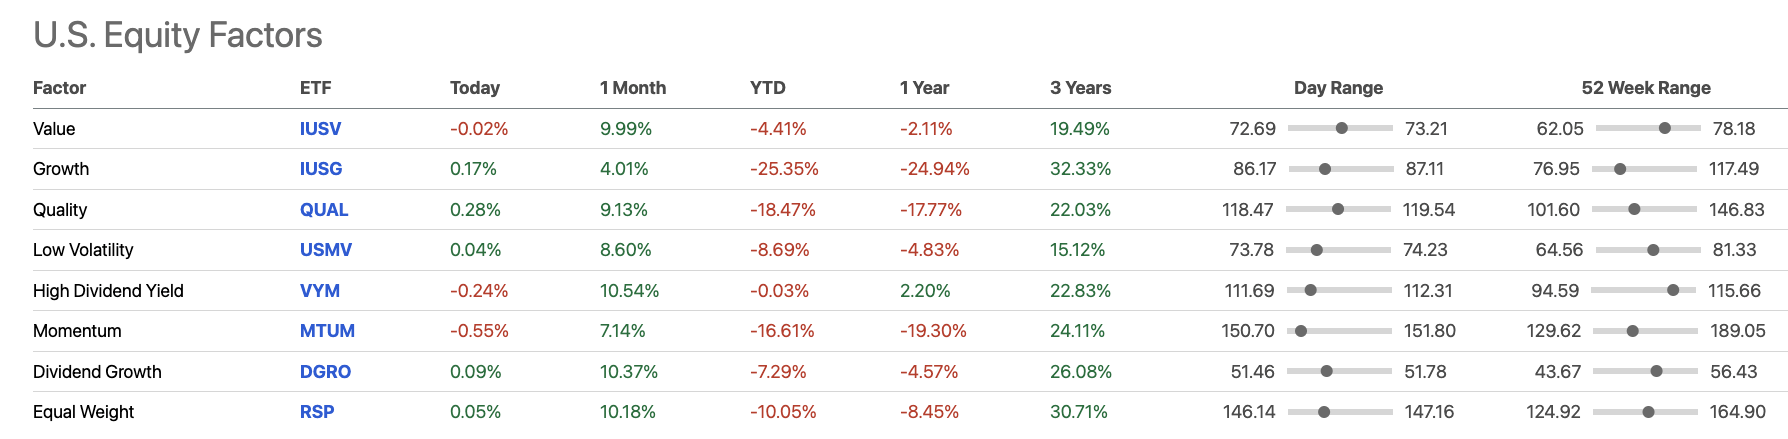
Exhibit 2. VRAY Factor Grades
Data: Seeking Alpha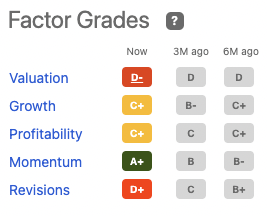
With the market’s risk appetite normalizing again, we’re more comfortable opening up our equity risk budget. Equity breadth is also narrowing with tighter spreads around the SPX quotes in the order book.
This is important data underpinning the change to our thesis on VRAY. We’d encourage investors to familiarize themselves with all of VRAY’s factor grades.
Exhibit 3. Weakening dollar index corresponding to positive equity inflows forming October/November snapback
Data: Updata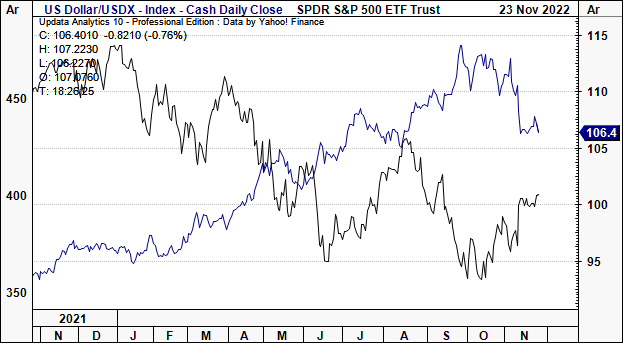
VRAY Q3 developments support re-rating
Switching to VRAY’s third quarter [reported on November 1], we’d like to point out several highlights. It was a strong quarter overall with YoY revenue growth to $26.5mm. Upsides were driven from a 48% growth in product revenue as sales volumes ramped up.
We’d also mention the 17% Q3 gross margin, again helped by product revenue and volumes. Management noted it aimed for 750-1,000bps gross margin liftoff in FY22 earlier this year. So far, it’s produced 725bps.
Moving down the P&L, OpEx was $28mm for the quarter versus $25mm the year prior. It pulled this down to a net loss of $0.14 per share, roughly in-line [Exhibit 4].
Exhibit 4. VRAY Q3 Results snapshot – robust delta from previous year
VRAY Q3 2022 results investor presentation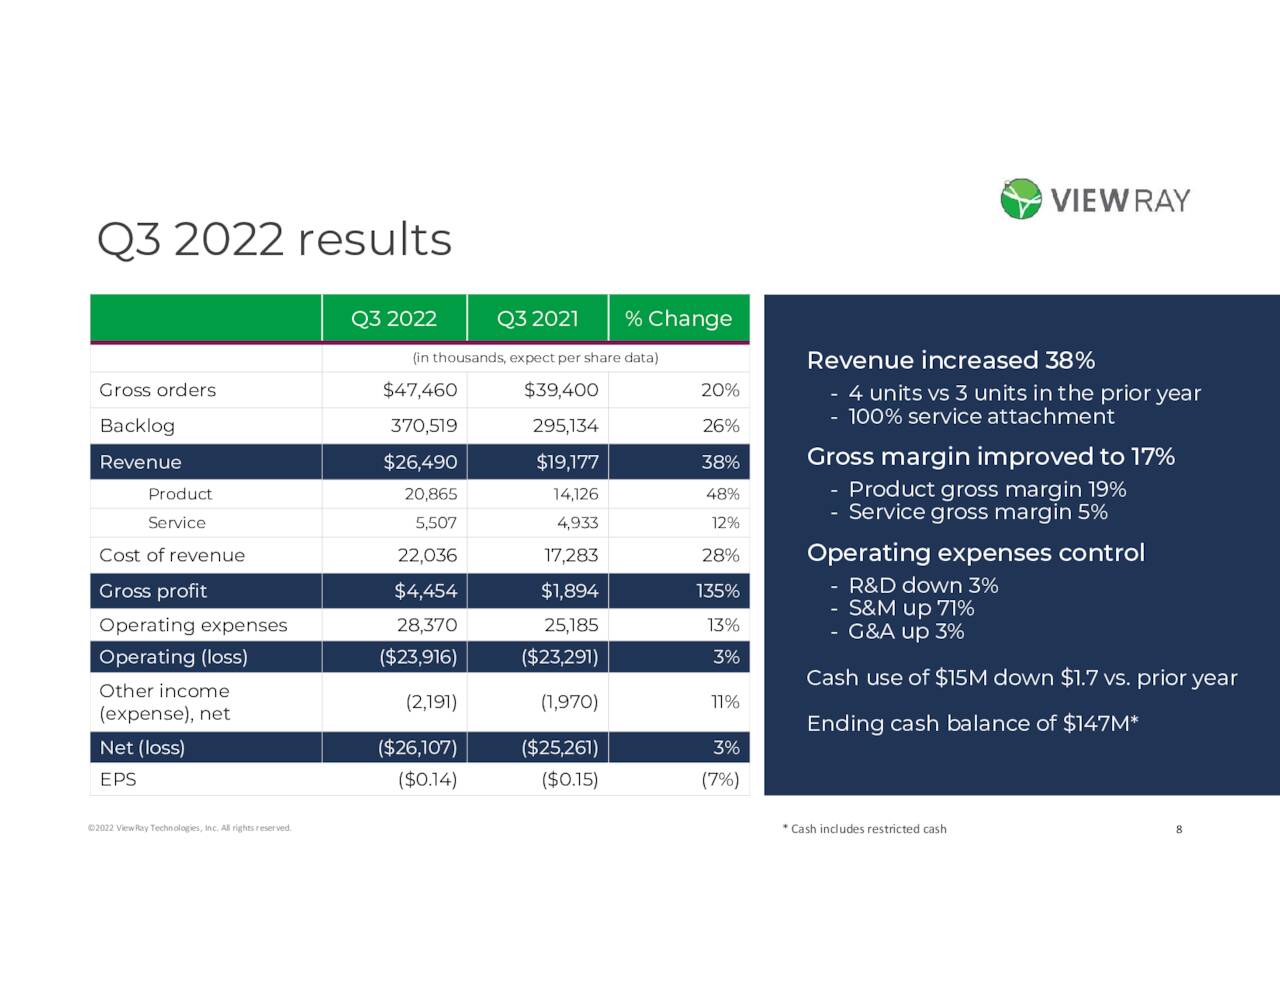
Diving deeper, we made the following observations:
- VRAY booked another 8 orders for the quarter, totalling >$47mm in total value. Last time, we concluded it booked 8 orders for Q2 FY22 as well, hence we were pleased to see this cadence in Q3 as well.
- Backlog increased by 26% compared to this time last year and ended at $370mm. Comparatively, it was 27% and $353mm last quarter respectively. We also cited in our last note that booked orders within the backlog had added another c500bps to gross margin, mainly due to timing effects. We anticipate a similar pull-through this time.
- We’d also point investors to the fact that VRAY continues driving up asset turnover, inventory turnover whilst reducing its cash conversion cycle. We’ve now got all 3 measures back at pre-pandemic levels. Inventory turnover reached back to highs of 2x, its asset base generated $0.30 from each dollar of revenue [Exhibit 5]. Essentially, this means less cash tied up in working capital, greater turns of inventory each year and greater economic profit from its asset base. These are positive growth levers that inflect positively on profitability, in our opinion.
Exhibit 5. Productivity and profitability turning upward beyond pre-pandemic levels.
Data: HB Insights, VRAY SEC Filings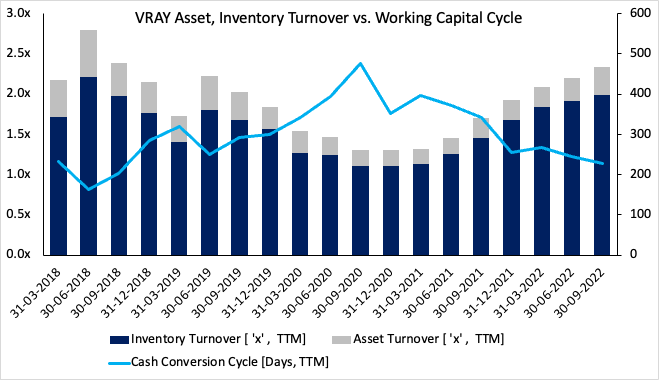
Guidance adjustment further justifies re-rating
Management’s updated revenue guidance is another factor confirming our bullish revision. It now sees $94-$104mm, implying a growth of 34-48% after adjusting the upper end of range.
It expects to use $78mm-$92mm in cash to achieve this revenue, also up from previous estimates [Exhibit 6].
Exhibit 6. VRAY FY22 revamped guidance
Data: VRAY Q3 Earnings presentation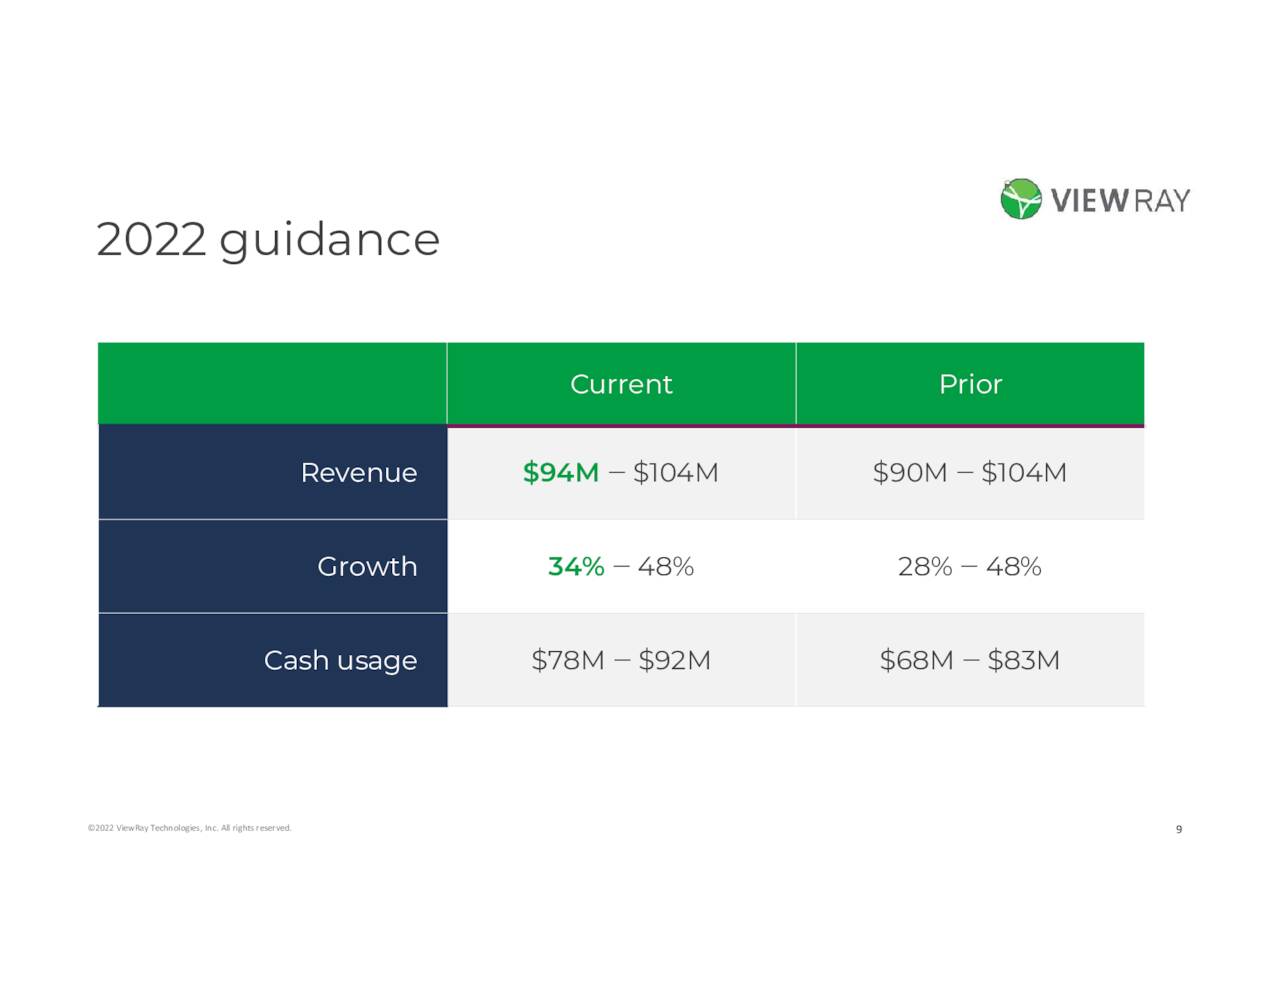
Our internal analysis puts VRAY ahead of its management’s guidance and projects $108mm in FY22 revenue [Exhibit 7]. We also see a reduction in core EBITDA losses each quarter into FY24, serving a good springboard for profitability.
At this run-rate, revenue growth of 26% and ~30% in FY23 and FY24 aren’t an unreasonable expectation by our estimate. We’re encouraged by these growth percentages. We base these assumptions from the sustained increase in VRAY’s backlog and booked orders of $370mm, plus eyeing a FY22 gross margin of 800-900bps.
Exhibit 7. VRAT forward estimates FY22-FY24′ with core EBITDA in light blue insert [Note: Core EBITDA estimates showing quarterly numbers only].
Data: HB Insights Estimates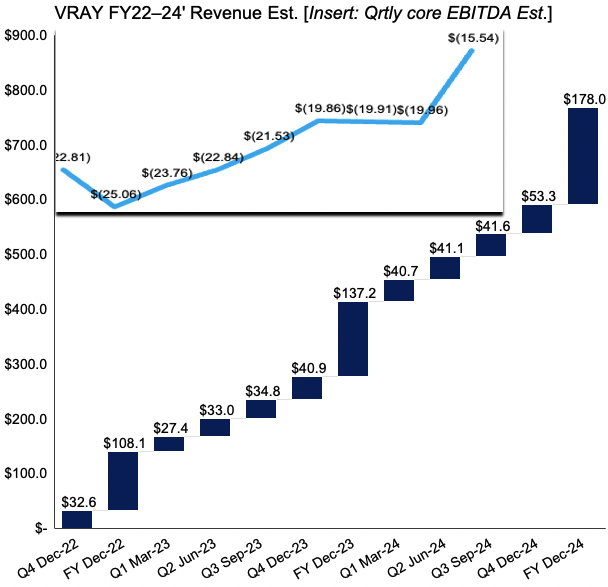
Valuation and technical factors
In the last report we saw VRAY priced fairly at $3.80 and suggested a price range of $3.20-$4.45. The stock’s pushed through these targets and is lifting to the resistance line shown below [Exhibit 8].
Consensus has VRAY priced at 8.3x forward sales, above the sector median 4.3x. We think the stock should be trading at or above its 5-year average of 9.9x sales [let’s say 10x]. It isn’t the same company it was 5-years ago, yet trades at multiples below that time.
We’d also remind investors of the revenue upsides discussed above, that will be heavily rewarded if they pull through. Rolling our FY22 sales estimates forward and applying the 10x multiple sets a price target of $5.96.
Repeating the process to FY23 derives a price objective of $7.55. The first of these targets is well supported with technical data, like that seen in Exhibit 8 below.
The scope of these upside targets confirms our buy thesis.
Exhibit 8. Upside target to $5.35 backed by robust fundamental data.
Data: Updata.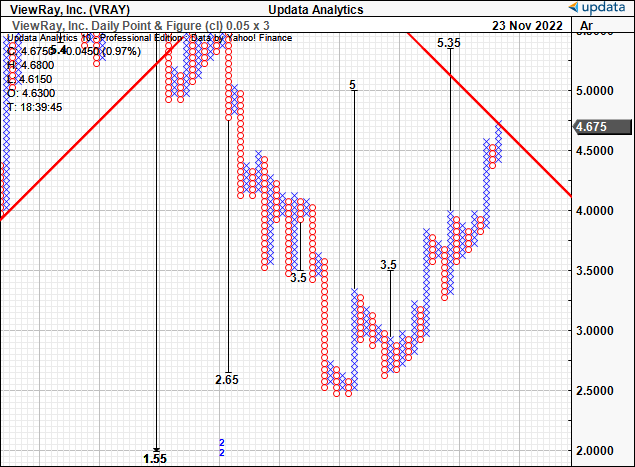
Presuming the stock did bottom in May 2022, it’s now spent 28 weeks rallying from that point. The 50DMA and 250DMA are set to cross to the upside. Last time we saw this, a 50week rally followed.
Tracing the fibs down from its 2-year high to the drawdown sees VRAY just crossing through 50% of the entire move. This corresponds to the 50DMA/250DMA cross, as seen. From this the next target is to $5.13 then $6.32. Consequently there’s good confluence around an initial target in the $5-$6 range from all accounts.
Data: Updata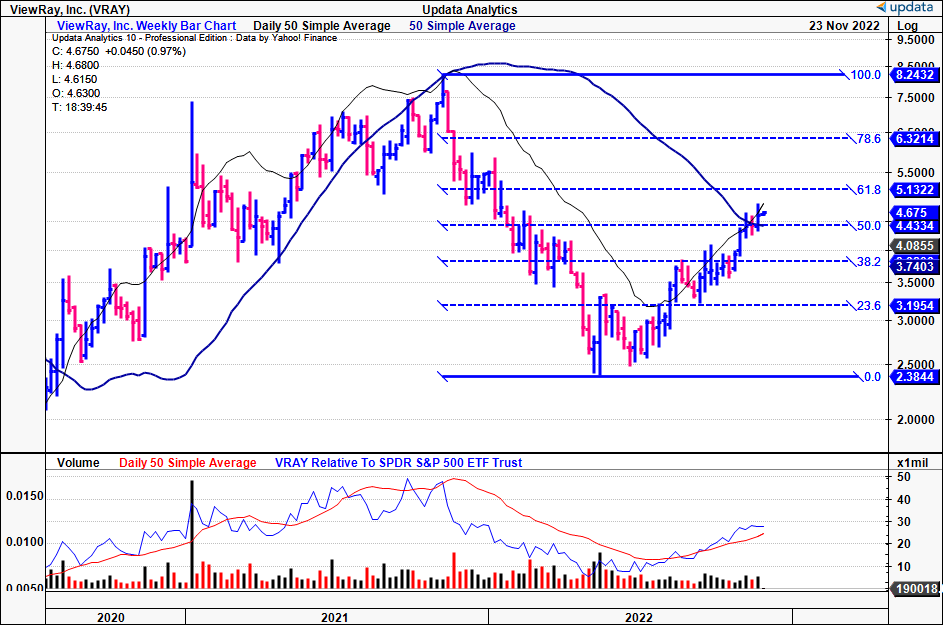
In short
Net-net, we revise our rating for VRAY to a buy, noting a blend of market, fundamental and technical factors supporting the change in thesis. New price range $5.10-$7.55.
Be the first to comment