

courtneyk
Sector and Industry Performance
As for the 1-month performance, the Financial Sector returned 8.13%, following Basic Materials and Industrials.
1-Month Performance of Sectors (Finviz)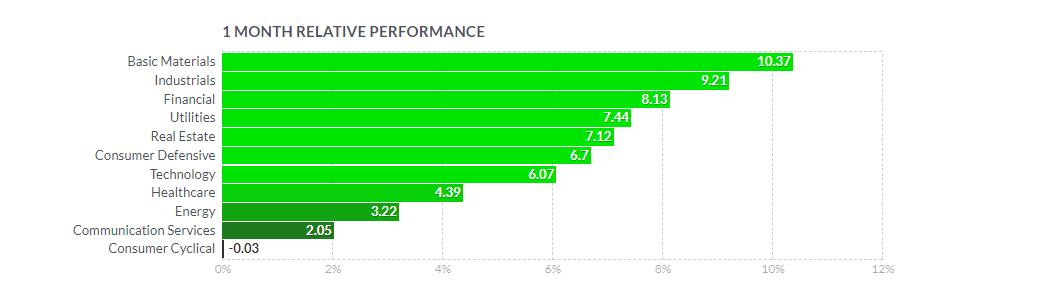
The 1-week return of 2.54% for the Financial Sector lagged far behind Utilities, on a similar level as Industrials, faring, however, much better than Technology.
1-Week Performance of Sectors (Finviz)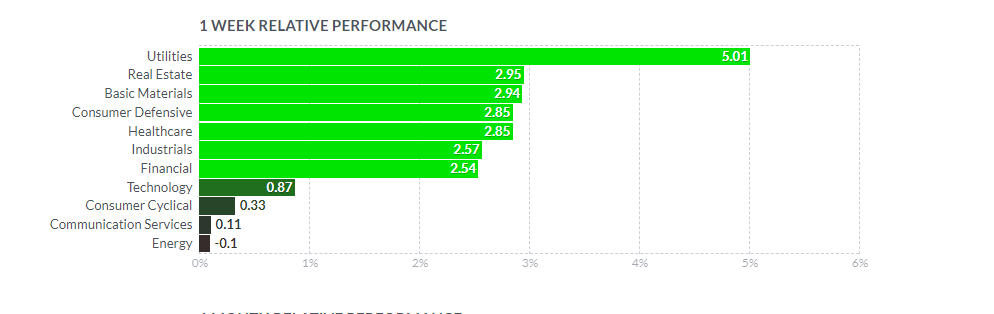
On the industry level, Asset Management, to which Victory Capital Holdings, Inc. (NASDAQ:VCTR) belongs, has not been really a leading Financial group on a 1-week basis with a return just above 2%.
1-Week Performance of Financial Industries (Finviz)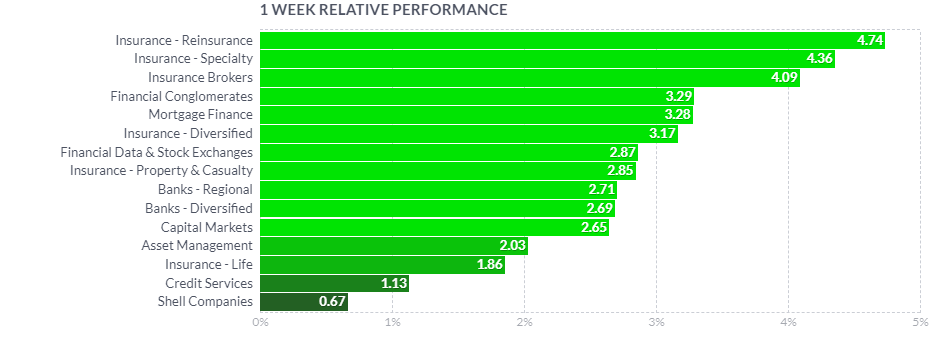
However, the group has had a better performance on monthly performance with 10.14%, versus the best-performing Mortgage Finance group which returned nearly 17%.
1-Month Performance of Financial Industries (Finviz)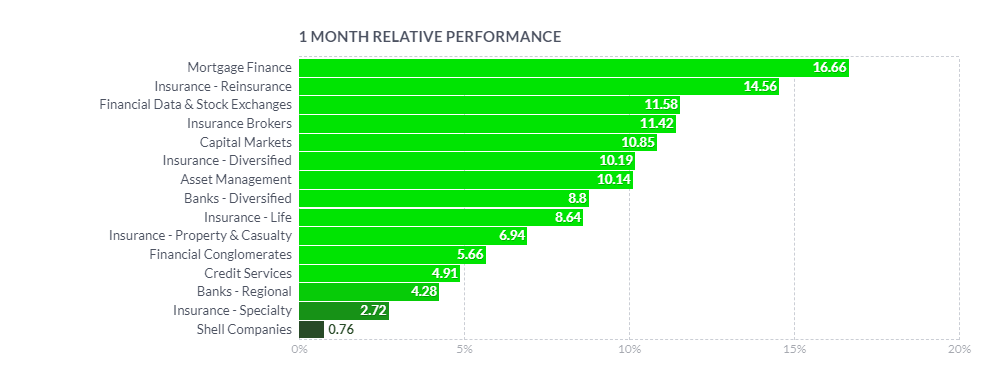
I want to underline that my approach is not pure top-down drilling down just following the highest returns. I choose well-performing sectors, but then I review the stocks manually and select those which in my opinion have been overlooked and have a high potential of being just at the beginning of an uptrend or a breakout. I have owned Victory Capital Holdings, Inc. since 2019 and have been monitoring it since. Therefore, I am glad I can cover it also here as a selected ticker resulting from my systematic stock selection process.
I will analyze Victory from a perspective of a number of technical analysis tools and show the screenshots on the monthly, weekly, and daily Heikin Ashi candles charts – each timeframe presented through two separate sets of indicators – which I will complement with a simplified daily Renko chart.
Explanation of My Technical Analysis Toolbox
The first chart setup (I will call it Chart 1) uses Bill William’s Alligator indicator and Awesome Oscillator, as well as Ichimoku Clouds and the On-Balance Volume indicator line. For fundamentals, I show also the quarterly revenue trend, which I use for quick visual triage.
The Alligator technical analysis tool uses three smoothed moving averages that are based on 13, 8, and 5 periods, called also Jaw (blue line), Teeth (red line), and Lips (green line), respectively. Due to the smoothing of each moving average, the Jaw makes the slowest turns and the Lips make the fastest turns. The Lips crossing down through the other lines signals a short opportunity while crossing upward signals a buying opportunity.
William’s Awesome Oscillator (AO) is a market momentum tool that visualizes a histogram of two moving averages, calculated on median prices of a recent number of periods compared to the momentum of a larger number of previous periods. If the AO histogram is crossing above the zero line, that’s indicative of bullish momentum. Conversely, when it crosses below zero, it may indicate bearish momentum.
As for the Ichimoku Cloud – I am not using a full set of lines of Ichimoku lines, only the Leading Spans A and B, whose crosses dictates the color of the cloud and whose individual lines provide levels of the strongest support and resistance lines. Ichimoku averages are plotted into the future, which in its own right provides a clearer picture but has no predictive powers.
On-Balance-Volume (OBV) indicator is a volume-based tool and is supposed to indicate the crowd sentiment about the price. OBV provides a running total of an asset’s trading volume and indicates whether this volume is flowing in or out, especially when viewed in divergence with the price action.
The second chart setting (Chart 2) uses 2 moving averages (10- and 50-period), volume, and volume’s 20-period average. On the screenshot from top to bottom, you will see the Composite Index Divergence Indicator (CIDI), which I learnt from the book of Constance Brown, as well as J. Welles Wilder’s Directional Movement Indicator (DMI). I also use MACD (Moving Average Convergence Divergence) which is well known to everybody: I seek crossovers of MACD and signal, as well as above/below the zero level.
CIDI comes from a combination of RSI with the Momentum indicator. For more literature, see Brown’s paper or read her book. CIDI has been developed to solve the problem of RSI not being able to show divergence. I personally use the CIDI’s crossover above and below its slow and fast-moving averages, as well as the position of the averages against each other.
As for DMI, I skip the ADX line because it doesn’t give me anything. Instead, I focus on the crossovers of the Positive Direction Indicator DI+ and Negative Direction Indicator DI-. When the DI+ is above DI-, the current price momentum is upwards. When the DI- is above DI+, the current price momentum is downwards.
On the use of Heikin Ashi candles and Renko boxes, I use them as tools for trend reversal and continuation identification. Renko charts do not have a time scale and they are built on price movements that must be big enough to create a new box or brick. Similar to Heikin Ashi, Renko charts filter the noise.
As you might have guessed, my focus is on identifying the trend reversal and filtering the noise that allows the position continuation without the risk of too many false signals. However, I will be honest with you – I am not showing here all the technical indicators that I use for screening and analysis since they belong to my secret sauce.
The Long-Term Trend
For the long-term trend analysis, I use monthly charts. See below Chart 1, which shows at least five technical signals that Victory Capital has most probably re-entered the uptrend. The first signal is rendered by the strong green Heikin Ashi candle for November. Second, the candle opened above the trend line, which I drew from the top of the November 2021 candle and which was strongly penetrated by the upper wick of the October 2022 candle. The third signal resides in the restart of rising bars of the monthly Awesome Indicator, following a sharp uptick in the On-Balance-Volume (signal nr 4). Last but not least, Alligator’s Lips (green) and Teeth (red) have never dived below the Jaw (blue line) and the Lips line is on the verge of crossing the Teeth’s one. Ichimoku Cloud, ever since it started (given the relatively short trading history of Victory Capital), has remained green. A strong support line seems to have been created between $25 and $26.
Monthly Chart 1 (TradingView)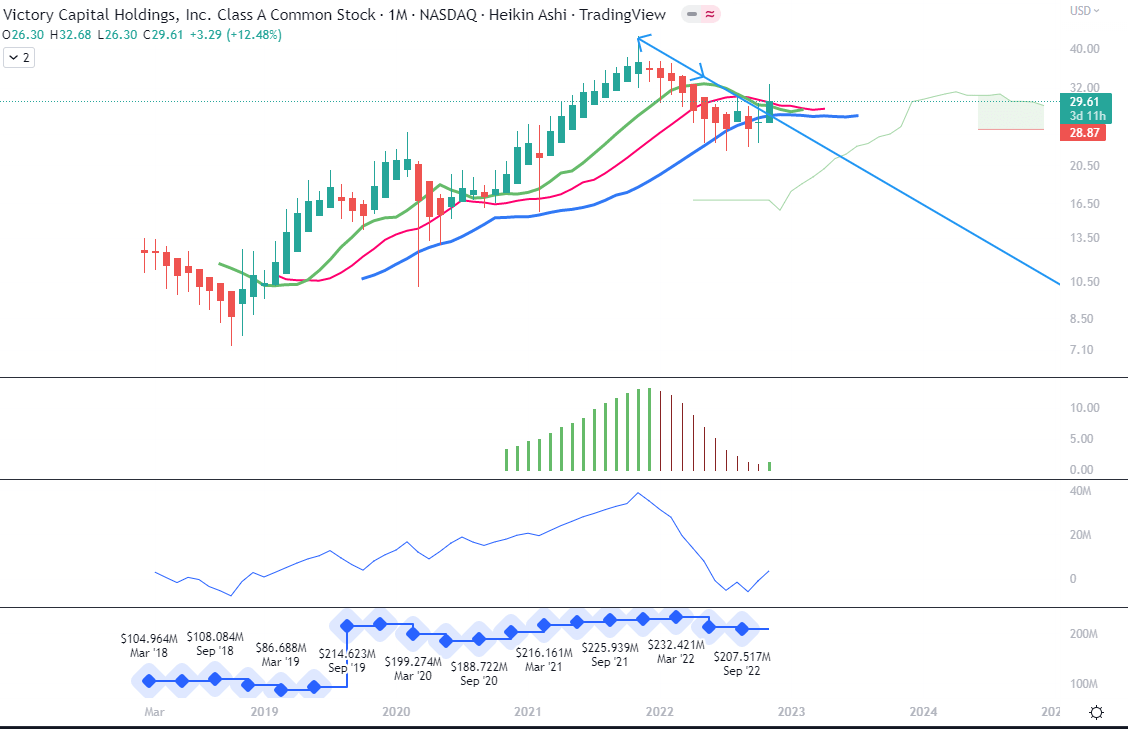
On Chart 2, without repeating my reference to the Heikin Ashi candles and trend line, we can appreciate that the fast 10-month Moving Average is above the slow 50-month MA and that the November candle has opened above it. We can also see that the positive volume for October and November has been above the average. CIDI has crossed above the fast green average and is heading towards the slow orange one. The monthly Positive Direction Indicator DI+ has crossed above Negative Direction Indicator DI-, while MACD, although below its signals, has flattened and possibly heading to cross the signal within the next 1-2 months.
Monthly Chart 2 (TradingView)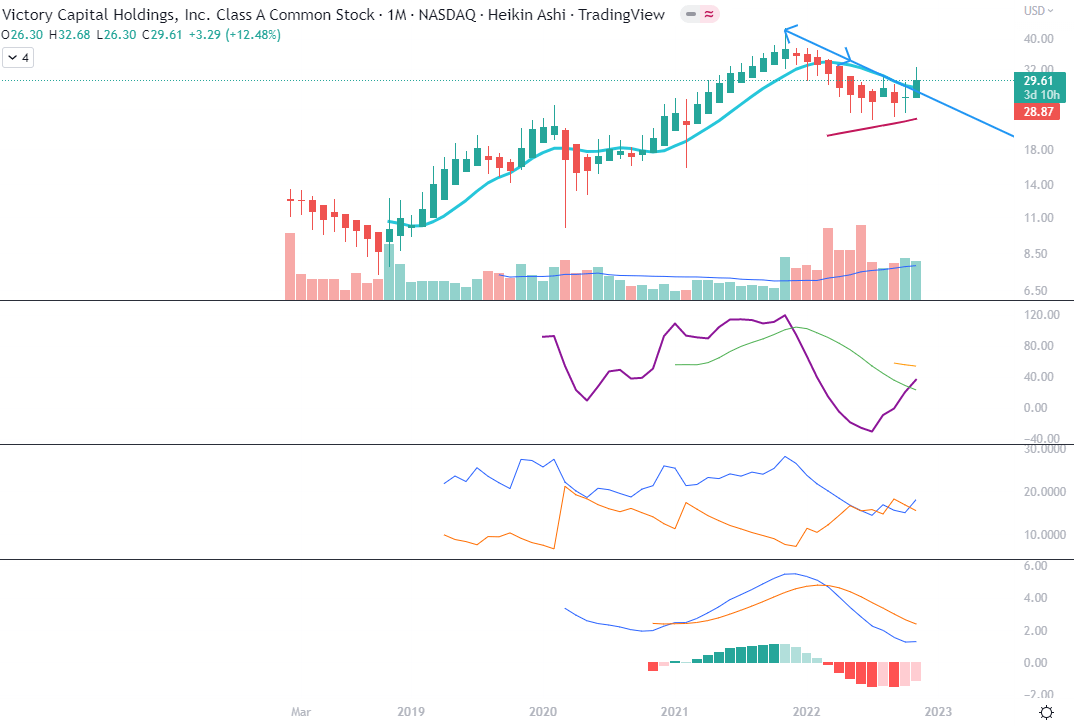
The Mid-Term Trend
As we can notice on Chart 1, the Alligator’s Lips and Teeth lines are well above the Jaw line and their orientation is from slightly flat to upward. There is quite a strong resistance line on the edge of the current red Ichimoku Cloud at the level of $32.70. The Cloud has also narrowed recently to possibly switch color to green within the coming weeks. We can also see that AO has crossed the zero line, indicating the start of medium-term positive price momentum. The red candle for the last week signals a pullback that could go to $26.20, which is the lowest edge of the current red Cloud.
Weekly Chart 1 (TradingView)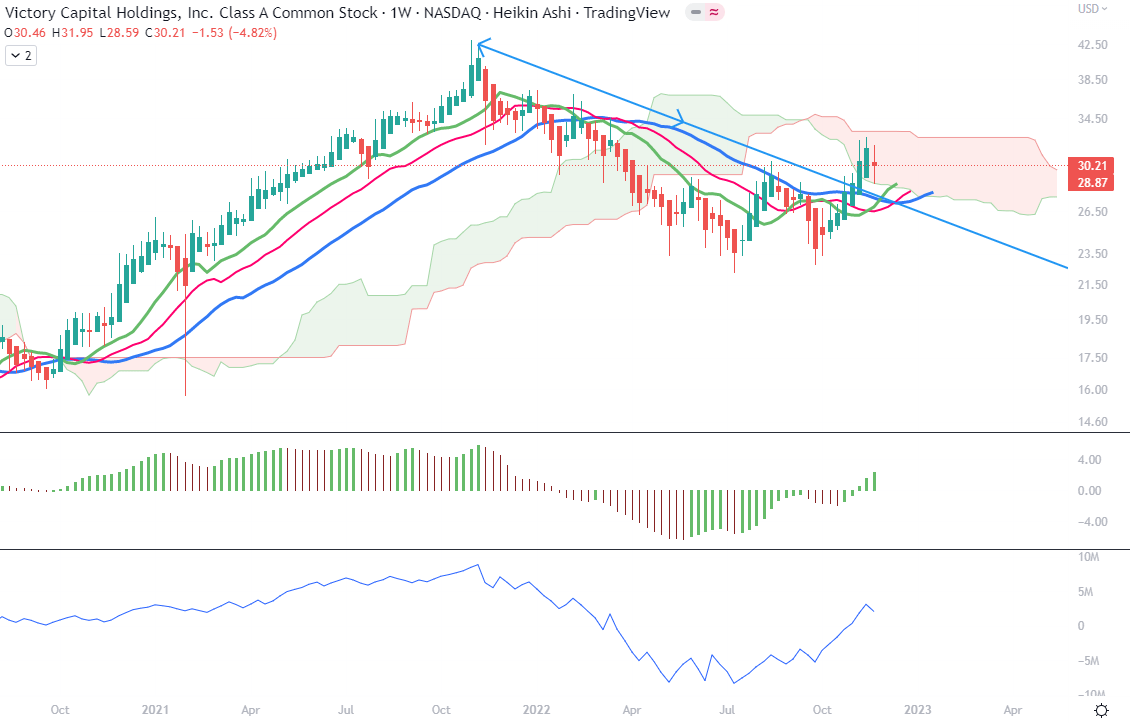
On Chart 2, we can appreciate that 10-week MA is approaching the 50-week MA in a slightly parallel way. I believe that the pullback could last around 3-4 weeks. My hope would be to see both MACD and its signal get above the zero line by the end of the year, as well as to see both CIDI and DI+ recover the upward movement after the necessary slowdown.
Weekly Chart 2 (TradingView)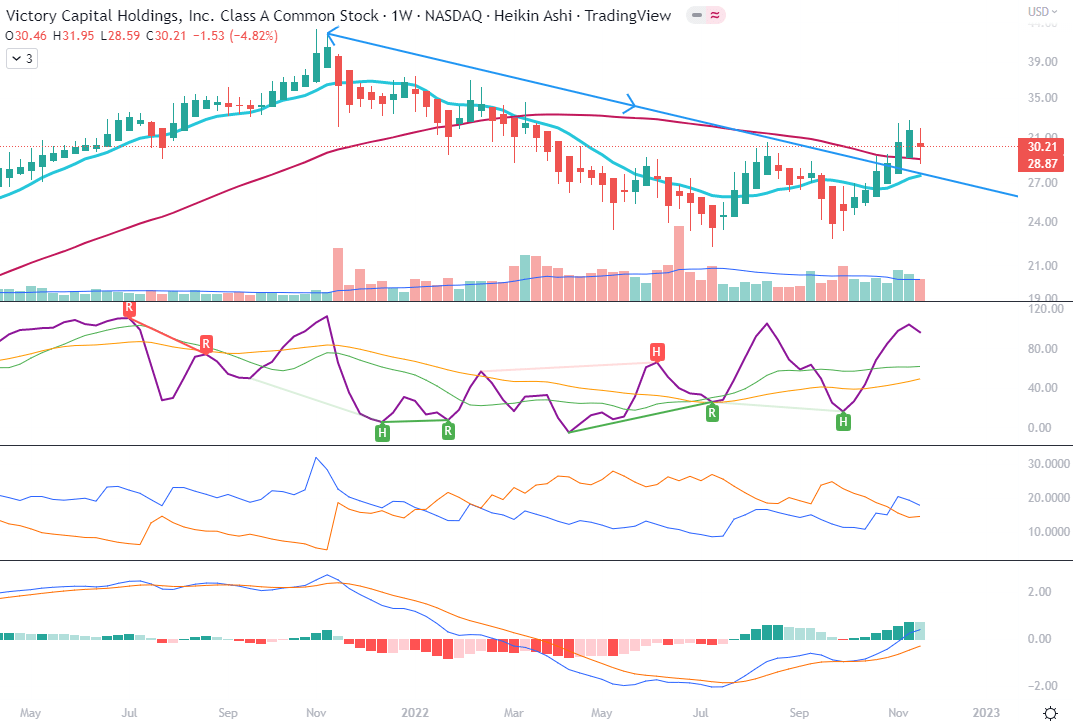
The Short-Term Trend
As we can see on Chart 1, the price of Victory has pulled back in recent days despite positive reported earnings at the beginning of November. All lines of the Alligator as well as AO are oriented downwards, especially after the last two trading days around Thanksgiving. We might expect the price to drop to $26.80, which I marked with a red horizontal line, or even touch upon $25.70.
Daily Chart 1 (TradingView)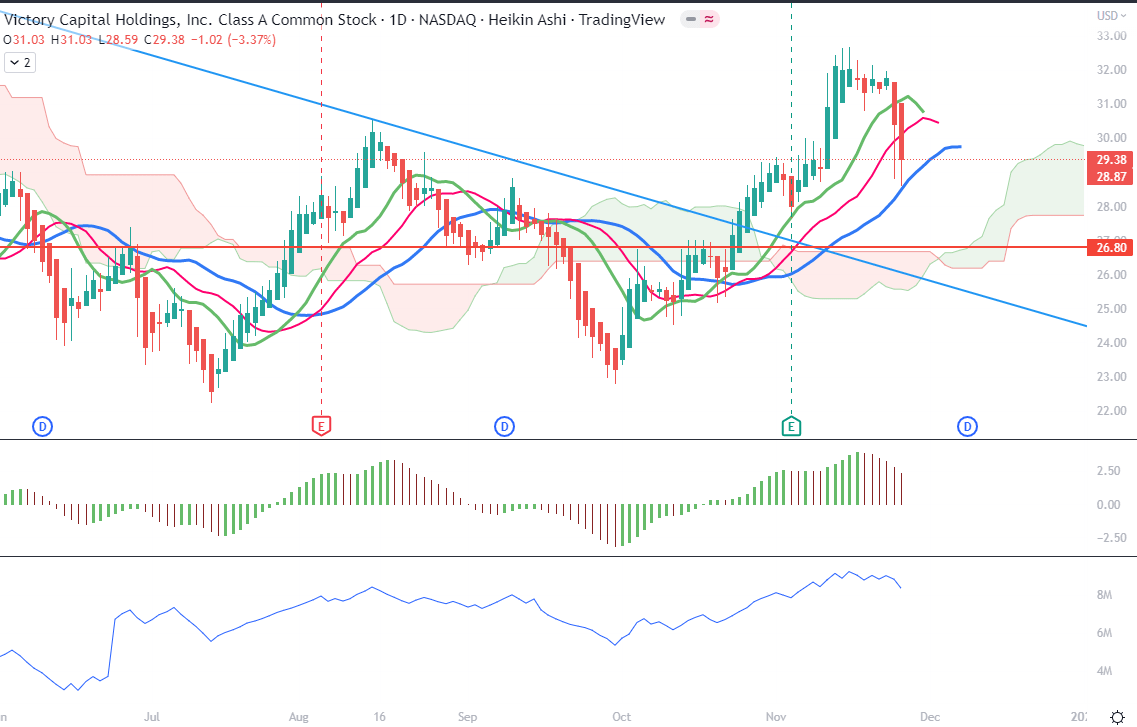
As for the picture on chart 2, we can see a similar downward projection from all the technical indicators on his frame. A good signal will be if the price bounces from the 50-day MA. If we zoom out on this frame, we can appreciate that the 50-MA has flattened and marked a higher low with its dive below the horizontal line that I drew. We need patience for this pullback to develop.
Daily Chart 2 (TradingView)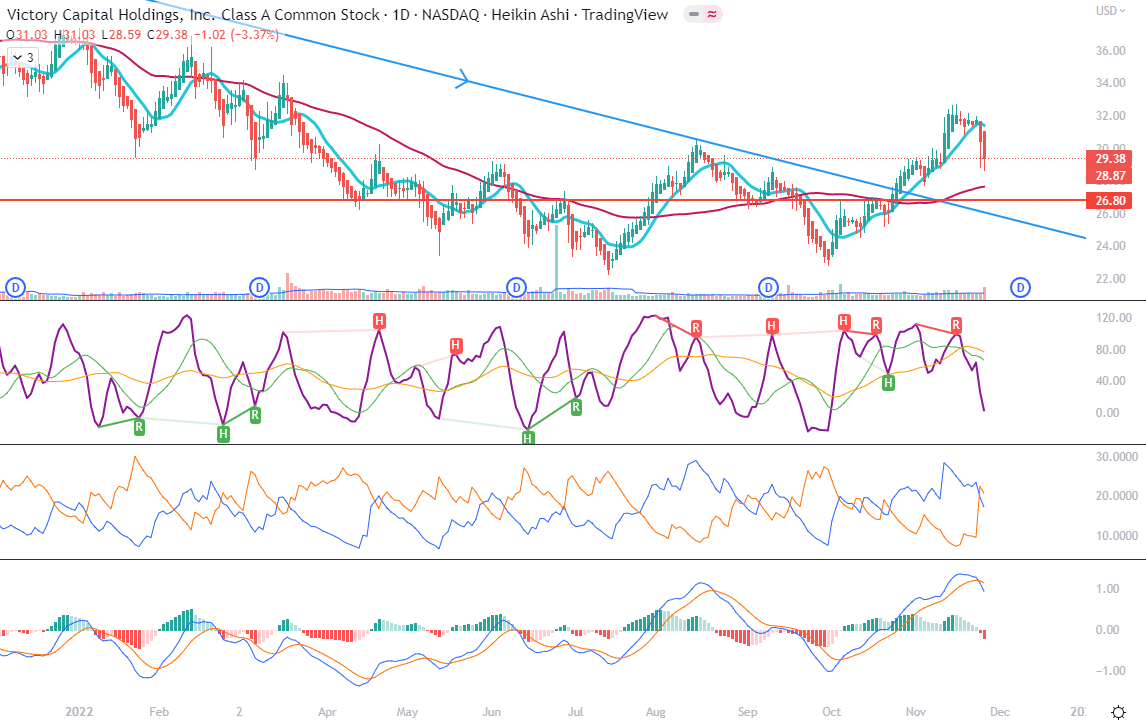
Price Momentum
The daily Renko chart presents the important junction of the moving averages which may resolve both ways. However, by the looks of MACD developing above the zero line, the price momentum looks positive but calls for attention.
Daily Renko chart with MACD (TradingView)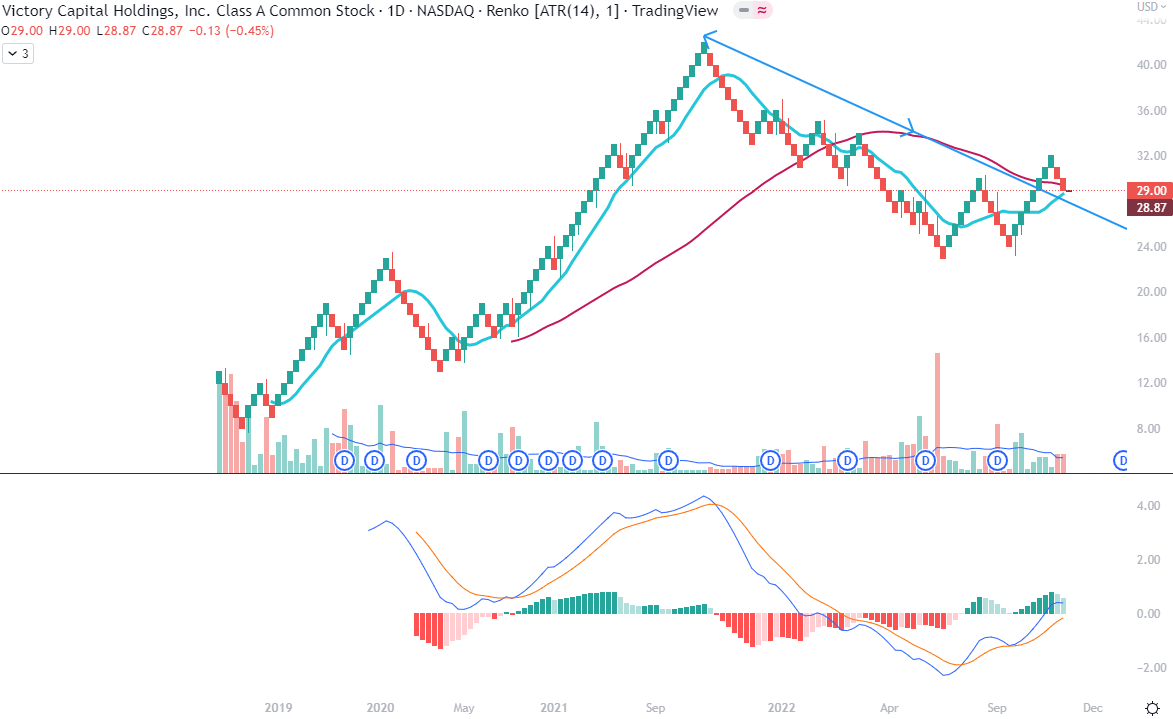
Fundamentally speaking…
Victory is a $1.98B market cap, $147.3 B Asset Under Management investment management company, headquartered in San Antonio, Texas. UAM has gone down from $183.7B at the end of FY 2021, which in itself is not a bad thing or a surprise in the recent market. Victory has been digesting for the three quarters of 2022 the three acquisitions which they made in 2021 (USAA, New Energy Capital, and WestEnd Advisors). They had very good results for 2021, growing revenue for 2021 by 15% in comparison to 2020, with a CAGR of 29% between 2018 and 20121, and growing GAAP Earnings Per Share by 30%, compared to 2020, with a CAGR of 61%. They have also won 9th place in the Fortune 100 ranking of the fastest-growing companies.
Q4 2021 Presentation – Highlights of 2021 (Seeking Alpha)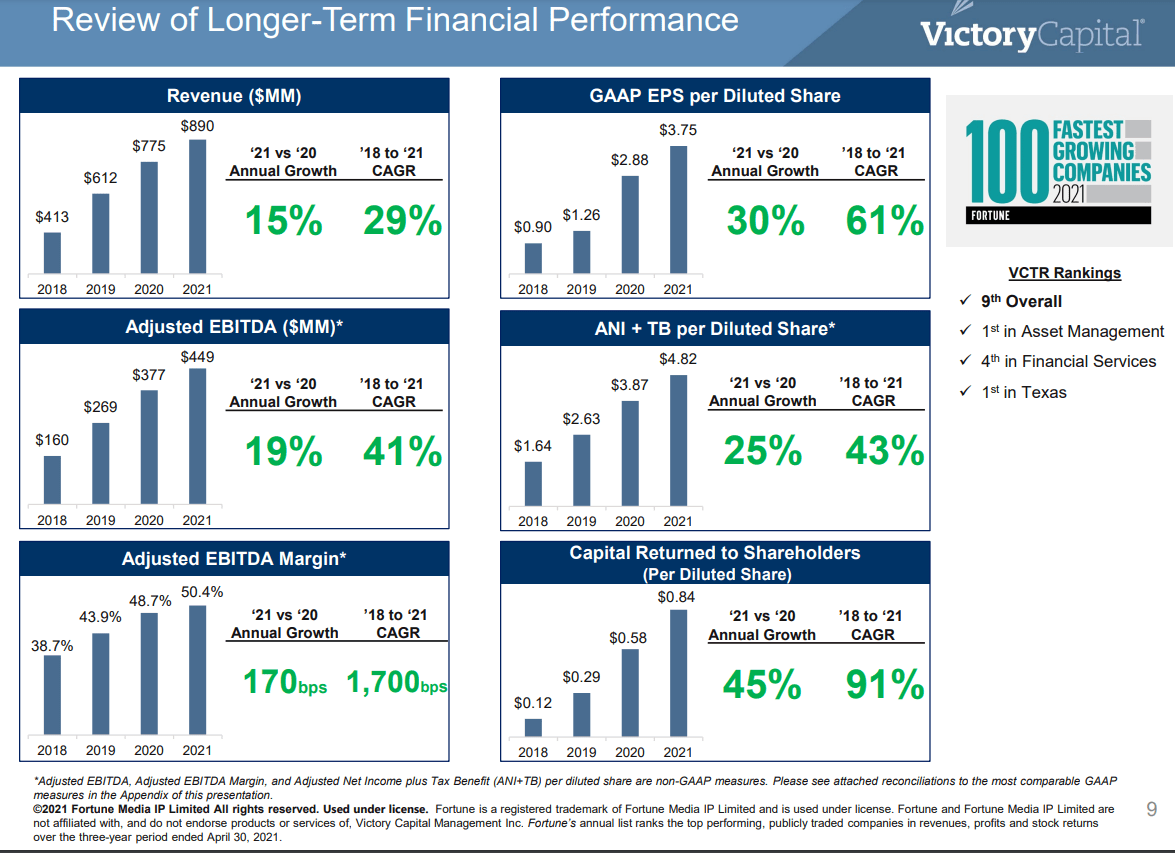
For the 2022 YTD, it is important to refer to their capital allocation decision to rather buy back stock (Q3 was the record amount ever since IPO), deemed to be trading at a discount, than invest into new acquisitions or pay more debt, although they have paid a lot of it down, too. In the words of CEO David Brown, they want to have a balance sheet where they can do an acquisition, so they keep powder dry and ready for when the market gets ripe for M&A, especially in the fixed income assets, given how much money has flowed out from these assets. Management also considers that they can afford the buybacks and maintenance of the debt thanks to the low cost of debt that they locked in. For the Q3, reported on November 3, the gross flows were up 20% YoY to Q3 2021, attaining $26.8 B, while maintaining an enviable Adjusted EBITDA margin of 50% for the quarter, and 49.6% YTD.
At the end of September, Victory had 52 mutual funds and ETFs that enjoyed four- or five-star overall ratings from Morningstar, and those funds account for more than two-thirds of Victory’s assets under management (“AUM”) and mutual funds and exchange-traded funds (“ETFs”). The cash dividend was maintained at $0.25 per share for the current quarter (NB. the 47% growth of the dividend in 2021 alone from $0.17 to $0.25 per share) and represents an additional $17.4 million of capital return to shareholders.
Conclusions
I feel positive about both the financial situation and outlook for Victory Capital Holdings, Inc., given their readiness for making strategic new M&A. Timed share buybacks (including shares withheld for the stock options) have probably helped to maintain the share price and increase the return to the remaining shareholders. I do see a fundamental catalyst for Victory Capital Holdings, Inc. once they go more for asset shopping, and in the meantime, you can lock in the dividend yield of 3.46%. I will consider adding to my VCTR position once I have some cash available.
Be the first to comment