

simoncarter
Corporate Finance Institute
(This article was co-produced with Hoya Capital Real Estate)
Introduction
Momentum is one of those factors investors look at as a means of beating the “market”. If one defines the market as the S&P 500 Index or the Russell 3000 Index, owning ETFs investing based on either index naturally cannot beat the “market”. While comparing non-factor and momentum-focused ETFs might indicate the strategy works, what does actual research show. Here are some answers.
Defining momentum investing
I start by saying how it differs from trend following.
quant-investing.com
One definition of Momentum Investing is:
Momentum investing involves going long on stocks, futures, market exchange-traded funds, or any financial instrument showing upward-trending prices and short the respective assets with downward-trending prices. Momentum investing holds that trends can persist for some time and that it’s possible to profit by staying with a trend until its conclusion, no matter how long that may be.
Source: investopedia.com
Of course, the only question that matters is does it work or is it just a matter of luck when it appears to be successful? A 1993 study published in the Journal of Finance documented how buying recent winners and selling recent losers generated significantly higher near-term returns than the overall stock market. The second article linked goes into this, plus more recent studies. The bottom line: it works, but exactly why is still not adequately known. The third article does provide guidance when it works best:
- Momentum investing is an investment strategy that rides the inertia of recent stock price movements.
- Research on momentum investing shows that the last three to 12 months of a stock’s activity is a good indicator of the next three to 12 months of activity.
- Momentum investing works best when the market is showing a clear direction, either up or down.
Source: businessinsider.com
The Corporate Finance Institute relates possible reasons it works:
One hypothesis states that investors bear a significant risk when implementing a momentum investing strategy. Potentially high returns are the reward that counterbalances that risk. Another hypothesis suggests that momentum investors are leveraging the behavioral weaknesses of other investors, such as the tendency to “follow the herd”, also known as the “herd mentality bias”.
Source: corporatefinanceinstitute.com
They also give examples of technical tools that can be used in conjunction with momentum investing, such as trend lines and moving averages. Read the fourth article link for more examples.
Some articles worth checking out on the subject that I reviewed for this article include:
This article focuses on a small, less followed momentum ETF, the Vanguard U.S. Momentum Factor ETF (BATS:VFMO), and the larger, more popular iShares MSCI USA Momentum Factor ETF (BATS:MTUM). As is the case here, the ETF with the most AUM is not always the best for investors!
Vanguard U.S. Momentum Factor ETF review
Seeking Alpha describes this ETF as:
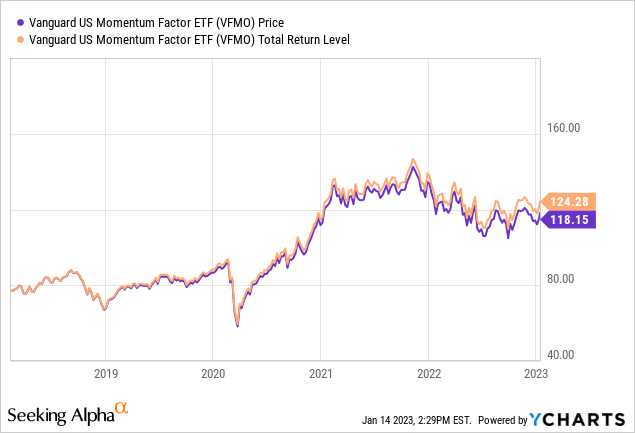
The investment seeks to provide long-term capital appreciation by investing in stocks with strong recent performance as determined by the advisor. The fund invests primarily in U.S. common stocks with the potential to generate higher returns relative to the broad U.S. equity market by investing in stocks with strong recent performance as determined by the advisor. VFMO started in 2018.
Source: seekingalpha.com VFMO
VFMO has $275m in AUM and provides a 1.66% TTM yield to investors. Vanguard charges 13bps in fees. Unlike the other ETF reviewed, VFMO benchmarks against a standard, not a Momentum index: the Russell 3000 TR Index. Vanguard defined their Momentum factor as:
The Momentum factor is measured by total returns from month T-12 to month T-1, total returns from month T-7 to month T-1, and the intercept from a 1-year regression of stock returns on their regional benchmark.
Source: investor.vanguard.com factor
VFMO holdings review
The first chart shows that though they benchmark against the R3000 Index, they definitely do not invest based on its market-size allocations.
Vanguard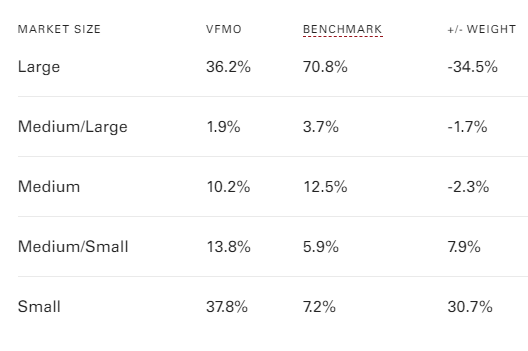
The sector allocations again show the independence of the ETF from the R3000 Index.
Vanguard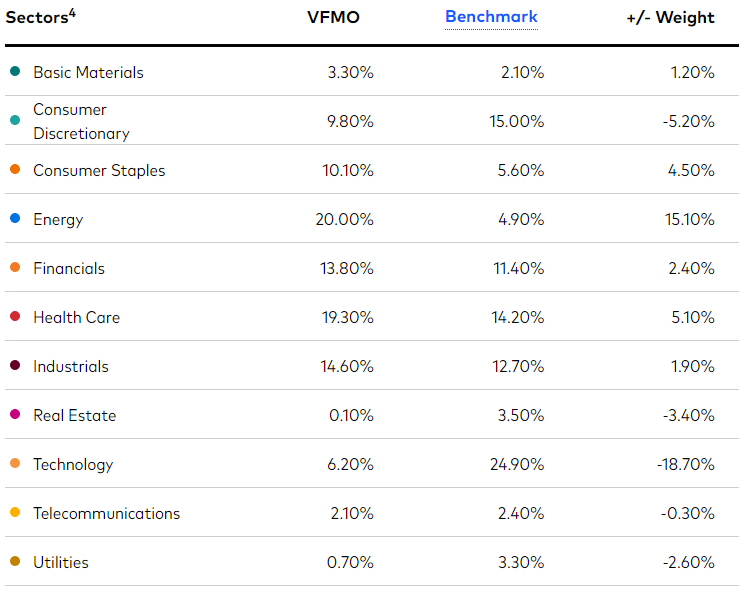
Top holdings
Vanguard; compiled by Author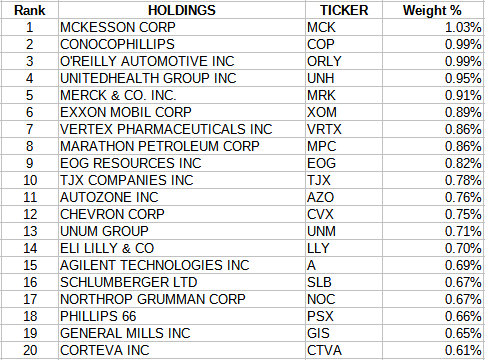
VFMO currently holds just under 700 of the 3000 stocks in the comparison index. The Top 20 account for 16% of the portfolio; the smallest 100 positions total under 2% of the portfolio.
VFMO distribution review
VFMO DVDs (Seeking Alpha)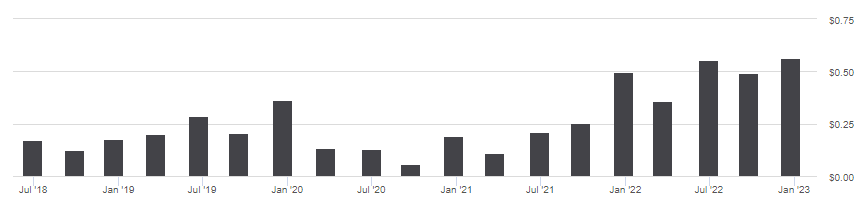
Payouts have varied over time, with a nice boost recently. I suspect if past data was easily available, there would be a close correlation to sector allocation and the amount of the distribution. Even so, the current TTM yield is only 1.66%. Seeking Alpha gives this results a “B” grade.
VFMO scorecard (Seeking Alpha)
iShares MSCI USA Momentum Factor ETF review
Seeking Alpha describes this ETF as:
The fund invests in momentum stocks of companies across diversified market capitalization. It seeks to track the performance of the MSCI USA Momentum SR Variant Index. The index consists of stocks exhibiting relatively higher momentum characteristics than the traditional market capitalization-weighted parent index. MTUM started in 2013.
Source: seekingalpha.com MTUM
MTUM dwarfs over VFMO with over $12b in AUM. Fees (15bps) and yield (1.79%) are close to the other ETF. Unlike VFMO, MTUM both invests and benchmarks against its index, which the provider describes as:
The MSCI USA Momentum SR Variant Index aims to reflect the performance of the MSCI USA Momentum Index, wherein all changes driven by the index rebalances of the MSCI USA Momentum Index are distributed over three days leading into the rebalancing effective date. The MSCI USA Momentum is constructed and rebalanced according to the MSCI Momentum Indexes Methodology. The MSCI Momentum Indexes aim to reflect the performance of the Momentum factor with a simple and transparent methodology while maintaining reasonably high investment capacity and liquidity of constituent companies, with moderate Index turnover.
Source: msci.com Index
The Index framework was defined as:
The MSCI USA Momentum SR Variant Index is constructed by staggering the changes in securities’ number of shares in the MSCI USA Momentum Index due to rebalancing, in equal proportion over three days: T-2, T-1 and T (where T, is the effective date of the rebalancing of MSCI USA Momentum Index). MSCI USA Momentum Index is rebalanced by first determining a 6-month and 12-month standardized risk adjusted momentum value for each stock in the MSCI USA Index by adjusting stock’s recent 12-month and 6-month excess local price performance using its volatility and standardizing the result. Standardized 6-month and 12 month risk adjusted momentum values are then combined and standardized again to arrive at momentum score. A fixed number of securities with the highest momentum scores are included in MSCI USA Momentum Index, generally covering about 30% of the parent index market cap. Constituents are weighted by the product of their momentum score and their market cap. Constituent weights for the MSCI USA Momentum Indexes are then capped. The index is rebalanced semiannually. In addition, ad hoc rebalancing may occur, triggered by spikes in market volatility.
Source: msci.com Index
Data showed that this index outperformed the MSCI USA Index by 190bps annually since 2002, though the extra risk resulted in similar Sharpe ratios.
MTUM holdings review
Along with the MTUM sector allocation, I compare those to the MSCI USA Index allocations to see the effect momentum screening had.
multiple sites; compiled by Author.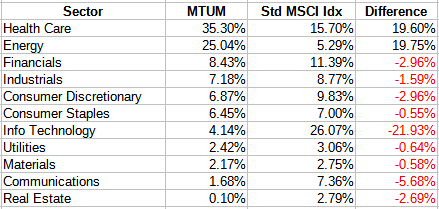
There are three major shifts: into Health Care and Energy; out of Technology. This resulted in the following stocks being the top holdings.
ishares.com; compiled by Author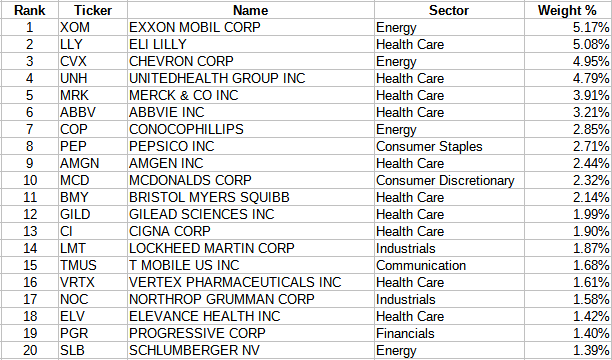
With only 129 stocks, MTUM is much more concentrated than VFMO, with the Top 20 almost 55% of the portfolio. MTUM also holds 112 contracts in the S&P 500 Emini futures contract, expiring in March.
MTUM distribution review
MTUM DVDs (Seeking Alpha)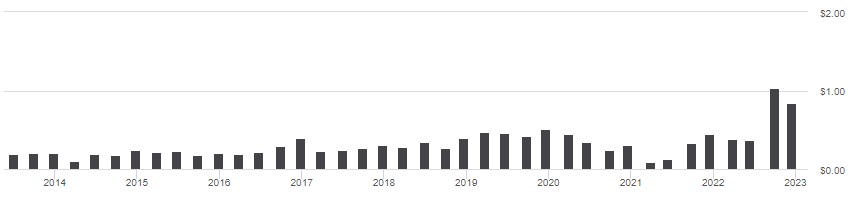
We see the same bump up in payouts in 2022, though the last one for the year is down some. Seeking Alpha graded MTUM as a “B+”.
MTUM scorecard (Seeking Alpha)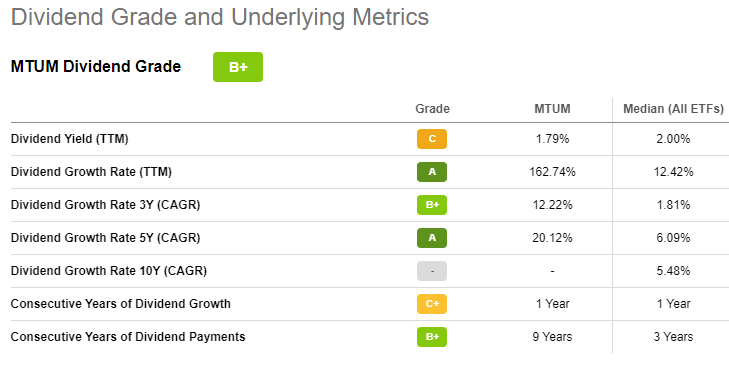
Comparing the four ETFs
Along with the two momentum ETFs reviewed, I include here two that represent what I believe are ones invested based on the non-momentum equivalent index. I picked the iShares Russell 3000 ETF (IWV) for VFMO and the SPDR S&P 500 Trust ETF (SPY) for MTUM as no US-based ETF followed the MSCI USA Index and that index seem to match up well with the S&P 500 Index.
First is the Vanguard Style box comparison.
Style Boxes (Vanguard)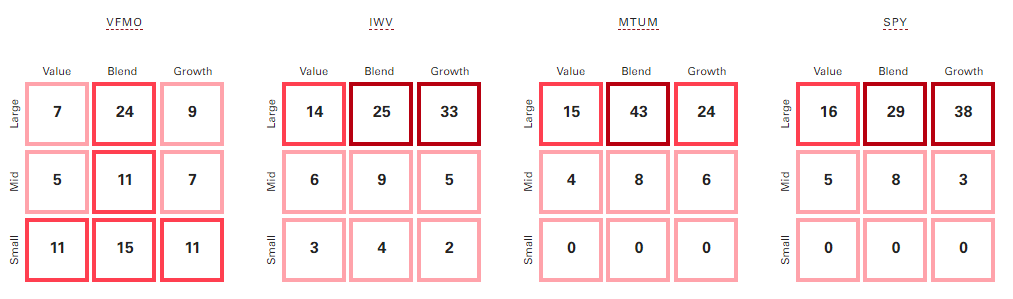
VFMO is more both Value and Small-Cap than IWV; MTUM align more closely than the other pair. Vanguard also provides some basic equity numbers.
Factors (Vanguard)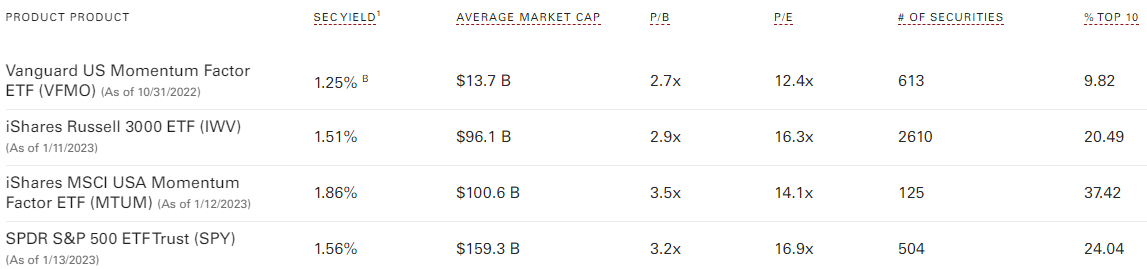
The sector allocation differences line-up well with those I did against the indices used by VFMO and MTUM, meaning to me the ETF comparison shown next has some validity, and answers the real questions investor want to know: Did a momentum strategy outperform an equivalent basic ETF?
Portfolio Visualizer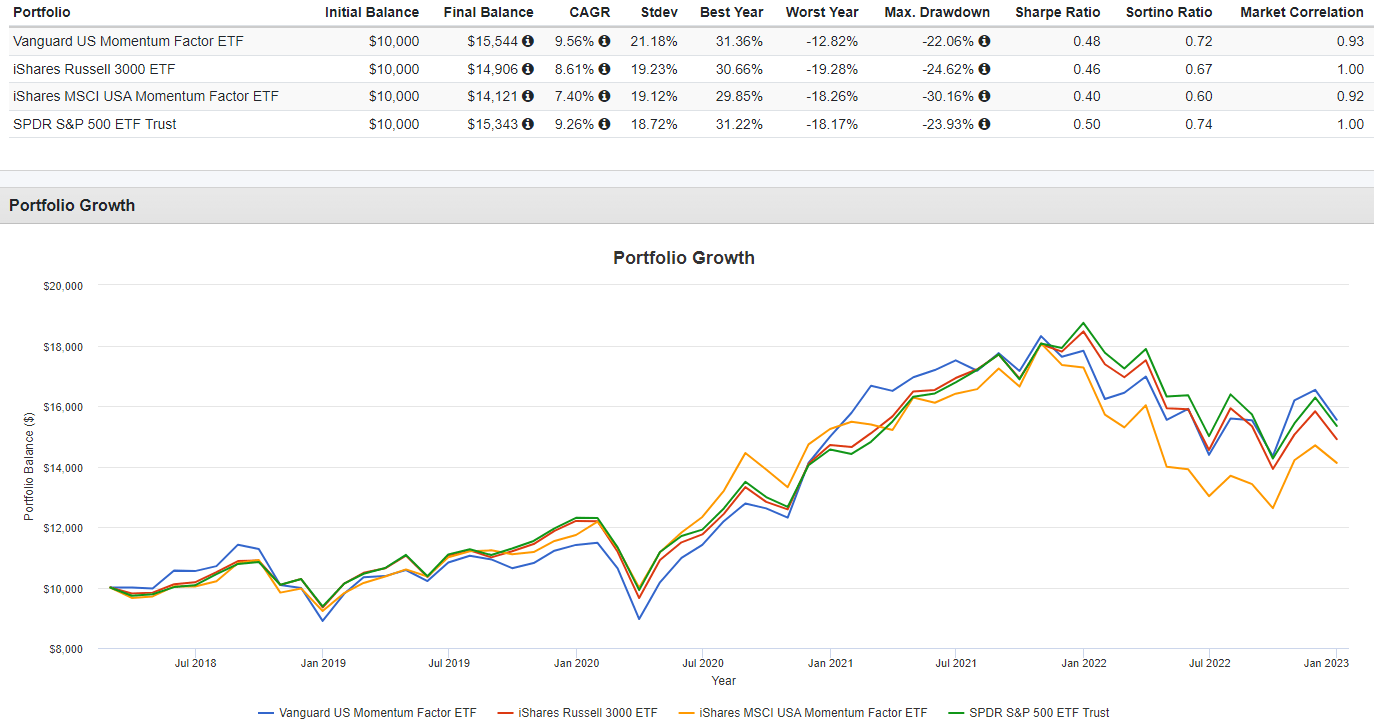
This is how to interpret the above data.
- VFMO has been better for investors than MTUM as measured by CAGR and both risk ratios.
- While VFMO outperformed its base ETF, MTUM failed to do so against SPY.
- VFMO had a better CAGR than SPY too, but lower risk ratios due to it having the highest StdDev of the four ETFs.
The next set of data shows the best strategy, based on monthly data, was constantly flipping.
Portfolio Visualizer; compiled by Author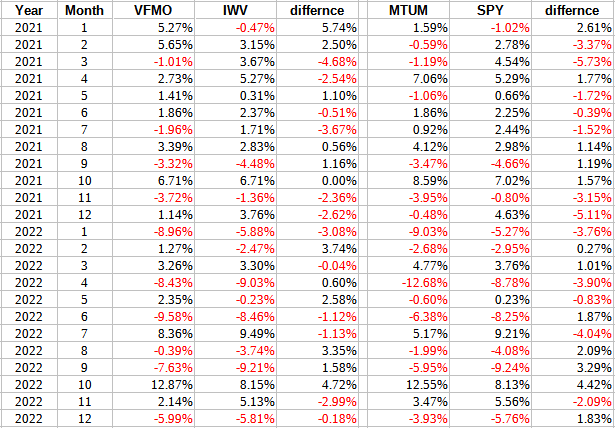
A positive difference mean the momentum ETF was better. Looking at all the monthly data back to 2018, both momentum ETFs “won” 28 out of 58 months, under 50% of the time.
Seeking Alpha evaluations
Seeking Alpha grades and ranks all US ETF on multiple factors; plus providing how the Quant system and Seeking Alpha authors rate each one.
Seeking Alpha; multiple home pages.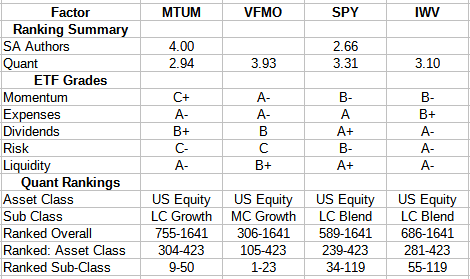
Portfolio strategy
Adding either, especially the MTUM ETF, doesn’t seem worth the trouble of having to track another position in the portfolio. While VFMO adds 95bps in performance, the extra risk almost offsets most of that gain as measured by the risk ratios. Seems like the K.I.S.S. principle comes into play: Keep It Simple Silly!
While one might consider replacing IWV with VMFO, MTUM is not a good replacement for SPY. That could change if the investor had their own ETF momentum model that has proven effective: I have not. If one wants a momentum ETF, here are two others; the Invesco S&P 500 Momentum ETF (SPMO) should consider, as I suggested recently (article).
Hoya Capital Income Builder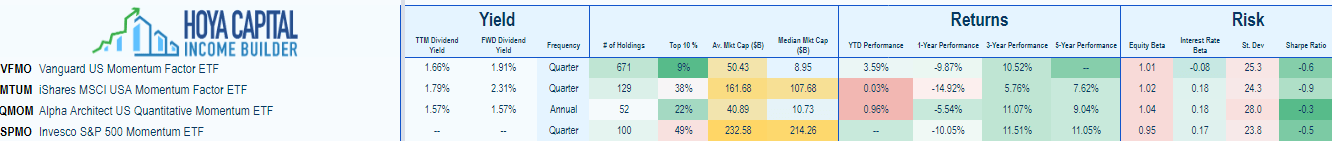
Of the four, the SPMO ETF has performed the best since late 2018.
Be the first to comment