

bymuratdeniz
Introduction
Following a very strong recovery during 2021, Vermilion Energy Inc. (NYSE:VET) was poised to enter a new era of dividend growth in 2022 with the potential for a massive 20%+ yield on current cost, as my previous article flagged, despite their current very low yield of sub-1%. Since being published, VET has announced the acquisition of Leucrotta Exploration, which after their earlier announced Corrib acquisition sees them enjoying an acquisition spree now. Despite delaying their higher shareholder returns, they are providing a stronger base for the dividend spree coming in future years.
Executive Summary & Ratings
Since many readers are likely short on time, the table below provides a very brief executive summary and ratings for the primary criteria that were assessed. This Google Document provides a list of all my equivalent ratings as well as more information regarding my rating system. The following section provides a detailed analysis for those readers who are wishing to dig deeper into their situation.
Author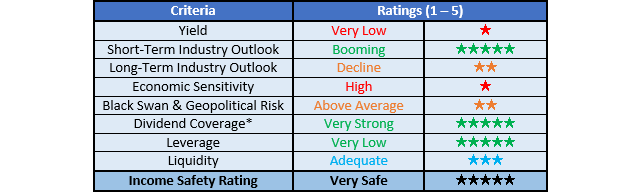
*Instead of simply assessing dividend coverage through earnings per share cash flow, I prefer to utilize free cash flow since it provides the toughest criteria and also best captures the true impact upon their financial position.
Detailed Analysis
Author
The Russia-Ukraine war is causing untold destruction, although from a strictly financial standpoint, it inadvertently created booming operating conditions for those supplying oil and gas from outside of Russia. This saw their operating cash flow for the first quarter of 2022 climbing to a very impressive C$341.1m, which apart from already being nearly three-times their previous result of C$119.1m during the first quarter of 2021, was actually weighed down by a relatively sizeable working capital build of C$60.8m that, if excluded, sees their underlying result at slightly north of C$400m.
Despite this temporary headwind, they still generated free cash flow of C$250.9m during the first quarter of 2022, which if not for their working capital build, would have been C$311.7m. As a side-note, the free cash flow management states of C$305m is effectively the equivalent of this result but instead of utilizing their operating cash flow as the starting basis, it utilizes their very similar fund flows from operations as the starting basis, as per page thirty-one of their first quarter of 2022 MD&A report.
If utilizing these comparable numbers on slide twenty-two of their first quarter of 2022 results presentation, their pro-forma free cash flow during the first quarter would have been C$489m if also including their soon-to-be-acquired Corrib acquisition. Since this is a very impressive circa C$180m for merely one quarter, they have materially boosted their free cash flow base very cheaply given the acquisition cost is only circa C$600m, which effectively sees a circa 100%+ free cash flow yield on acquisition cost. Thankfully, this additional free cash flow is being netted off against their acquisition cost and thus not missed, just effectively deferred.
If their underlying free cash flow of C$489m for the first quarter of 2022 is annualized, it equals a very impressive circa C$2b. Whilst this already provides massive scope for shareholder returns in the future, given their current market capitalization of only approximately C$4.3b sees an insanely high near 50% free cash flow yield, this stands to grow even higher following their recent Leucrotta acquisition, as the graph included below displays.
Vermilion Energy First Quarter Of 2022 Results Presentation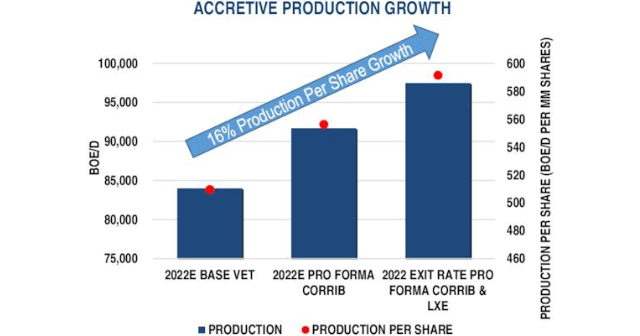
It can be seen that after completing these two acquisitions, they forecast that their production will be approximately 16% higher than their 2022 base, which is a sizeable difference and should help provide a lasting benefit for years to come, especially given the bullish outlook for tight oil and gas supplies following the sanctions levied upon Russia. Apart from their Corrib acquisition already contributing additional free cash flow, their recent Leucrotta acquisition also stands to help.
Once ramped up to full production in the future after 2023, they expect C$200m per annum of additional free cash flow from their Leucrotta acquisition at circa $90 per barrel oil prices, as per slide twenty-five of their previously linked first quarter of 2022 results presentation. To remain conservative with this analysis, even if future oil and gas prices revert lower and thereby cut this in half, the additional C$100m per annum of free cash flow is still the equivalent to near 2.50% of their current market capitalization.
Whilst this may sound small, it should be remembered that apart from being a conservative estimation, this sits atop their existing free cash flow and thus is a reoccurring yearly boost. Also, the acquisition cost was only C$477m and thus even at this conservative rate, this would still see a circa 20%+ free cash flow yield on the acquisition cost. Similarly to their Corrib acquisition, this is a very reasonable cost that when combined, sees a stronger base for the dividend spree coming as they ramp up their shareholder returns in the future, as was the focus of my previous analysis and remains dependent upon them reaching their net debt target of C$1.2b.
Author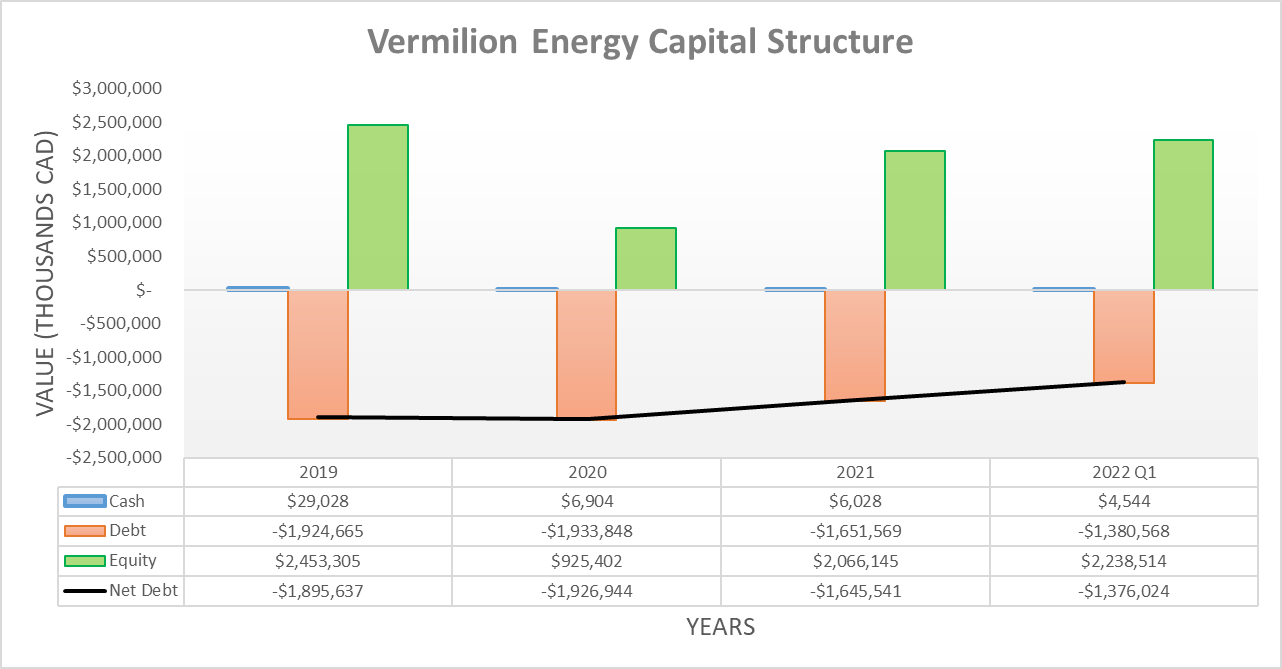
When moving onwards to their capital structure, their very impressive free cash flow generation made easy work of deleveraging with their net debt falling to C$1.376b versus its previous level of C$1.645b at the end of 2021. This represented a decrease of C$269m and as a result, they were very close to their C$1.2b net debt target with only a C$176m difference remaining.
If not for their Leucrotta acquisition, this target would have been reached following the second quarter of 2022 and thus mean that higher shareholder returns would have been merely weeks away when they announce their results. Due to the C$477m cost for this acquisition that was completed during the second quarter, there is actually essentially a C$653m difference between their latest net debt and their target. Thankfully management still expects to reach their C$1.2b net debt target during the second half of 2022, as per slide twenty-seven of their previously linked first quarter of 2022 results presentation and considering how close they were already, this seems realistic. Notwithstanding these improvements, it would be redundant to reassess their leverage and liquidity in detail after only one quarter.
The two relevant graphs have still been included below to provide context for any new readers that show their booming financial performance and lower net debt pushed their leverage lower. This now sees their net debt-to-EBITDA at 0.62 and their net debt-to-operating cash flow at 0.86, both of which are lower than their previous respective results of 1.30 and 1.97 at the end of 2021 and also now beneath the threshold of 1.00 for the very low territory. Meanwhile, their ample free cash flow ensures that their liquidity remains adequate, despite their otherwise lower than preferred current ratio of only 0.52 that is down slightly versus their previous result of 0.63 at the end of 2021. If interested in further details regarding these two topics, please refer to my previously linked article.
Author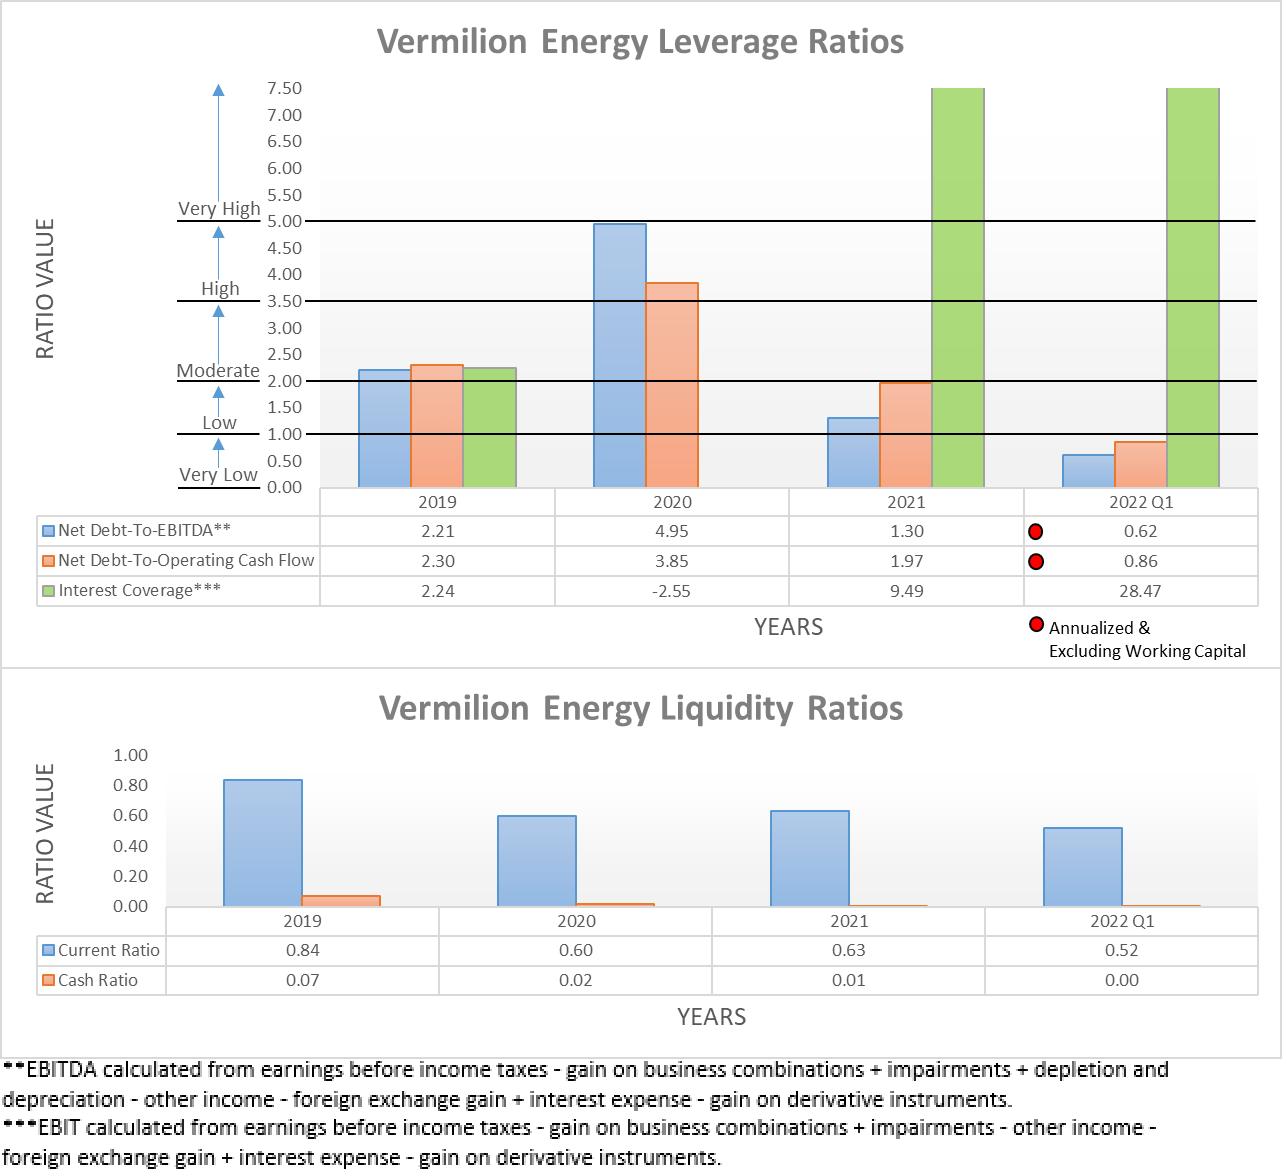
Conclusion
It would not be unrealistic to see higher shareholder returns when their second quarter of 2022 results are released in early August given these booming operating conditions, although it seems more likely that shareholders will have to wait another quarter following their Leucrotta acquisition. Despite this temporary delay, this acquisition spree makes a stronger base for the dividend spree coming during the following years by boosting their ability to generate free cash flow for a very reasonable cost. Thus, unsurprisingly, I believe that upgrading to a strong buy rating is now appropriate.
Notes: Unless specified otherwise, all figures in this article were taken from Vermilion Energy’s Quarterly Reports, all calculated figures were performed by the author.
Be the first to comment