

Deagreez
It’s been a historically terrible start to the year for stocks. How historic?
Daily Shot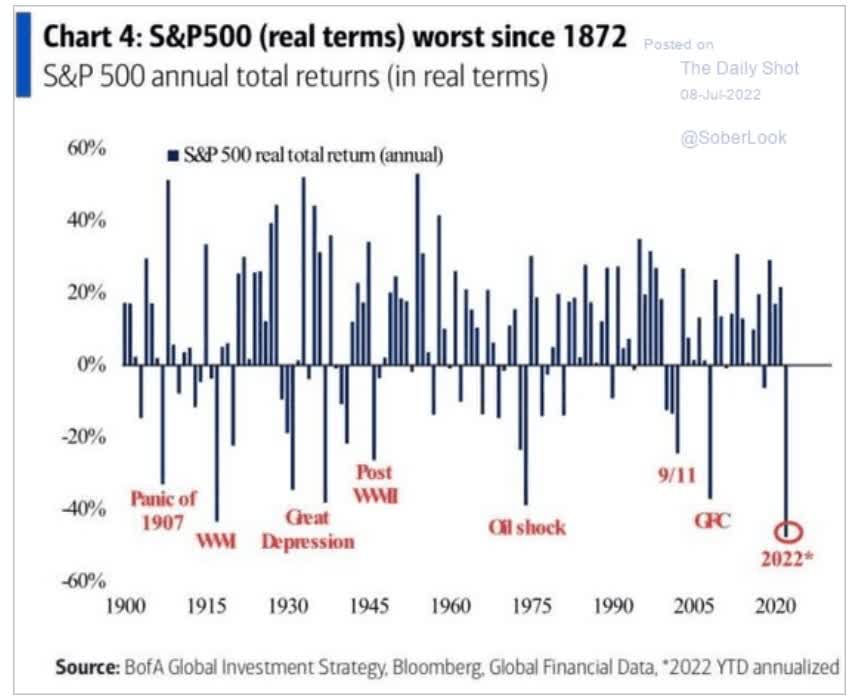
According to Bank of America, annualized inflation-adjusted returns in the first half of 2022 were the worst in 150 years.
Charlie Bilello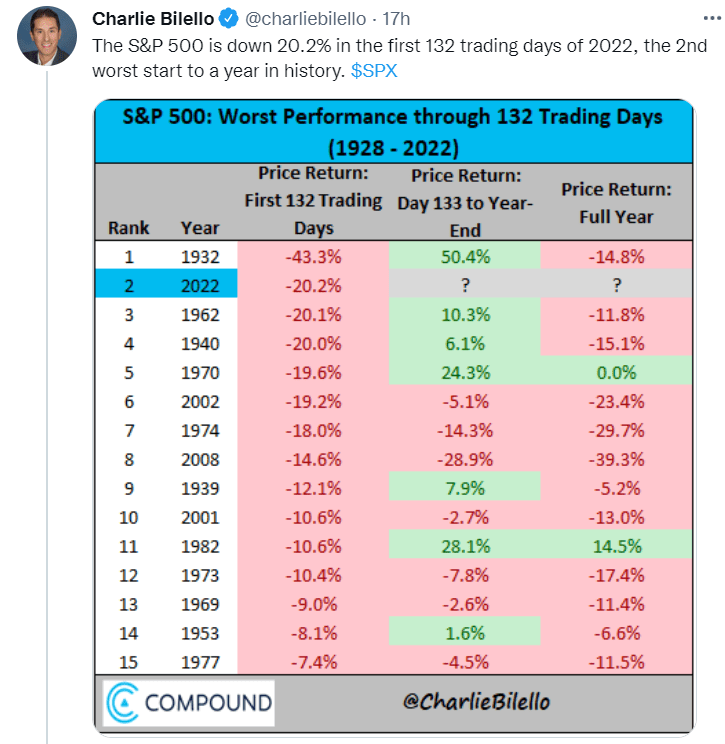
It’s the worst start to the year for stocks since 1932, during the worst stock market crash in US history (an 87% plunge).
The traditional 60/40, which is designed to be defensive and less volatile, is still doing its job, but thanks to the worst bond bear market in history, just barely.
Charlie Bilello
It’s the worst year for a 60/40 since 1931, and there are few places to hide right now.
Commodities, which have been red hot, and viewed by many as an inflation hedge, are starting to roll over.
- oil is down 27% off its highs
Ycharts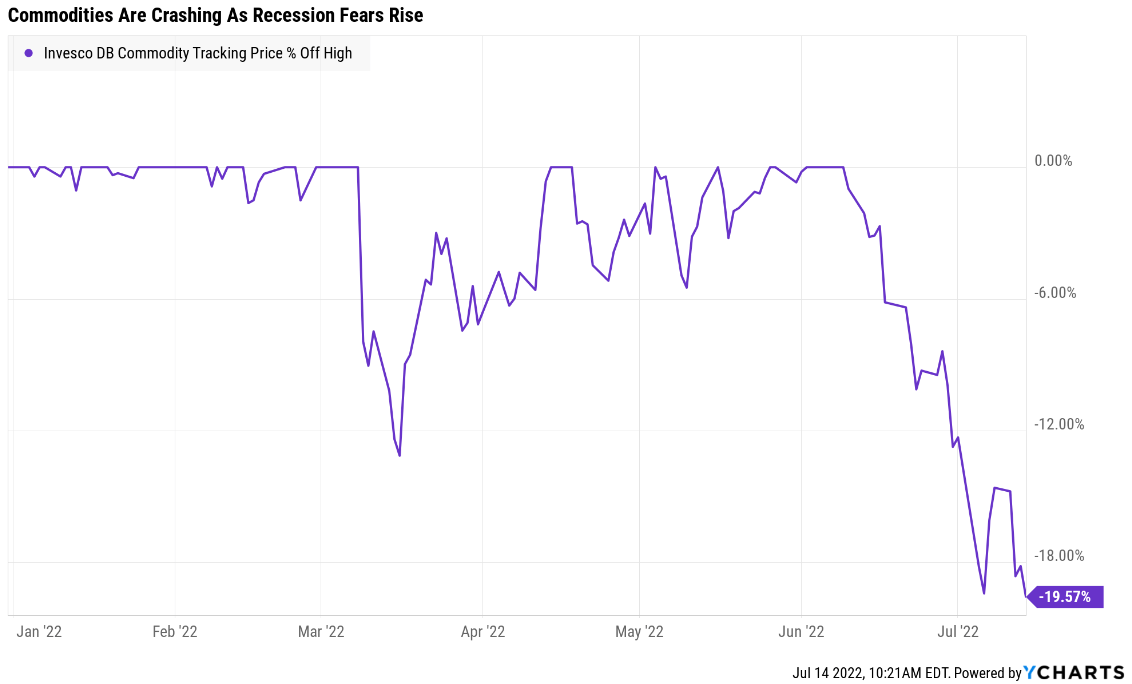
Overall commodities are down 20% in three weeks. Why? Because of rising inflation fears.
The famous 2-10 yield curve, one of the best recession forecasting tools in history, is now 24 basis points inverted.
CME Group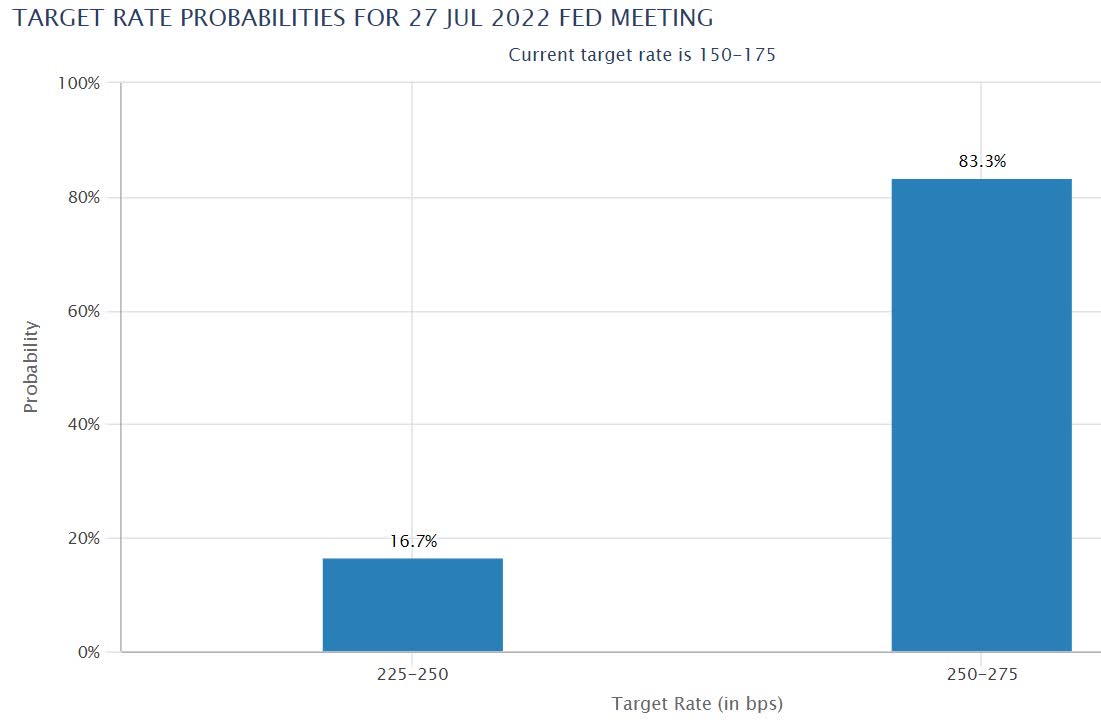
The bond futures market is now pricing in an 83% probability the Fed hikes 1% in July.
- just the 4th 1% hike in US history
CME Group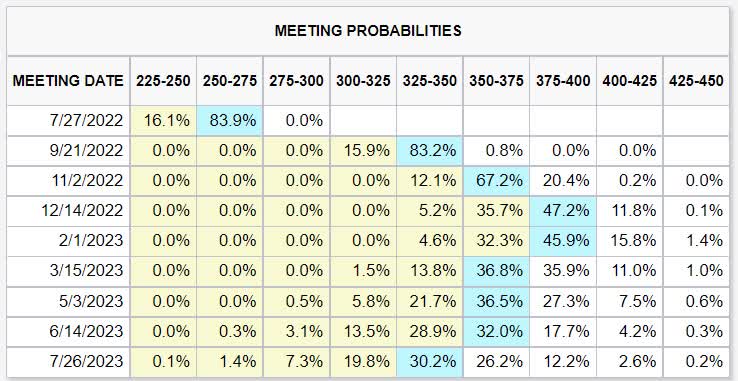
The bond market also expects the Fed to:
- hike 0.75% in September
- 0.25% in November
- 0.25% in December
- 17% probability of another 0.25% in February
Note how the bond market expects the Fed to reverse course and cut rates by 0.5% by July. That’s due to the bond market’s strong conviction that a recession is coming in 2023.
- Bank of America thinks it will start in Q4 2022
Basically, we live in very troubled times right now, and there aren’t many places to hide in your portfolio… except for some recession-resistant undervalued high-yield low volatility blue-chips like Verizon (NYSE:VZ).
Ycharts
Verizon, thorough all the chaos of 2022, is dead flat, outperforming the market by 22% and the Nasdaq by 30%.
Now I can’t promise you that Verizon won’t fall if the market bottoms at -35% to -40% (the blue-chip consensus for a recession), but it’s likely to fall less and help you sleep well at night.
All while enjoying a very safe 5.1% yield today, and steadily growing income every single year in the future.
So let me show you the four reasons why Verizon is a 5.1% yielding is a retirement recession dream stock.
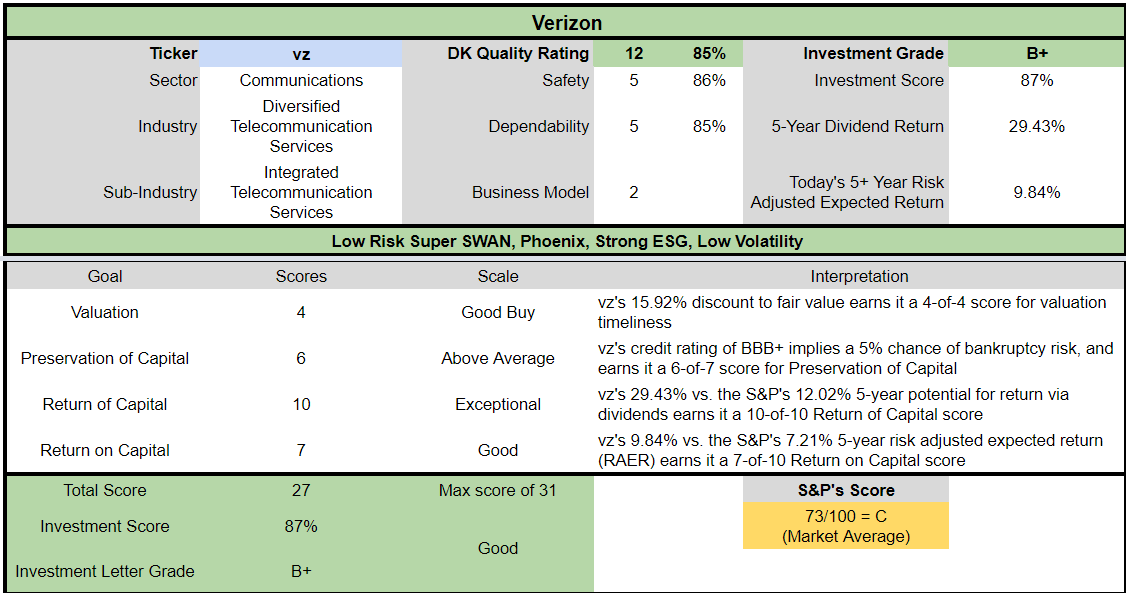
Reason One: Verizon Is The Complete Package
- 85% quality low-risk 12/13 Super SWAN telecom
- 152nd highest quality company on the Master List (70th percentile)
- 86% dividend safety score
- 15-year dividend growth streak (no dividend cuts since at least 1985)
- 5.1% very safe yield
- 0.5% average recession dividend cut risk
- 1.7% severe recession dividend cut risk
- 16% historically undervalued (potential good buy)
- Fair Value: $60.06 (11.0X earnings)
- 9X forward earnings vs 12.5X to 14.5X historical
- 7.7X cash-adjusted earnings = anti-bubble blue-chip
- BBB+ stable outlook credit rating = 5% 30-year bankruptcy risk
- 80th industry percentile risk management consensus = very good
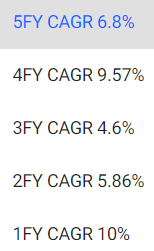
- 3% to 5% CAGR margin-of-error growth consensus range
- 4.0% CAGR median growth consensus
- 5-year consensus total return potential: 13% to 17% CAGR
- base-case 5-year consensus return potential: 14% CAGR (2X more than the S&P consensus)
- consensus 12-month total return forecast: 18%
- Fundamentally Justified 12-Month Returns: 24% CAGR
A Potentially Great Low Volatility High-Yield Option For This Bear Market
- 18% average 15-year annual volatility vs 23% aristocrats and 28% average standalone company
One Of The Most Attractive Yields In Its History
(Source: Yieldchart)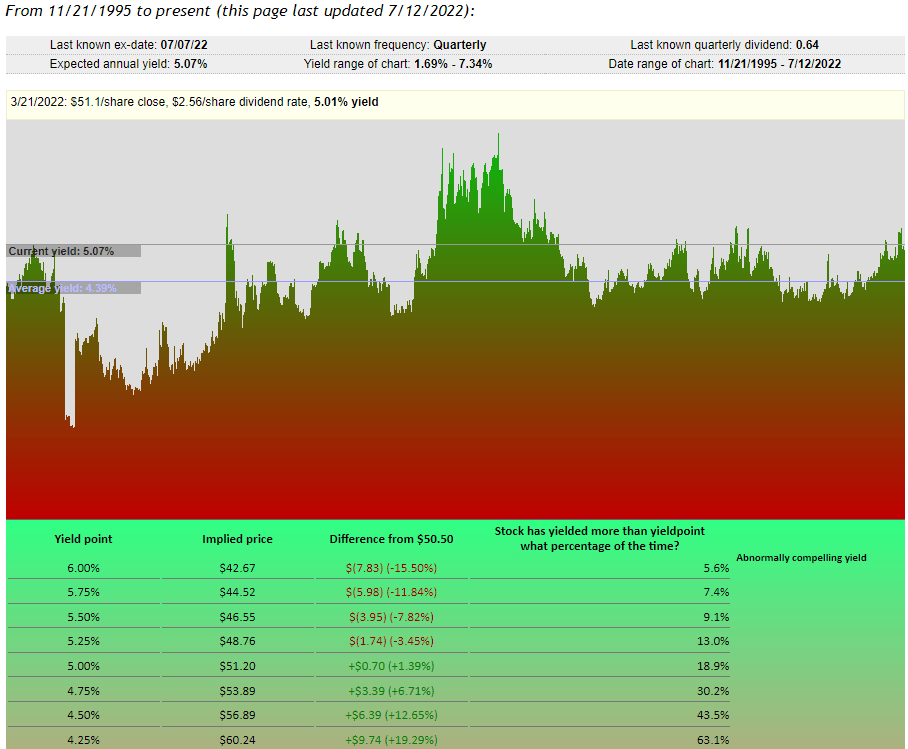
In the last 25 years, VZ’s yield has only been higher than now about 18% of the time.
FAST Graphs, FactSet Research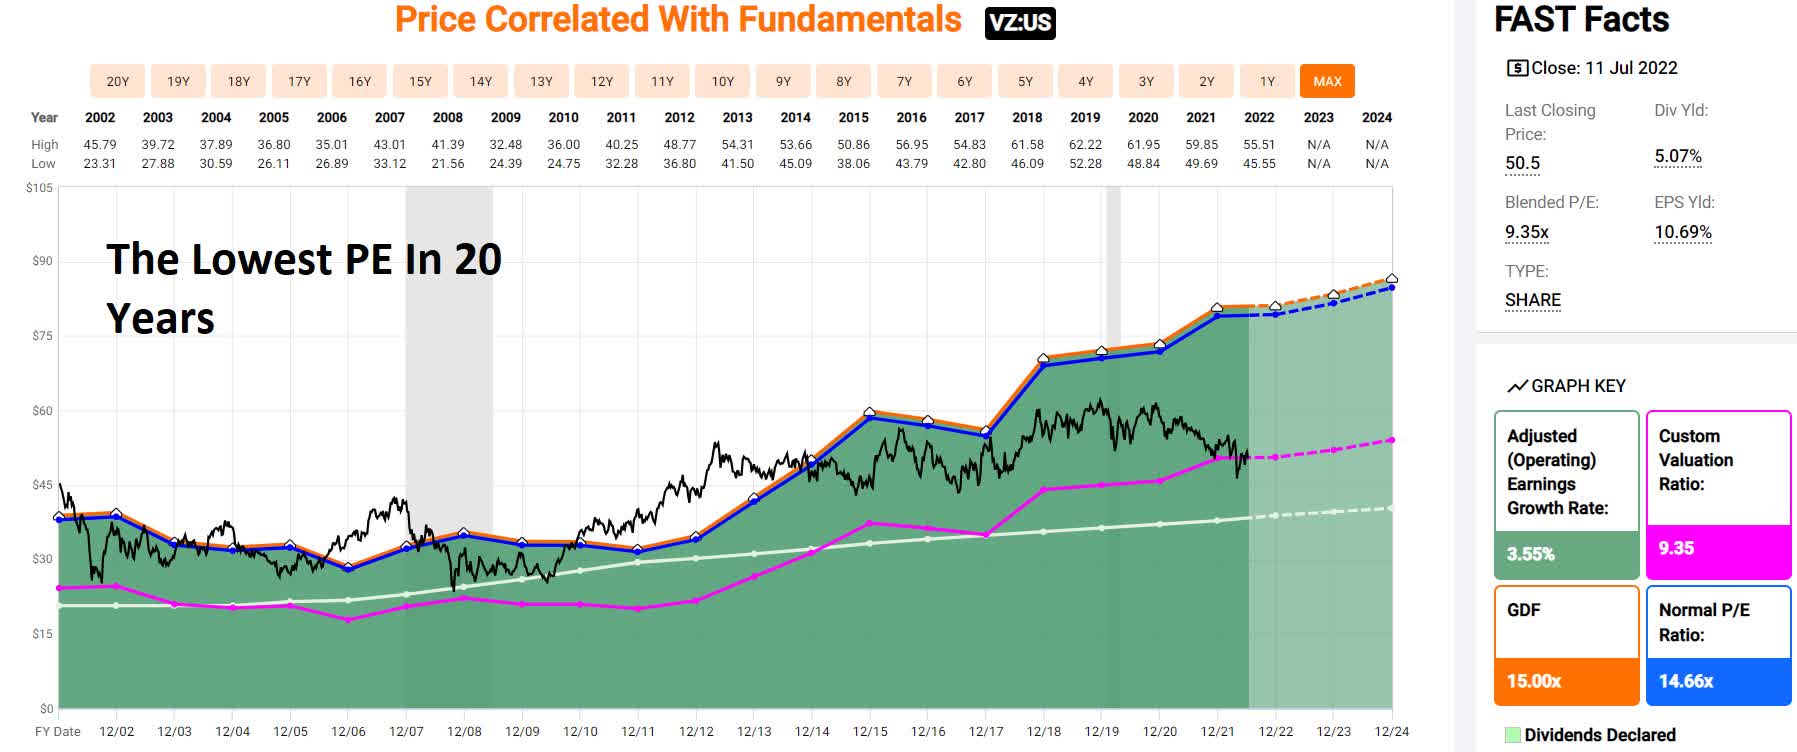
VZ’s PE is now at the lowest level in 20 years.
- better valuation than the Pandemic or Great Recession
VZ Medium-Term Growth Outlook Is Intact
| Metric | 2021 Growth | 2022 Growth Consensus | 2023 Growth Consensus | 2024 Growth Consensus | 2025 Growth Consensus | 2026 Growth Consensus |
2027 Growth Consensus |
| Sales | 4% | 1% | 2% | 2% | 2% | 0% | 3% |
| Dividend | 2% | 2% | 2% | 1% | 3% | 1% | 2% (20-Year Streak) |
| EPS | 10% | 0% | 3% | 4% | 5% | 5% | 9% |
| Operating Cash Flow | -6% | -4% | 3% | 4% | NA | NA | NA |
| Free Cash Flow | -18% | -18% | 30% | 16% | 7% | 6% | 11% |
| EBITDA | 3% | 1% | 3% | 3% | NA | NA | NA |
| EBIT (operating income) | 7% | 0% | 4% | 3% | NA | NA | NA |
(Source: FAST Graphs, FactSet)
VZ is a slow-growing telecom (basically a utility) but one that’s expected to deliver 2% dividend growth every year through all economic conditions.
- 20-year dividend growth streak in 2027 (the Ben Graham standard of excellence)
Rolling Returns Since July 1985
(Source: Portfolio Visualizer Premium)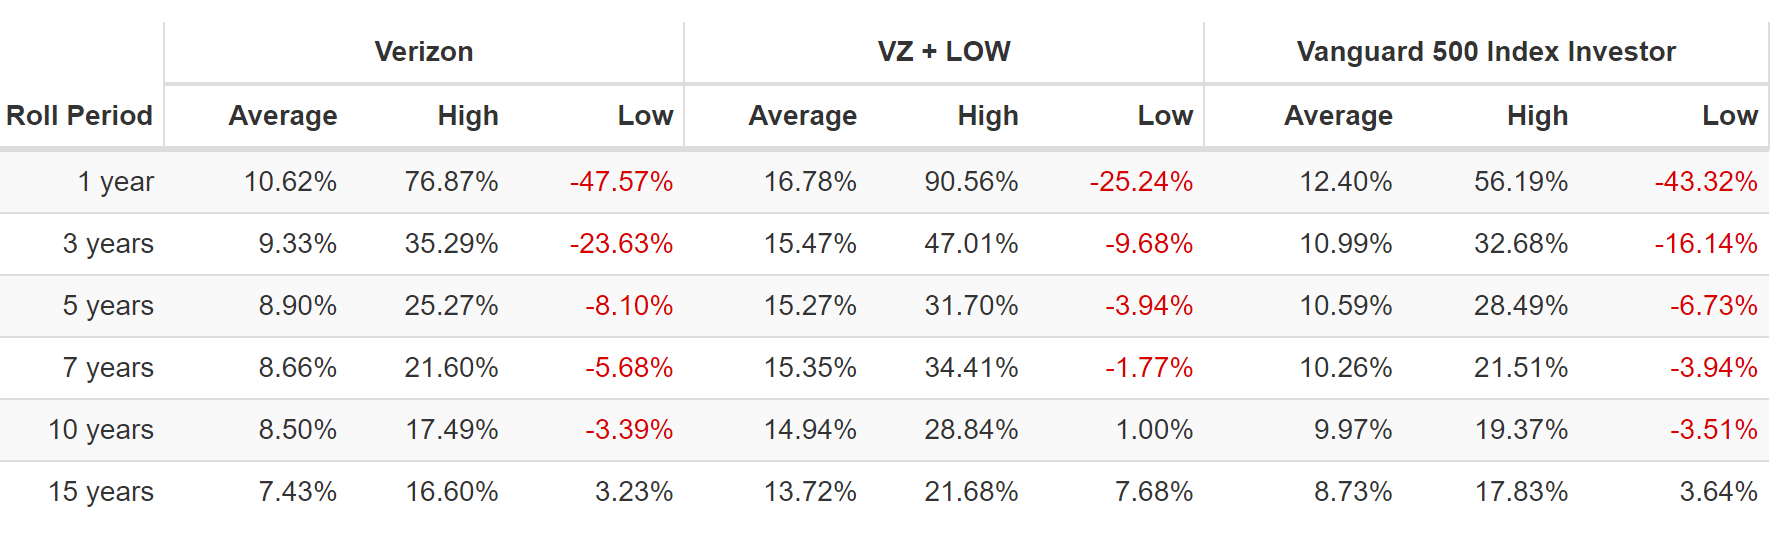
VZ is not a market-beating company, that’s not its job. Combining it with a fast-growing dividend blue-chip like Lowe’s (LOW) can double the long-term returns and annual dividend growth.
However, buying VZ during bear markets can result in returns as strong as 16.6% over 15 years and 17.5% over 10 years.
- 10X return in 15 years
- 5X return in 10 years
VZ 2024 Consensus Total Return Potential
(Source: FAST Graphs, FactSet) (Source: FAST Graphs, FactSet)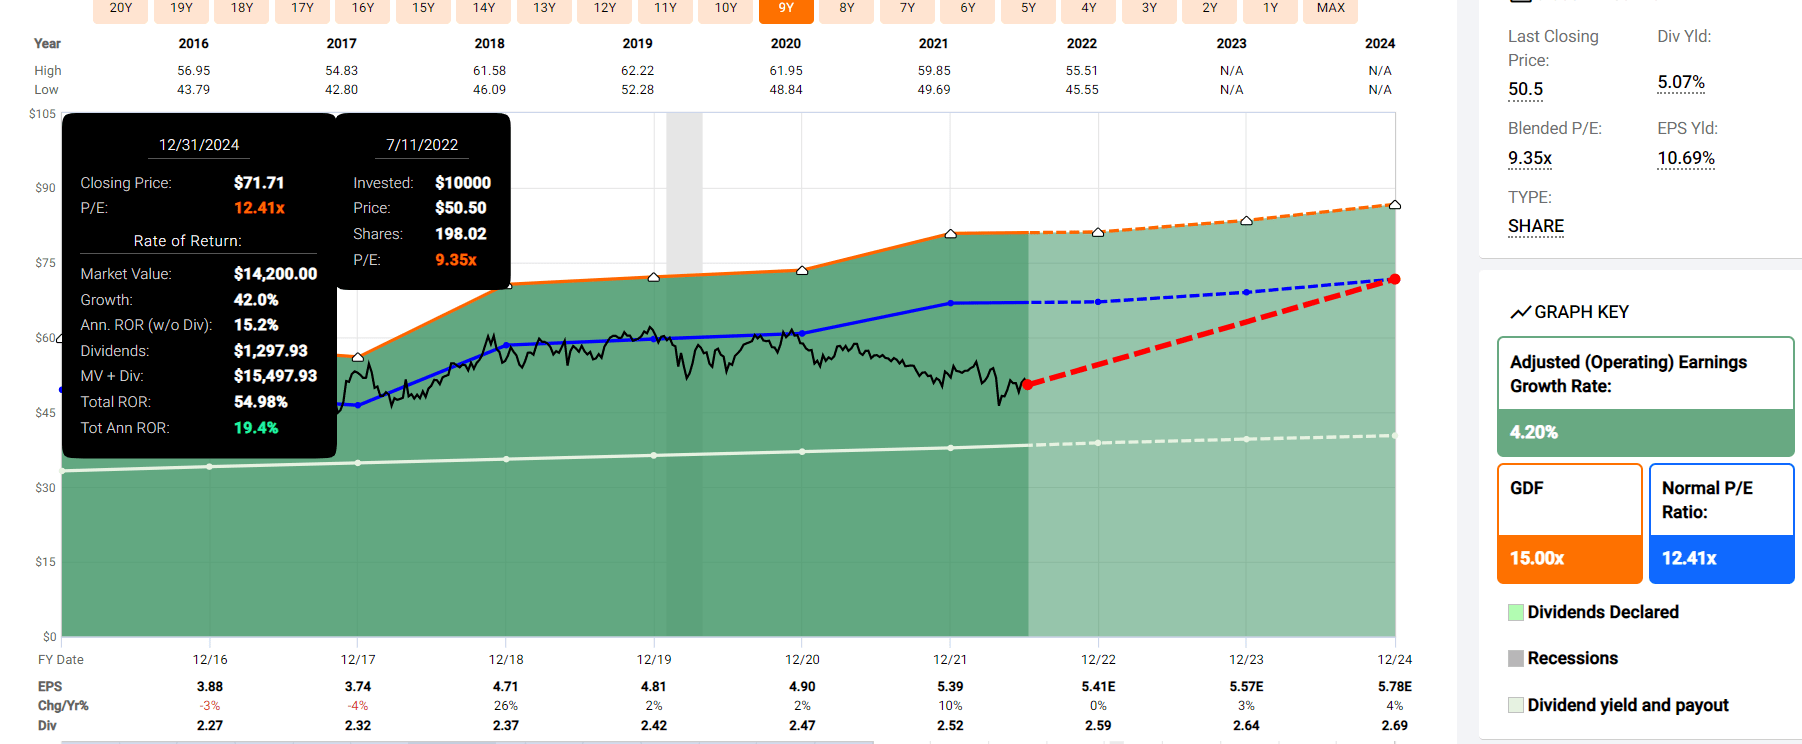
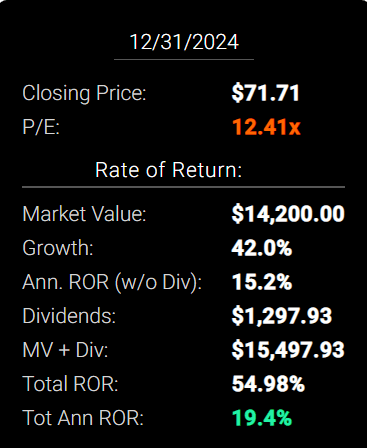
If VZ grows as analysts expect by 2024 and returns to the low end of historical fair value it could deliver 55% total returns or 19% annually.
- Buffett-like returns from a high-yield, slow-growing, anti-bubble bargain hiding in plain sight
Now compare that to the S&P 500 consensus.
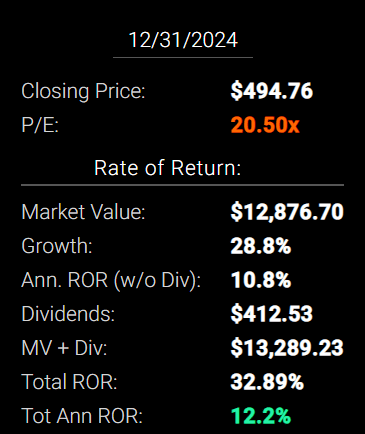
S&P 2024 Consensus Total Return Potential
(Source: FAST Graphs, FactSet) (Source: FAST Graphs, FactSet)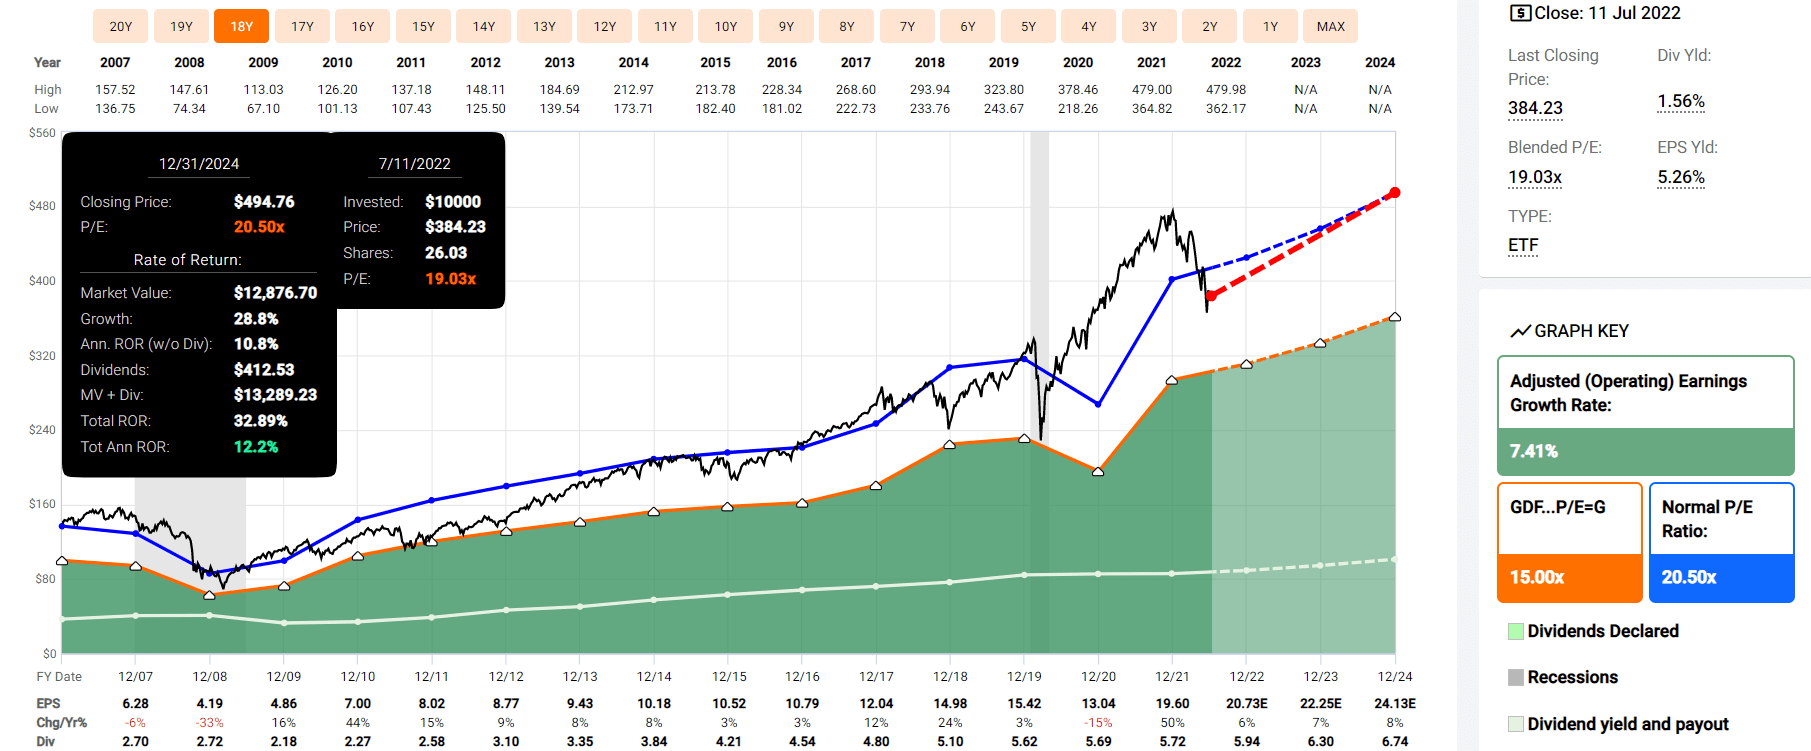
VZ 2027 Consensus Total Return Potential
(Source: FAST Graphs, FactSet) (Source: FAST Graphs, FactSet)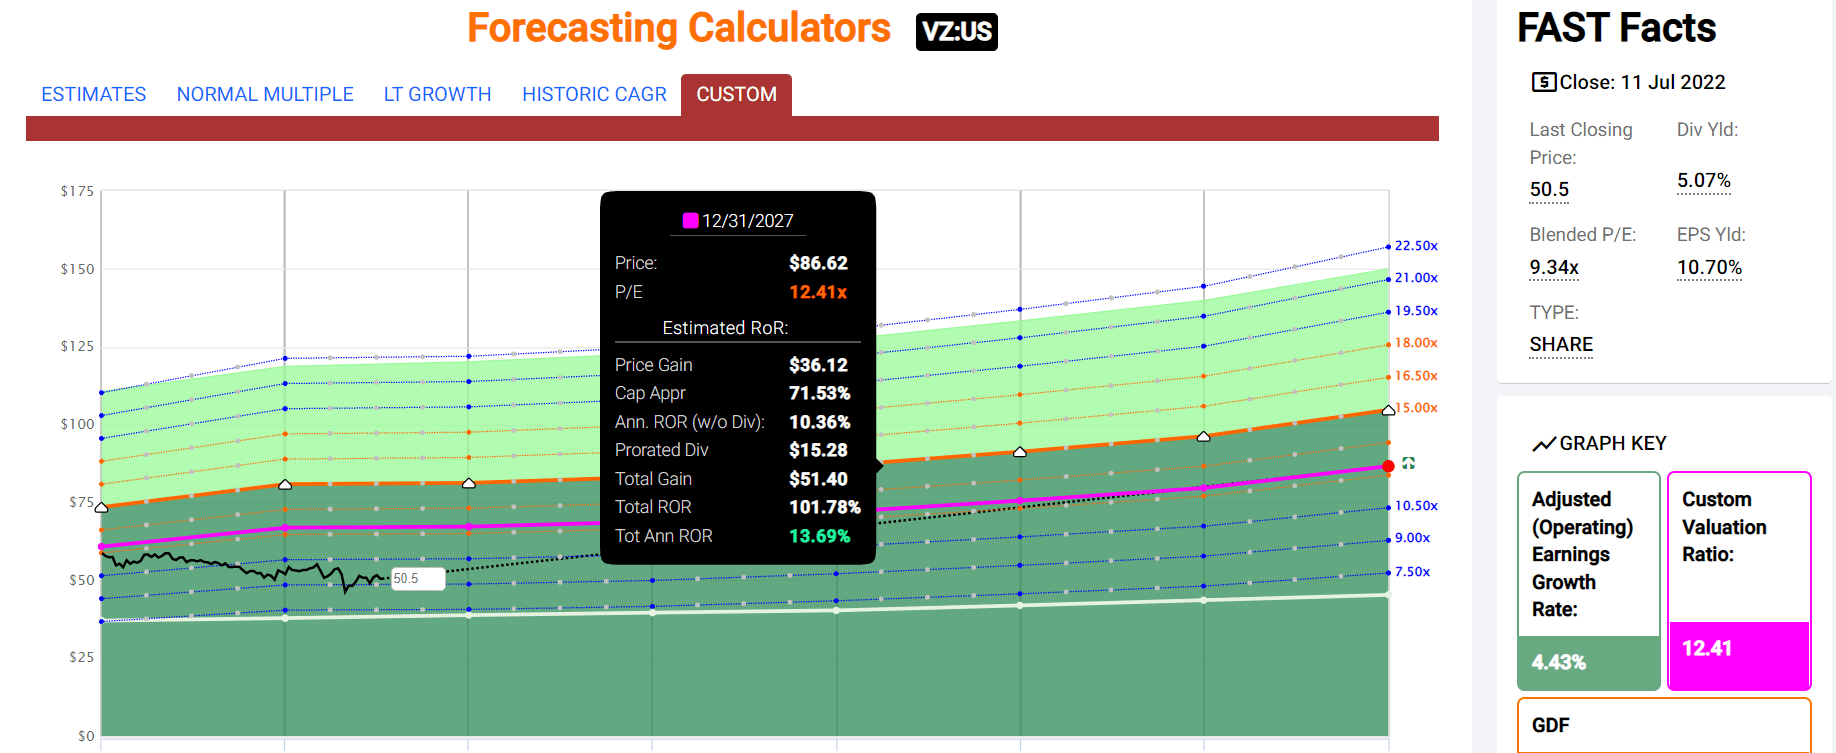
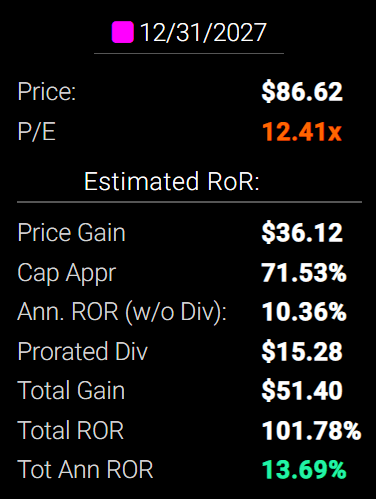
By 2027 if VZ grows as expected and returns to the low end of historical fair value, it could deliver 102% total returns or 14% annually.
- about 2X the S&P 500 consensus
VZ Long-Term Consensus Total Return Potential
| Investment Strategy | Yield | LT Consensus Growth | LT Consensus Total Return Potential | Long-Term Risk-Adjusted Expected Return | Long-Term Inflation And Risk-Adjusted Expected Returns | Years To Double Your Inflation & Risk-Adjusted Wealth |
10-Year Inflation And Risk-Adjusted Expected Return |
| Verizon | 5.1% | 4.0% | 9.1% | 6.4% | 3.9% | 18.5 | 1.47 |
| Verizon + Lowe’s | 3.7% | 13.4% | 17.1% | 12.0% | 9.5% | 7.6 | 2.48 |
| Dividend Aristocrats | 2.4% | 8.5% | 10.9% | 7.6% | 5.2% | 14.0 | 1.65 |
| S&P 500 | 1.7% | 8.5% | 10.2% | 7.1% | 4.7% | 15.4 | 1.58 |
| Nasdaq | 1.0% | 12.7% | 13.7% | 9.6% | 7.1% | 10.1 | 1.99 |
(Sources: Morningstar, FactSet, Ycharts)
- VZ on its own will not beat the market or aristocrats
- combine VZ with a fast-growing dividend blue-chip and you cannot just potentially beat the S&P and aristocrats but even the Nasdaq
VZ Total Returns Since July 1985
(Source: Portfolio Visualizer Premium) (Source: Portfolio Visualizer Premium)
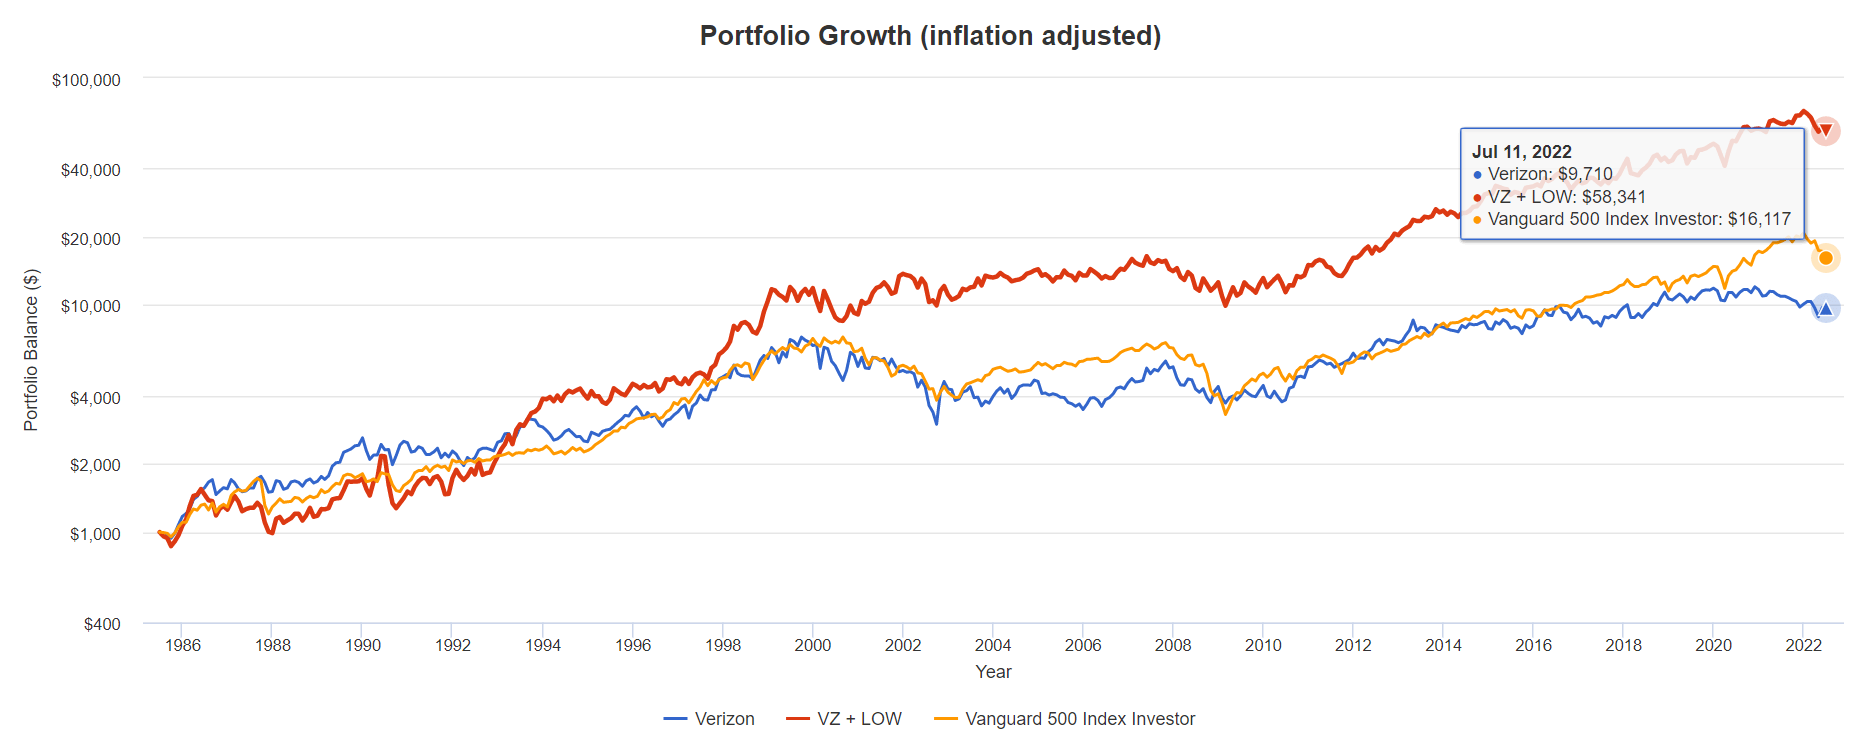
VZ has delivered 26.4X returns since 1985.
- 10X adjusted for inflation
- S&P 500 16X
- VZ + LOW 58X
A Dividend Growth Blue-Chip You Can Trust
(Source: Portfolio Visualizer Premium)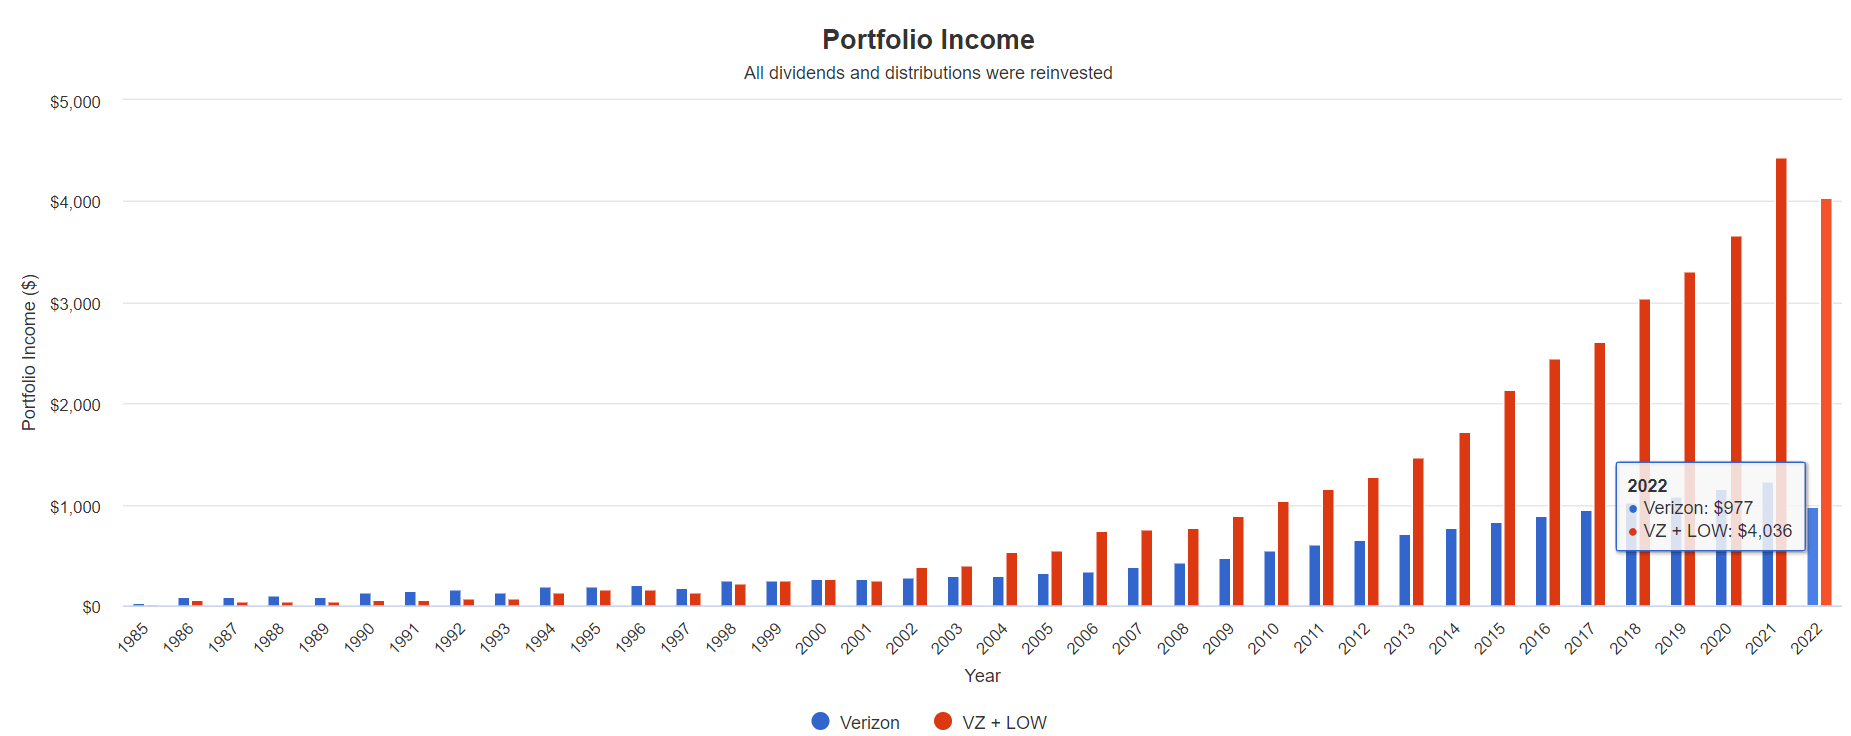
| Portfolio | 1986 Income Per $1,000 Investment | 2022 Income Per $1,000 Investment | Annual Income Growth | Starting Yield |
2021 Yield On Cost |
| VZ + LOW | $60 | $8,072 | 14.59% | 6.0% | 807.2% |
| VZ | $82 | $1,954 | 9.21% | 8.2% | 195.4% |
(Source: Portfolio Visualizer Premium)
VZ has delivered 9% income growth over time similar to the S&P 500. Combined with a fast-growing dividend blue-chip like LOW’s increases that to closer to 15%.
What about the future?
| Analyst Consensus Income Growth Forecast | Risk-Adjusted Expected Income Growth | Risk And Tax-Adjusted Expected Income Growth |
Risk, Inflation, And Tax Adjusted Income Growth Consensus |
| 9.1% | 6.4% | 5.4% | 2.9% |
(Source: DK Research Terminal, FactSet)
Analysts expect 9.1% income growth from VZ in the future, which adjusted for the risk of it not growing as expected, inflation, and taxes are about 2.9% real expected income growth.
Now compare that to what they expect from the S&P 500.
| Time Frame | S&P Inflation-Adjusted Dividend Growth | S&P Inflation-Adjusted Earnings Growth |
| 1871-2021 | 1.6% | 2.1% |
| 1945-2021 | 2.4% | 3.5% |
| 1981-2021 (Modern Falling Rate Era) | 2.8% | 3.8% |
| 2008-2021 (Modern Low Rate Era) | 3.5% | 6.2% |
| FactSet Future Consensus | 2.0% | 5.2% |
(Sources: S&P, FactSet, Multipl.com)
- 1.7% post-tax inflation-adjusted income growth from the S&P 500.
What about a 60/40 retirement portfolio?
- 0.5% consensus inflation, risk, and tax-adjusted income growth.
In other words, VZ is expected to generate about 2X faster real income growth than the S&P 500 and 6X faster income growth than a 60/40.
- with over 3X higher yield on day one
What inflation-adjusted returns do analysts expect in the future?
Inflation-Adjusted Consensus Return Potential: $1,000 Initial Investment
| Time Frame (Years) | 7.6% CAGR Inflation-Adjusted S&P Consensus | 8.4% Inflation-Adjusted Aristocrats Consensus | 6.6% CAGR Inflation-Adjusted VZ Consensus | Difference Between Inflation-Adjusted VZ Consensus Vs S&P Consensus |
| 5 | $1,445.67 | $1,493.29 | $1,378.47 | -$67.20 |
| 10 | $2,089.97 | $2,229.92 | $1,900.18 | -$189.79 |
| 15 | $3,021.42 | $3,329.92 | $2,619.34 | -$402.08 |
| 20 | $4,367.98 | $4,972.54 | $3,610.67 | -$757.31 |
| 25 | $6,314.67 | $7,425.45 | $4,977.20 | -$1,337.47 |
| 30 | $9,128.95 | $11,088.36 | $6,860.92 | -$2,268.04 |
(Source: DK Research Terminal, FactSet)
Analysts think VZ is capable of 7X inflation-adjusted returns over the next 30 years.
| Time Frame (Years) | Ratio Aristocrats/S&P Consensus | Ratio Inflation-Adjusted VZ Consensus vs S&P consensus |
| 5 | 1.03 | 0.95 |
| 10 | 1.07 | 0.91 |
| 15 | 1.10 | 0.87 |
| 20 | 1.14 | 0.83 |
| 25 | 1.18 | 0.79 |
| 30 | 1.21 | 0.75 |
(Source: DK Research Terminal, FactSet)
That’s about 25% less than the S&P 500 but as part of a diversified portfolio that includes fast-growing dividend blue-chips you can do significantly better than the S&P and aristocrats.
VZ Investment Decision Score
Dk (Source: DK Automated Investment Decision Tool)
For anyone comfortable with its risk profile, VZ is one of the most reasonable and prudent high-yield anti-bubble blue-chips you can buy today.
- 16% discount vs 4% market discount = 12% better valuation
- 5.1% yield vs 1.7% yield (and a much safer yield at that )
- 36% better risk-adjusted expected return over the next five years
- 29% of your investment repaid in consensus dividends within five years, about 2.5X more than the S&P 500
Reason Two: Verizon Is One Of The Highest Quality Companies On Earth
There are many ways to measure safety and quality and I factor in pretty much all of them.
The Dividend Kings’ overall quality scores are based on a 253-point model that includes:
-
Dividend safety
-
Balance sheet strength
-
Credit ratings
-
Credit default swap medium-term bankruptcy risk data
-
Short and long-term bankruptcy risk
-
Accounting and corporate fraud risk
-
Profitability and business model
-
Growth consensus estimates
-
Management growth guidance
-
Historical earnings growth rates
-
Historical cash flow growth rates
-
Historical dividend growth rates
-
Historical sales growth rates
-
Cost of capital
-
GF Scores
-
Long-term risk-management scores from MSCI, Morningstar, FactSet, S&P, Reuters’/Refinitiv, and Just Capital
-
Management quality
-
Dividend-friendly corporate culture/income dependability
-
Long-term total returns (a Ben Graham sign of quality)
-
Analyst consensus long-term return potential
In fact, it includes over 1,000 fundamental metrics including the 12 rating agencies we use to assess fundamental risk.
-
credit and risk management ratings make up 41% of the DK safety and quality model
-
dividend/balance sheet/risk ratings make up 82% of the DK safety and quality model
How do we know that our safety and quality model works well?
During the two worst recessions in 75 years, our safety model 87% of blue-chip dividend cuts, the ultimate baptism by fire for any dividend safety model.
How does VZ score on our comprehensive safety and quality models?
VZ Dividend Safety
| Rating | Dividend Kings Safety Score (162 Point Safety Model) | Approximate Dividend Cut Risk (Average Recession) | Approximate Dividend Cut Risk In Pandemic Level Recession |
| 1 – unsafe | 0% to 20% | over 4% | 16+% |
| 2- below average | 21% to 40% | over 2% | 8% to 16% |
| 3 – average | 41% to 60% | 2% | 4% to 8% |
| 4 – safe | 61% to 80% | 1% | 2% to 4% |
| 5- very safe | 81% to 100% | 0.5% | 1% to 2% |
| VZ | 86% | 0.50% | 1.70% |
| Risk Rating | Low-Risk (80th industry percentile risk-management consensus) | BBB+ stable outlook credit rating 2.1% 30-year bankruptcy risk | 10% OR LESS Max Risk Cap Recommendation |
Long-Term Dependability
| Company | DK Long-Term Dependability Score | Interpretation | Points |
| Non-Dependable Companies | 21% or below | Poor Dependability | 1 |
| Low Dependability Companies | 22% to 60% | Below-Average Dependability | 2 |
| S&P 500/Industry Average | 61% (61% to 70% range) | Average Dependability | 3 |
| Above-Average | 71% to 80% | Very Dependable | 4 |
| Very Good | 81% or higher | Exceptional Dependability | 5 |
| VZ | 85% | Exceptional Dependability | 5 |
Overall Quality
| VZ | Final Score | Rating |
| Safety | 86% | 5/5 very safe |
| Business Model | 70% | 2/3 narrow and stable moat |
| Dependability | 85% | 5/5 exceptional |
| Total | 85% | 12/13 Super SWAN |
| Risk Rating | 3/3 Low-Risk | |
| 15% OR LESS Max Risk Cap Rec |
10% Margin of Safety For A Potentially Good Buy |
VZ is the 152nd highest quality company on the DK 500 Masterlist.
How significant is this? The DK 500 Master List is one of the world’s best watchlists including
- every dividend aristocrat (S&P companies with 25+ year dividend growth streaks)
- every dividend champion (every company, including foreign, with 25+ year dividend growth streaks)
- every dividend king (every company with 50+ year dividend growth streaks)
- every foreign aristocrat (every company with 20+ year dividend growth streaks)
- every Ultra SWAN (wide moat aristocrats, as close to perfect quality companies as exist)
- 40 of the world’s best growth stocks
In other words, even among the world’s best companies, VZ is higher quality than 70% of them.
Why I Trust Verizon And So Can You
Verizon was founded in 1983 in New York City.
Investment Thesis Summary
Verizon is America’s leading telecom with 40% of the wireless market and a strong position in fiber internet.
- 75% of its business is consumer
- 25% is enterprise/corporate
(Source: FactSet Research Terminal)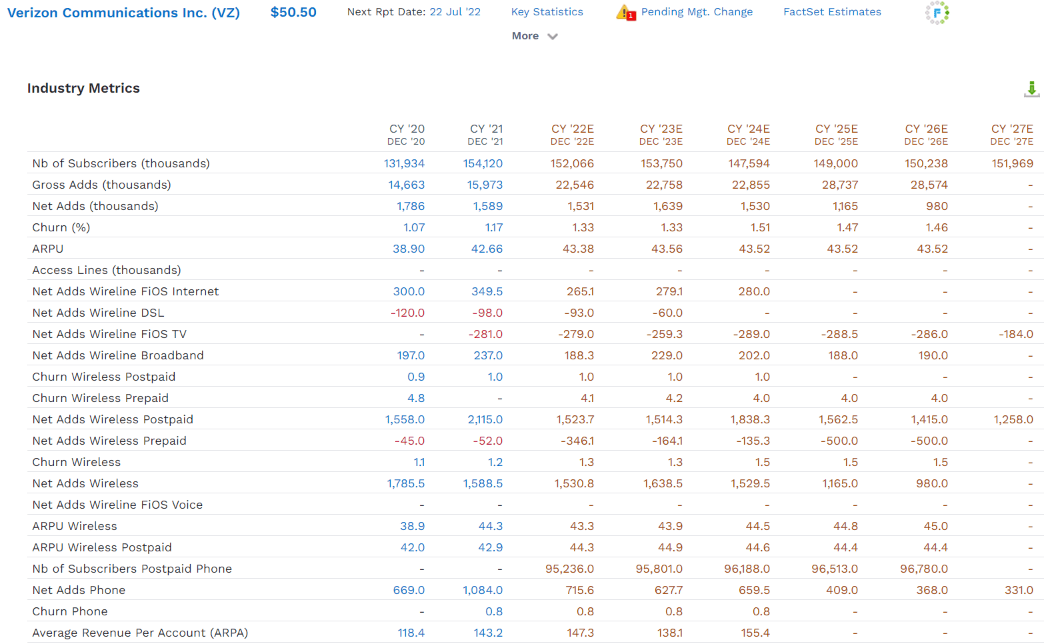
Verizon’s business is very slow growing but stable.
- effectively zero subscriber growth is expected through 2027
- a very low and stable monthly churn rate of 1.5%
- steady average revenue per user
- slight growth in revenue per account
Verizon’s claim to fame is that it’s had the best profitability in the industry for many years, as well as the best network quality.
(Source: investor presentation)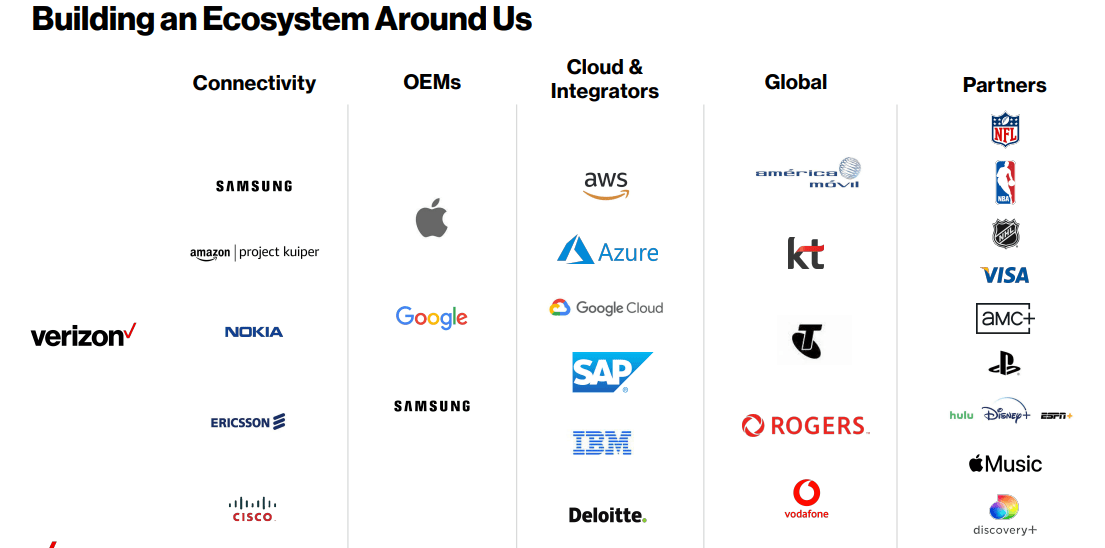
VZ is partnering with some of the world’s biggest companies in an effort to deliver “network as a service”.
(Source: investor presentation)
This is VZ’s attempt to expand its addressable market to allow for decades of slow but steady growth.
(Source: investor presentation)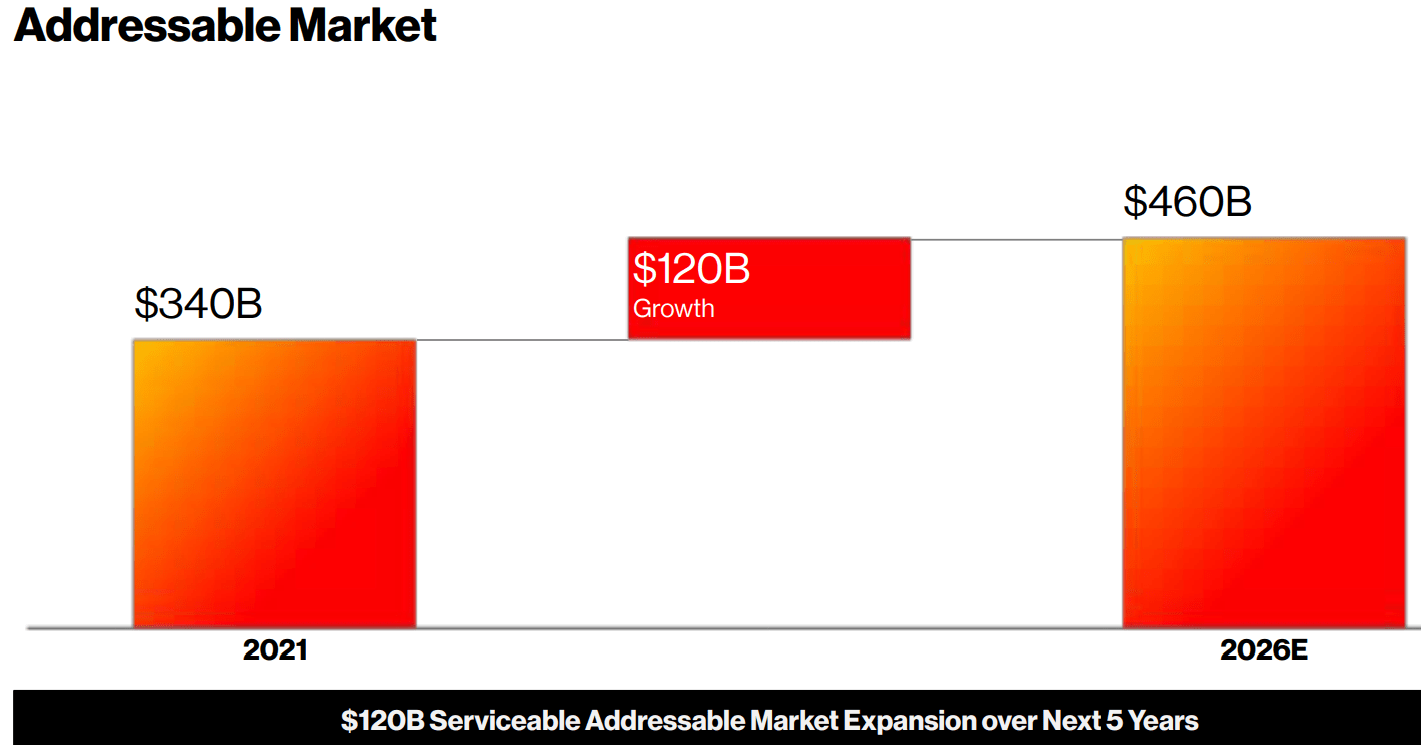
This is how VZ plans to grow its addressable market by $120 billion or about 33% over the next five years.
- currently, they have $137 billion in annual sales
- 40% market share
(Source: investor presentation)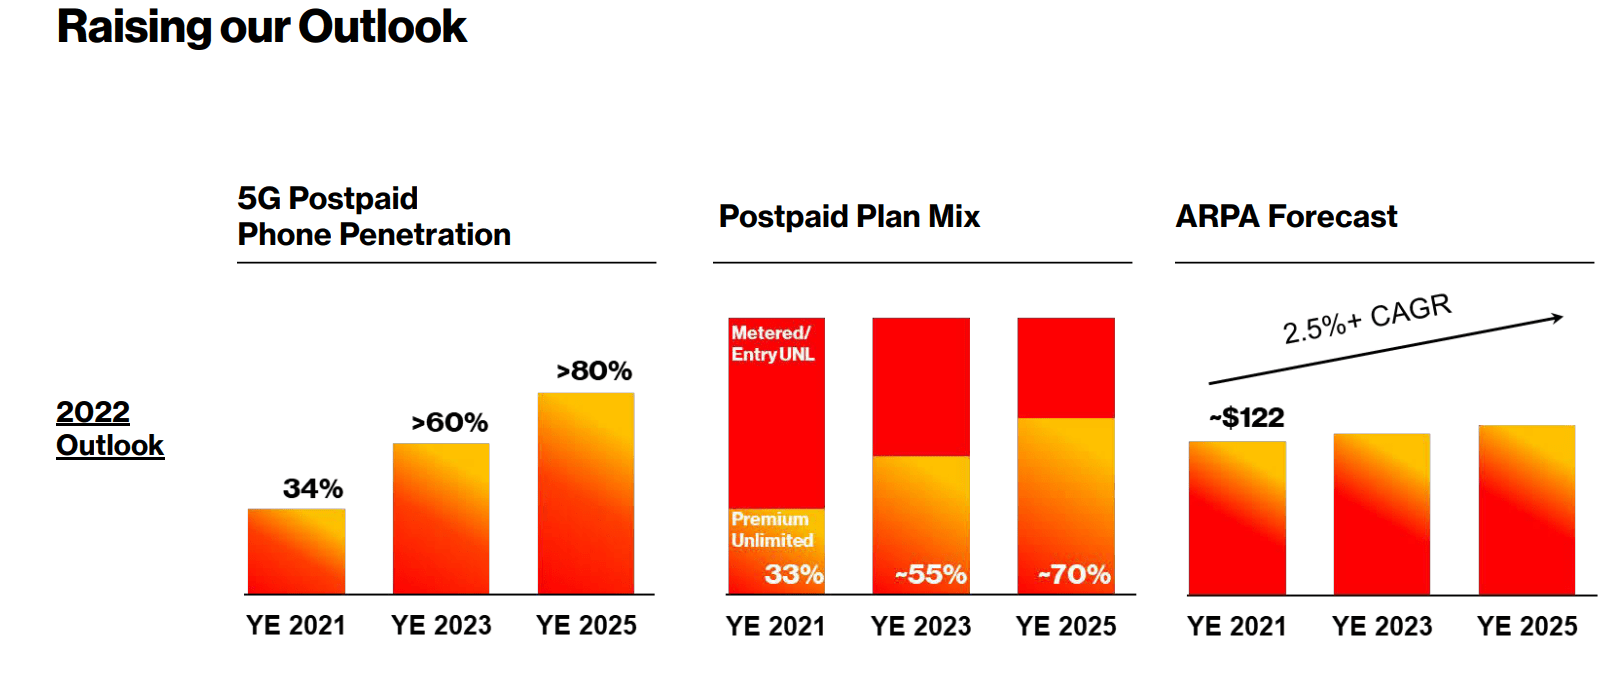
Management’s long-term plan is to execute strongly on 5G, convert its wireless business to higher-end accounts, (unlimited plans), and thus grow revenue per account by 2.5% or more over time.
- pre-paid wireless revenue is expected to grow 3% CAGR
(Source: investor presentation)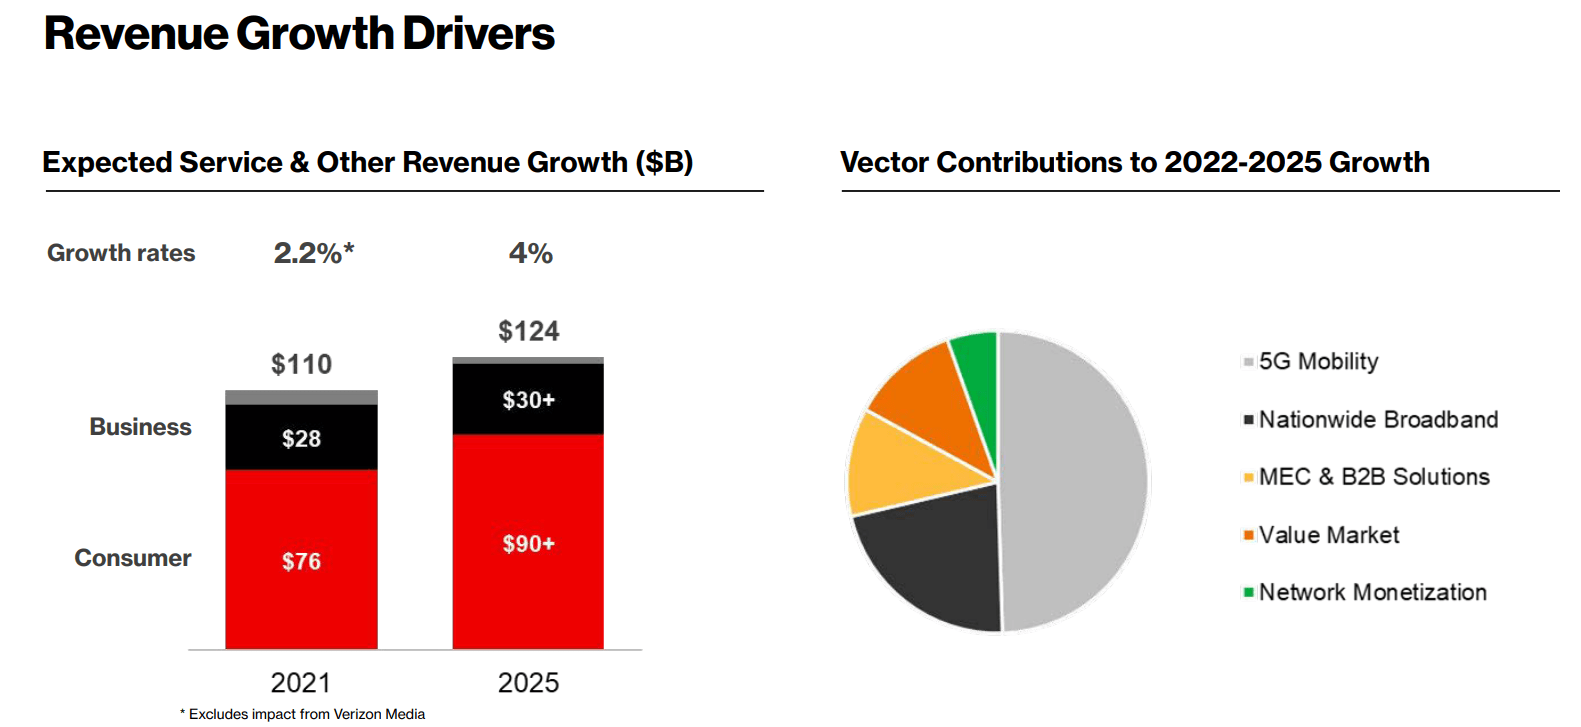
Company-wide management thinks they can accelerate sales growth to 4% annually by 2025.
- analysts think this can be done while maintaining strong and stable profitability
(Source: investor presentation)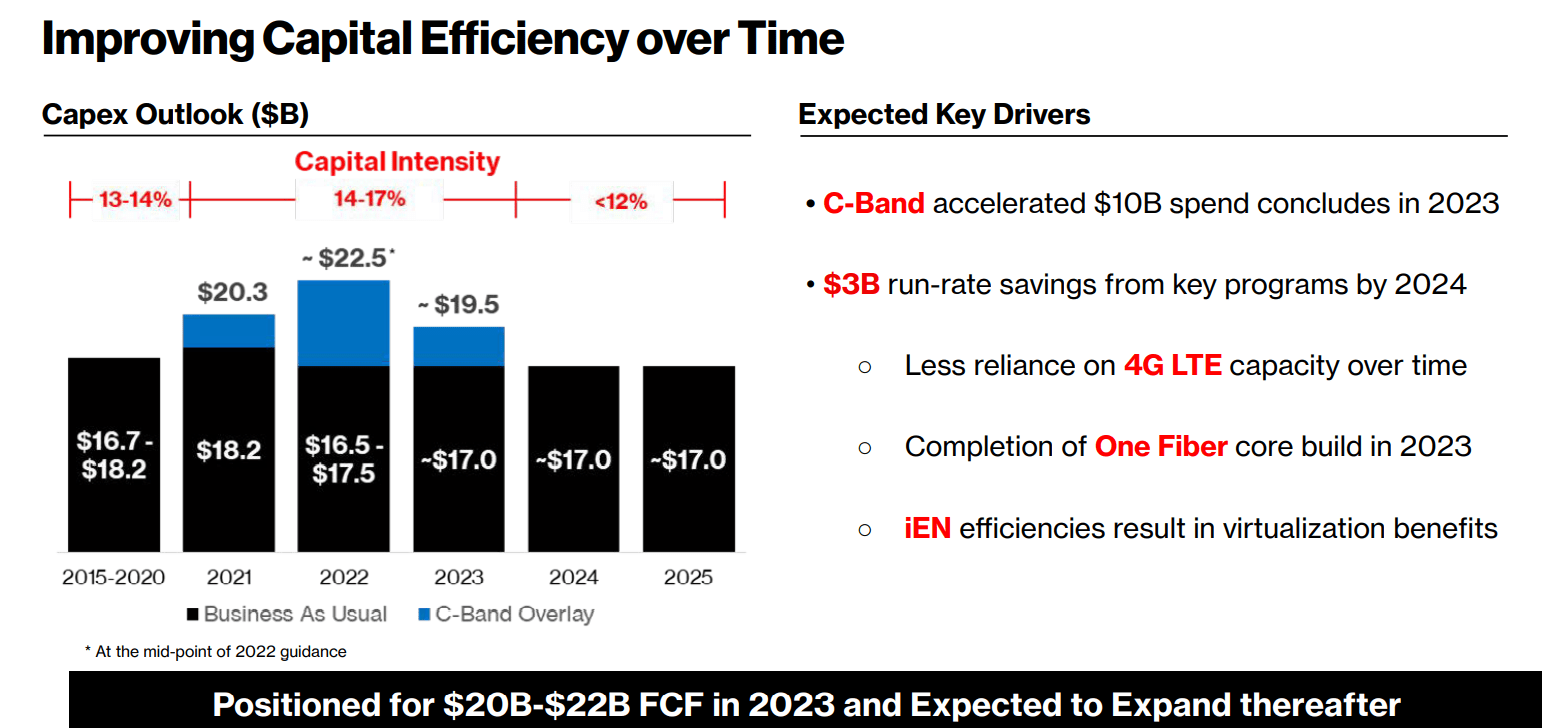
After an initially high spending plan for the 5G transition ($92.3 billion between 2021 and 2023), VZ thinks it can execute its growth plan at a cost of $17 billion per year.
- less than 12% of annual revenue
- with rising economies of scale over time
(Source: investor presentation)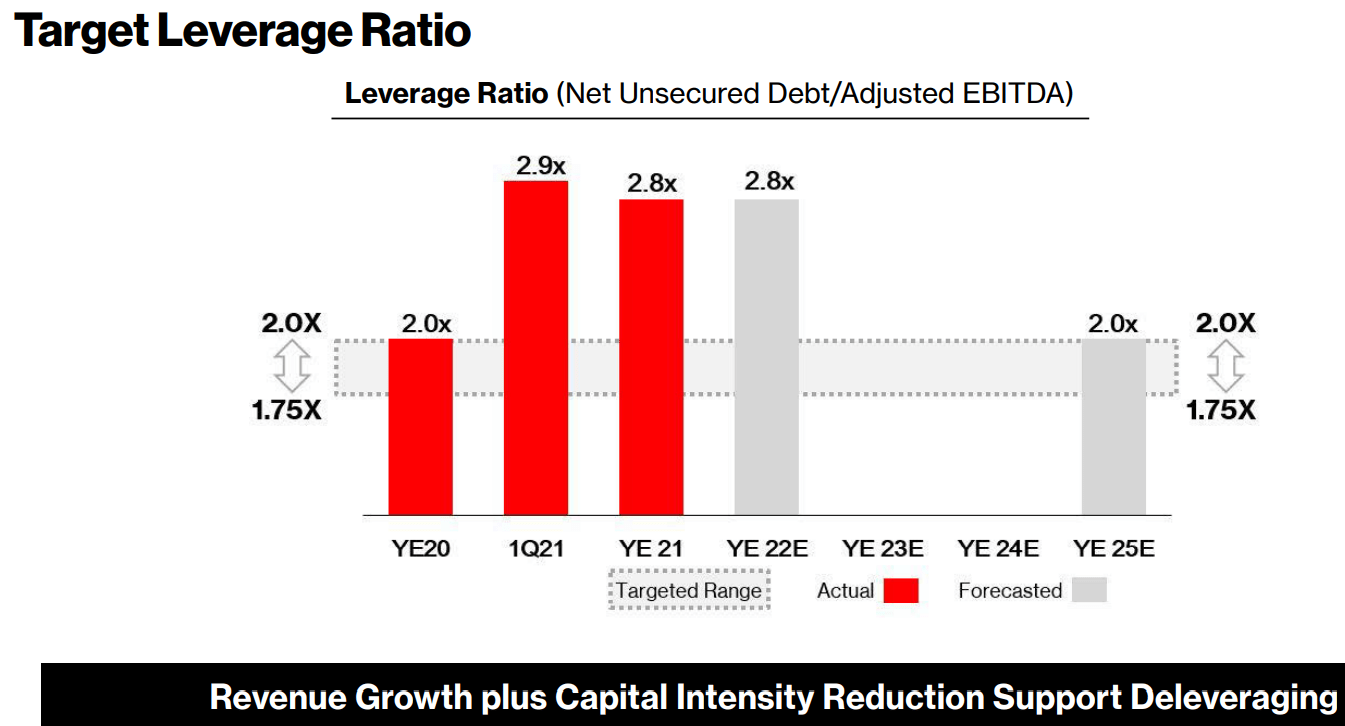
Over the long-term management is targeting 1.75 to 2X debt/EBITDA, a very safe leverage ratio.
- 3.5 or less is safe for telecoms according to rating agencies
(Source: investor presentation)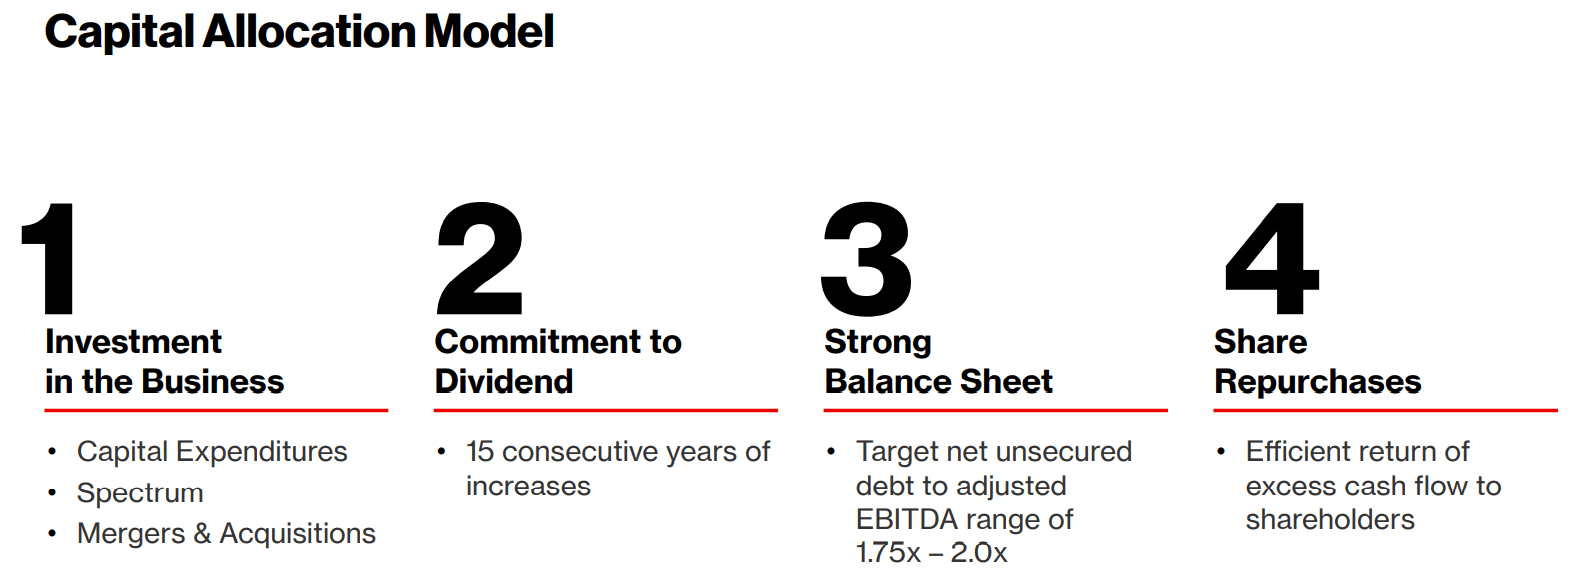
VZ’s capital allocation priorities are reasonable and prudent for a high-yield blue-chip.
- growth the business
- grow the dividend
- deleverage to target 1.75 to 2X range
- buy back stock opportunistically
Management’s secondary goals include:
- accelerate revenue growth to 4% by 2025
- maintain EBITDA margins (so 4% cash flow growth as well)
Quantitative Analysis: The Math Backing Up The Investment Thesis
Ben Graham recommended combining qualitative (the story) analysis with quantitative analysis looking at the past, present, and likely future.
VZ Credit Ratings
| Rating Agency | Credit Rating | 30-Year Default/Bankruptcy Risk | Chance of Losing 100% Of Your Investment 1 In |
| S&P | BBB+ Stable Outlook | 5.00% | 20.0 |
| Fitch | A- Stable Outlook | 2.50% | 40.0 |
| Moody’s | Baa1 (BBB+ equivalent) Stable Outlook | 5.00% | 20.0 |
| Consensus | BBB+ Stable Outlook | 4.17% | 24.0 |
(Source: S&P, Fitch, Moody’s)
Rating agencies estimate VZ’s fundamental risk at 4.2% or a 1 in 24 chance of losing all your money over the next 30 years.
VZ Leverage Consensus Forecast
| Year | Debt/EBITDA | Net Debt/EBITDA (3.5 Or Less Safe According To Credit Rating Agencies) |
Interest Coverage (4+ Safe) |
| 2020 | 2.74 | 2.27 | 6.78 |
| 2021 | 3.12 | 3.06 | 9.31 |
| 2022 | 3.04 | 3.00 | 9.47 |
| 2023 | 2.85 | 2.76 | 9.50 |
| 2024 | 2.87 | 2.52 | 8.68 |
| 2025 | 2.75 | 2.21 | 9.60 |
| 2026 | 2.62 | 1.99 | 11.90 |
| 2027 | 2.39 | NA | NA |
| Annualized Change | -1.93% | -2.18% | 9.83% |
(Source: FactSet Research Terminal)
Analysts expect VZ to achieve its long-term debt/EBITDA target range in 2026 when adjusting for cash.
Overall steady but slow decrease in leverage (taken on for 5G and the pandemic) and strong growth in interest coverage.
VZ Balance Sheet Consensus Forecast
| Year | Total Debt (Millions) | Cash | Net Debt (Millions) | Interest Cost (Millions) | EBITDA (Millions) | Operating Income (Millions) |
| 2020 | $129,062 | $22,171 | $106,891 | $4,247 | $47,060 | $28,798 |
| 2021 | $150,868 | $2,921 | $147,947 | $3,485 | $48,400 | $32,448 |
| 2022 | $149,487 | $3,971 | $147,867 | $3,410 | $49,223 | $32,299 |
| 2023 | $145,219 | $7,724 | $140,774 | $3,563 | $50,930 | $33,858 |
| 2024 | $150,868 | $11,626 | $132,510 | $4,081 | $52,550 | $35,405 |
| 2025 | $150,868 | $28,985 | $121,578 | $3,922 | $54,949 | $37,664 |
| 2026 | $150,868 | $38,927 | $114,706 | $3,296 | $57,656 | $39,235 |
| 2027 | $150,868 | $86,208 | NA | NA | $63,036 | $43,260 |
| Annualized Growth | 2.26% | 21.41% | 1.18% | -4.14% | 4.26% | 5.99% |
(Source: FactSet Research Terminal)
Debt is expected to grow at 2% over time, while cash flows grow about 2X to 2.5X as fast.
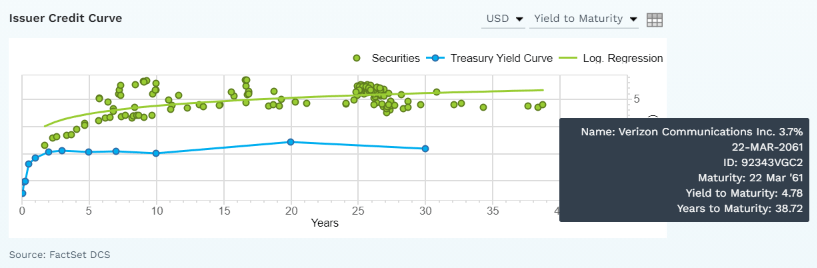
VZ Bond Profile
(Source: FactSet Research Terminal) (Source: FactSet Research Terminal)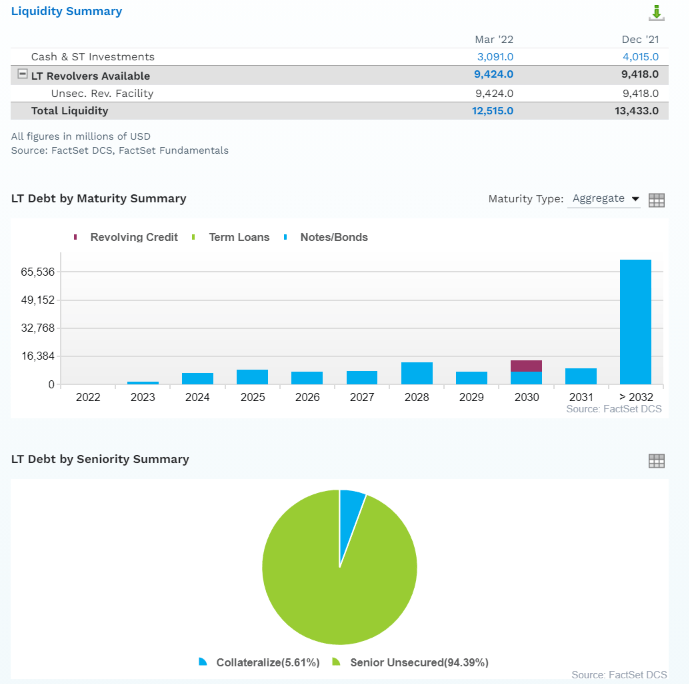
- $12.5 billion in liquidity
- well-staggered bond maturities (no problem refinancing maturing debt)
- 94% unsecured bonds for very good financial flexibility
- bond investors are so confident in VZ’s long-term prospects they are willing to lend to it for 38 years at 4.8% (3.7% originally)
- the average borrowing cost is 1.76%
- -0.7% after the bond market’s 30-year inflation expectations
- -.7% real borrowing costs vs 4.5% cash returns on invested capital
VZ Credit Default SWAPs: Real-Time Fundamental Risk Analysis From The Bond Market
(Source: FactSet Research Terminal)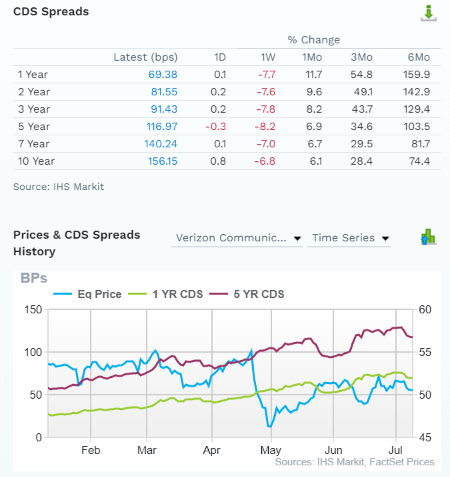
Credit default SWAPs are the insurance policies bond investors take out against default.
- they represent real-time fundamental risk assessment from the “smart money” on Wall Street
- VZ’s fundamental risk have increased significantly in the last six months
- the bond market is pricing in a 4.7% 30-year default risk, which is consistent with its BBB+ credit rating
- basically, analysts, rating agencies, and the bond market all agree
- VZ’s thesis is intact
- 29 analysts, 8 rating agencies, and the bond market make up our VZ expert consensus
- 37 expert consensus + the bond market monitoring VZ’s risk profile
- how we track fundamental risk in real-time
- to ensure high-probability/low-risk investment recommendations
VZ GF Score: The Newest Addition To The DK Safety And Quality Model
The GF Score is a ranking system that has been found to be closely correlated to the long-term performances of stocks by backtesting from 2006 to 2021.” – Gurufocus
GF Score takes five key aspects into consideration. They are:
- Financial Strength
- Profitability
- Growth
- Valuation
- Momentum
(Source: Gurufocus Premium)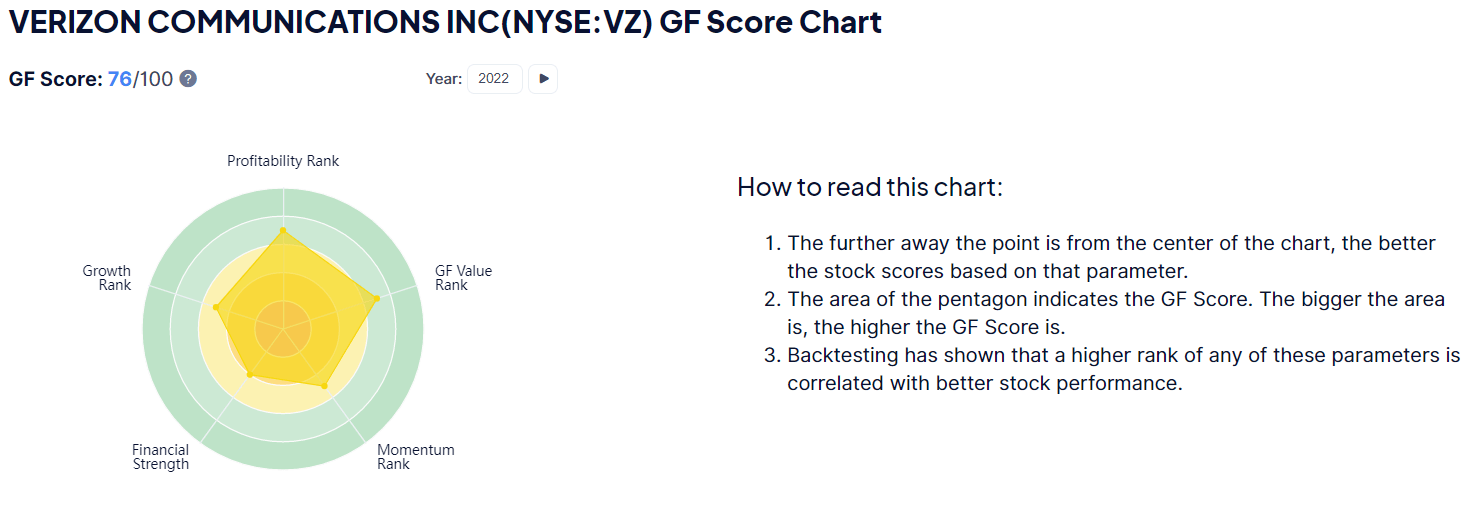
VZ’s excellent score of 76/100 confirms its strong fundamental quality and highly attractive valuation.
VZ Profitability: Wall Street’s Favorite Quality Proxy
(Source: GuruFocus Premium)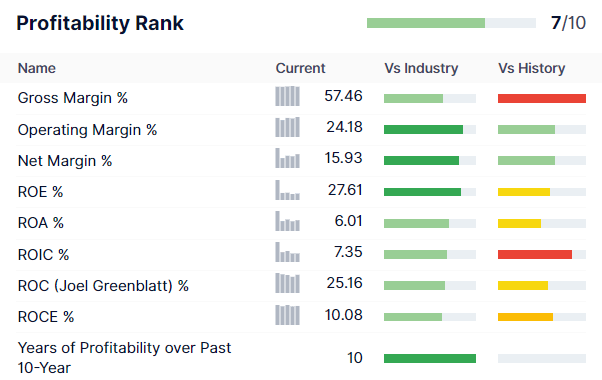
VZ’s profitability is historically in the top 30% of peers.
VZ Trailing 12-Month Profitability Vs Peers
| Metric | TTM | Industry Percentile | Major Telecom Companies More Profitable Than VZ (Out Of 410) |
| Gross Margins | 57.46% | 64.27 | 146 |
| Operating Margin | 24.18% | 85.86 | 58 |
| Net Margin | 15.93% | 81.14 | 77 |
| Return On Equity | 27.61% | 82.94 | 70 |
| Return On Assets | 6.01% | 70.24 | 122 |
| Returns On Invested Capital | 7.35% | 68.14 | 131 |
| Return On Capital (Greenblatt) | 25.16% | 66.5 | 137 |
| Return On Capital Employed | 10.08% | 62.34 | 154 |
| Average | 21.72% | 72.68 | 112 |
(Source: GuruFocus Premium)
In the last year, VZ’s average profitability was in the 73rd industry percentile.
Ycharts
Over the last 35 years, VZ’s industry-leading margins have remained relatively stable, confirming a narrow and stable moat.
VZ Profit Margin Consensus Forecast
| Year | FCF Margin | EBITDA Margin | EBIT (Operating) Margin | Net Margin | Return On Capital Expansion |
Return On Capital Forecast |
| 2020 | 18.4% | 36.7% | 22.4% | 14.3% | 1.19 | |
| 2021 | 14.4% | 36.2% | 24.3% | 16.6% | TTM ROC | 25.16% |
| 2022 | 11.8% | 35.9% | 23.6% | 16.2% | Latest ROC | 21.17% |
| 2023 | 14.7% | 36.4% | 24.2% | 16.7% | 2027 ROC | 29.85% |
| 2024 | 17.0% | 36.8% | 24.8% | 17.0% | 2027 ROC | 25.11% |
| 2025 | 18.0% | 37.7% | 25.9% | 17.6% | Average | 27.48% |
| 2026 | 19.4% | 39.7% | 27.0% | 18.8% | Industry Median | 14.64% |
| 2027 | 20.8% | 42.0% | 28.8% | 19.6% | VZ/Industry Median | 1.88 |
| Annualized Growth | 1.82% | 1.95% | 3.63% | 4.59% | Vs S&P | 1.88 |
| Annualized Growth (Post Pandemic) | 6.35% | 2.49% | 2.89% | 2.75% |
(Source: FactSet Research Terminal)
VZ’s margins are expected to grow steadily over time, especially free cash flow margins which are expected to hit almost 21% by 2027.
- Approaching Apple-like (AAPL) FCF margins
Returns on capital are expected to grow 19% over the next five years, to around 28%.
- return on capital is Joel Greenblatt’s gold standard proxy for quality and moatiness
- annual pretax profit/the money it takes to run the business
- 40% annual returns for 21 years
- one of the greatest investors in history
- S&P 500 ROC is 14.6%
- the average S&P investment takes about 7 years to pay for itself
- VZ’s ROC is expected to grow to remain around 28%
- with investments paying for themselves in four years
- about 2X better than its industry peers and 2X the S&P 500’s
(Source: GuruFocus Premium)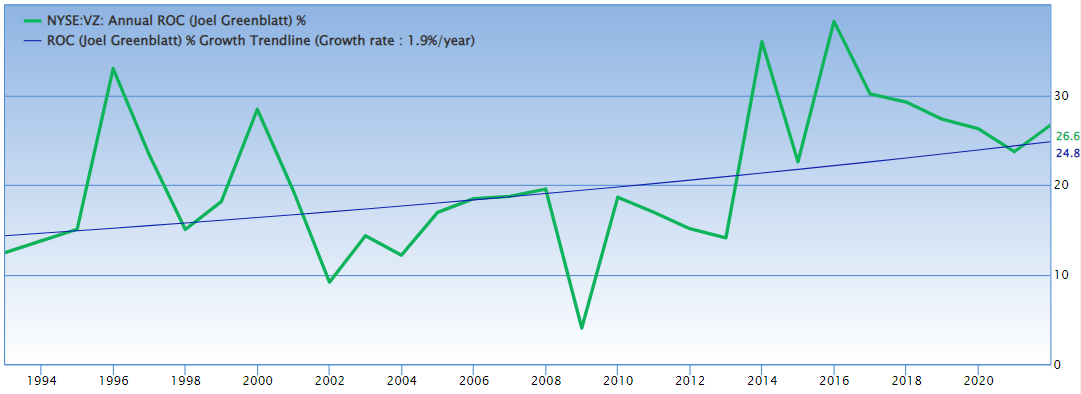
VZ’s ROC has been trending higher at 1.9% annually for the last three decades.
- further confirming the narrow and stable moat
Reason Three: Slow But Steady Growth Prospects For Decades To Come
Verizon has never been a fast-growing company, but a boring and beautiful high-yield, low volatility defensive blue-chip. That’s not expected to change anytime soon.
VZ Medium-Term Growth Consensus Forecast
| Year | Sales | Free Cash Flow | EBITDA | EBIT (Operating Income) | Net Income |
| 2020 | $128,300 | $23,576 | $47,060 | $28,798 | $18,350 |
| 2021 | $133,600 | $19,253 | $48,400 | $32,448 | $22,227 |
| 2022 | $136,923 | $16,094 | $49,223 | $32,299 | $22,127 |
| 2023 | $139,764 | $20,601 | $50,930 | $33,858 | $23,373 |
| 2024 | $142,718 | $24,212 | $52,550 | $35,405 | $24,209 |
| 2025 | $145,635 | $26,272 | $54,949 | $37,664 | $25,694 |
| 2026 | $145,246 | $28,159 | $57,656 | $39,235 | $27,369 |
| 2027 | $150,139 | $31,298 | $63,036 | $43,260 | $29,393 |
| Annualized Growth | 2.27% | 4.13% | 4.26% | 5.99% | 6.96% |
| Annualized Growth (Post Pandemic) | 1.96% | 8.44% | 4.50% | 4.91% | 4.77% |
| Cumulative Over The Next 6 Years | $860,425 | $146,636 | $328,344 | $221,721 | $152,165 |
(Source: FactSet Research Terminal)
Analysts don’t think management will be able to accelerate sales growth to 4% over time, but 2% long-term top-line growth is expected.
The bottom line is expected to grow at 4.5% with free cash flow growing around 8.5% annually.
$147 billion in cumulative consensus free cash flow over the next six years compared to $152 billion in net profit.
- 97% earnings to free cash flow conversion ratio is excellent for this industry and blue-chip in general
VZ Dividend Growth Consensus Forecast
| Year | Dividend Consensus | FCF/Share Consensus | FCF Payout Ratio | Retained (Post-Dividend) Free Cash Flow | Buyback Potential | Debt Repayment Potential |
| 2022 | $2.58 | $3.92 | 65.8% | $5,628 | 2.65% | 3.8% |
| 2023 | $2.63 | $4.99 | 52.7% | $9,912 | 4.67% | 6.8% |
| 2024 | $2.69 | $5.87 | 45.8% | $13,356 | 6.30% | 9.2% |
| 2025 | $2.78 | $6.30 | 44.1% | $14,784 | 6.97% | 9.8% |
| 2026 | $2.80 | $6.70 | 41.8% | $16,380 | 7.72% | 10.9% |
| 2027 | $2.85 | $7.43 | 38.4% | $19,236 | 9.07% | 12.8% |
| Total 2022 Through 2027 | $16.33 | $35.21 | 46.4% | $79,296.00 | 37.39% | 54.60% |
| Annualized Rate | 2.01% | 13.64% | -10.24% | 27.87% | 27.87% | 27.63% |
(Source: FactSet Research Terminal)
70% is the safety guideline for payout ratios for telecoms according to rating agencies. VZ’s peak payout ratio in this capex cycle is 66% and that’s expected to fall to 38% by 2027 thanks to incredible FCF/share growth of 13.6% compared to modest 2% annual dividend growth.
Over the next five years, VZ’s average 46% FCF payout ratio means $79 in post-dividend retained cash flow, which is enough to pay off 55% of debt or buy back up to 37% of shares at current valuations.
VZ Buyback Consensus Forecast
| Year | Consensus Buybacks ($ Millions) | % Of Shares (At Current Valuations) | Market Cap |
| 2022 | $0.0 | 0.0% | $212,082 |
| 2023 | $0.0 | 0.0% | $212,082 |
| 2024 | $333.0 | 0.2% | $212,082 |
| 2025 | $2,000.0 | 0.9% | $212,082 |
| Total 2022-2027 | $2,333.00 | 1.1% | $212,082 |
| Annualized Rate | 0.25% | Average Annual Buybacks | $583.25 |
(Source: FactSet Research Terminal)
Analysts don’t expect VZ to start buying back shares until 2024 and then accelerate repurchases in 2025.
Ycharts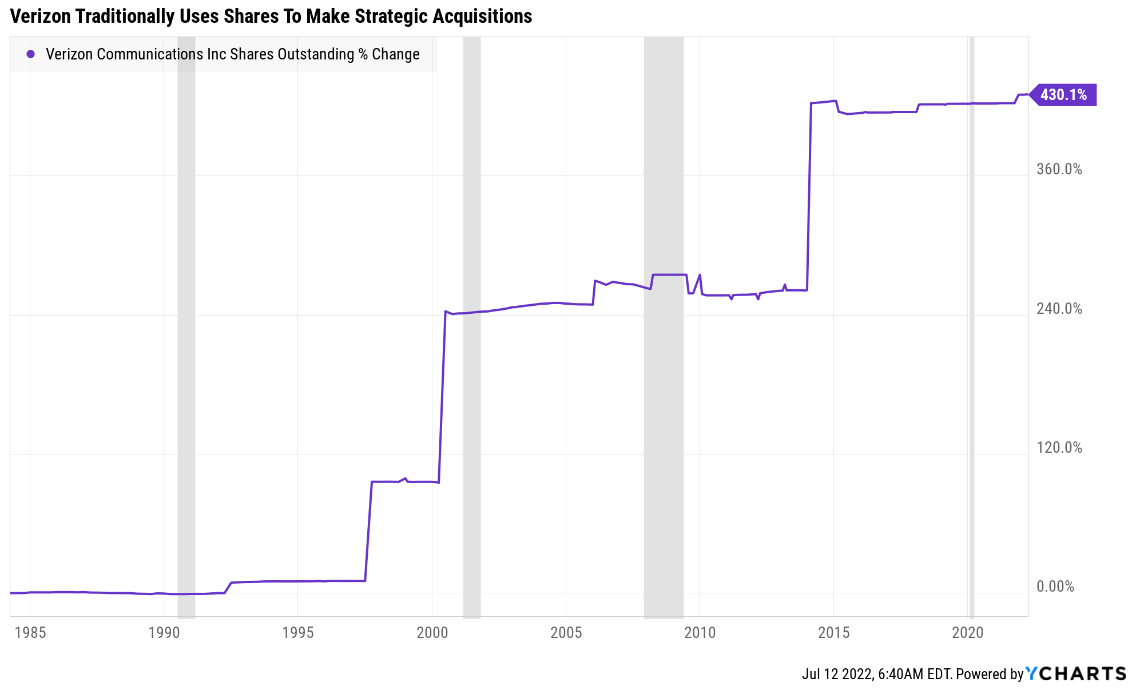
VZ traditionally uses shares as part of mega-deals such as the $130 billion purchase of the 45% stake in Verizon Wireless from Vodafone (VOD) in 2013.
VZ Long-Term Growth Outlook
(Source: FactSet Research Terminal)
- 3.5% to 4.0% growth consensus range (five sources)
- the median consensus from all 29 analysts is 4.0%
- the growth rate over the last 20 years was 3.73% CAGR
- analysts think VZ can keep growing at its historical rate for the foreseeable future
How accurate are analyst forecasts for VZ (partially based on management guidance)?
FAST Graphs, FactSet Research FAST Graphs, FactSet Research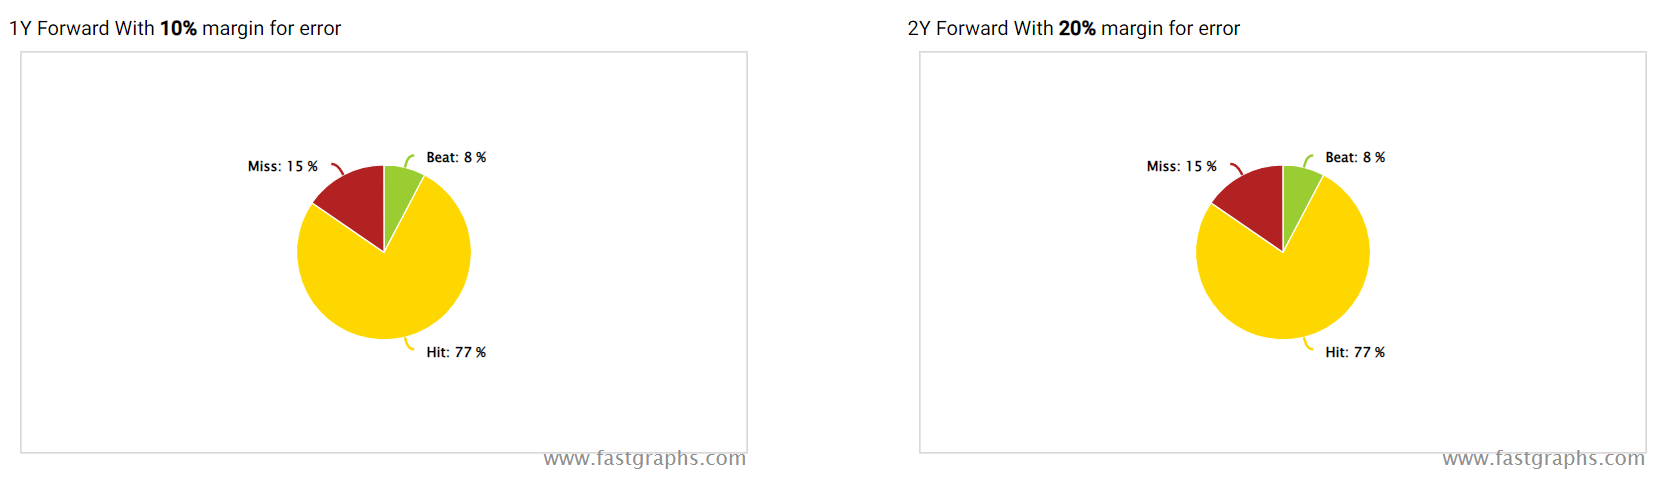

- Smoothing for outliers historical analyst margins-of-error are 10% to the downside and 15% to the upside
- margin-of-error adjusted consensus growth range: 3% to 5% CAGR
- 70% statistical probability that VZ grows 3% to 5% over time
FAST Graphs, FactSet Research FAST Graphs, FactSet Research FAST Graphs, FactSet Research FAST Graphs, FactSet Research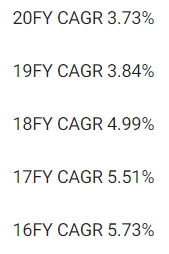
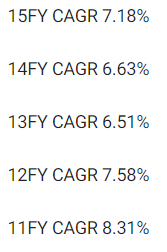
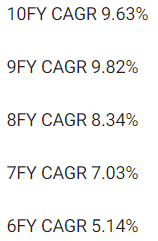
VZ’s historical growth rates are 3.7% to 10% and analysts expect growth to be similar to the last 20 years.
- a very stable and relatively predictable business over time
Reason Four: A Wonderful Company At A Wonderful Price
(Source: FAST Graphs, FactSet) (Source: FAST Graphs, FactSet) (Source: FAST Graphs, FactSet)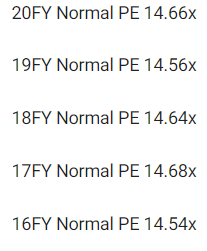
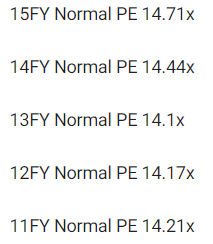
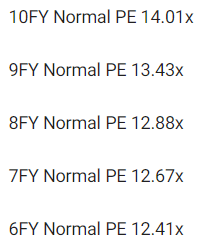
VZ’s historical fair value range is 12.5X to 14.5X earnings, but it has seen significant multiple compression over time.
Thus we’re using the low end of historical fair value combined with historical yield (which gives a more conservative estimate) to estimate fair value.
| Metric | Historical Fair Value Multiples (9-Years) | 2021 | 2022 | 2023 | 2024 | 2025 |
12-Month Forward Fair Value |
| 5-Year Average Yield | 4.44% | $57.21 | $57.66 | $57.66 | $60.59 | $62.61 | |
| 13-Year Median Yield | 4.44% | $57.21 | $57.66 | $57.66 | $60.59 | $62.61 | |
| 25-year Average Yield | 4.39% | $57.86 | $58.31 | $58.31 | $61.28 | $63.33 | |
| Earnings | 12.41 | $66.89 | $67.26 | $68.88 | $70.67 | $68.50 | |
| Average | $59.53 | $59.97 | $60.28 | $63.01 | $64.17 | $60.13 | |
| Current Price | $50.50 | ||||||
|
Discount To Fair Value |
15.17% | 15.79% | 16.23% | 19.86% | 21.31% | 16.02% | |
|
Upside To Fair Value (NOT Including Dividends) |
17.88% | 18.75% | 19.37% | 24.77% | 27.07% | 19.07% (24% including dividend) | |
| 2021 EPS | 2022 EPS | 2021 Weighted EPS | 2022 Weighted EPS | 12-Month Forward EPS | 12-Month Average Fair Value Forward PE |
Current Forward PE |
|
| $5.42 | $5.55 | $2.61 | $2.88 | $5.49 | 11.0 | 9.2 |
I estimate VZ is historically worth about 11X earnings and today it trades at just 9.2X.
- 7.7X cash-adjusted earnings
- anti-bubble valuation by even private equity standards
|
Analyst Median 12-Month Price Target |
Morningstar Fair Value Estimate |
| $57.24 (10.4 PE) | $59 (10.8 PE) |
|
Discount To Price Target (Not A Fair Value Estimate) |
Discount To Fair Value |
| 11.77% | 14.41% |
|
Upside To Price Target (Not Including Dividend) |
Upside To Fair Value (Not Including Dividend) |
| 13.35% | 16.83% |
|
12-Month Median Total Return Price (Including Dividend) |
Fair Value + 12-Month Dividend |
| $59.80 | $61.56 |
|
Discount To Total Price Target (Not A Fair Value Estimate) |
Discount To Fair Value + 12-Month Dividend |
| 15.55% | 17.97% |
|
Upside To Price Target ( Including Dividend) |
Upside To Fair Value + Dividend |
| 18.42% | 21.90% |
Morningstar’s discounted cash flow model estimates VZ is worth 10.8X earnings, matching our estimate.
Analysts think VZ will trade at 10.4X earnings in 12 months generating an 18% total return.
- 24% total return would be justified by fundamentals
I never recommend companies based on 12-month forecasts but on whether the margin of safety sufficiently compensates you for a company’s risk profile.
| Rating | Margin Of Safety For Low-Risk 12/13 Super SWAN quality companies | 2022 Price | 2023 Price |
12-Month Forward Fair Value |
| Potentially Reasonable Buy | 0% | $59.97 | $60.28 | $60.13 |
| Potentially Good Buy | 10% | $53.97 | $54.25 | $54.12 |
| Potentially Strong Buy | 20% | $47.97 | $48.23 | $48.10 |
| Potentially Very Strong Buy | 30% | $37.78 | $42.20 | $42.09 |
| Potentially Ultra-Value Buy | 40% | $35.98 | $36.17 | $36.08 |
| Currently | $50.50 | 15.79% | 16.23% | 16.02% |
| Upside To Fair Value (Not Including Dividends) | 18.75% | 19.37% | 19.07% |
For anyone comfortable with its risk profile VZ is a potentially good buy.
Risk Profile: Why Verizon Isn’t For Everyone
There are no risk-free companies and no company is right for everyone. You have to be comfortable with the fundamental risk profile.
What Could Cause VZ’s Investment Thesis To Break
- safety falls to 40% or less
- balance sheet collapses (highly unlikely, 4.2% probability according to rating agencies)
- major failed acquisition (not likely, VZ is focused on its core business and regulators won’t allow it to merge with AT&T or T-Mobile)
- growth outlook falls to less than 2.9% for six years
- VZ’s role in my portfolio is to deliver long-term 8+% returns with minimal fundamental risk
- 8+% total return requirement for defensive sectors (including midstream)
- 10+% for non-defensive (cyclical) sectors – like industrials
How long it takes for a company’s investment thesis to break depends on the quality of the company.
| Quality |
Years For The Thesis To Break Entirely |
| Below-Average | 1 |
| Average | 2 |
| Above-Average | 3 |
| Blue-Chip | 4 |
| SWAN | 5 |
| Super SWAN | 6 |
| Ultra SWAN | 7 |
| 100% Quality Companies (MSFT, LOW, and MA) | 8 |
These are my personal rule of thumb for when to sell a stock if the investment thesis has broken. VZ is highly unlikely to suffer such catastrophic declines in fundamentals.
Risk Profile Summary
- economic cyclicality risk: minimal (10% EPS decline in the Great Recession and +2% in the Pandemic)
- regulatory risk (potentially increasing costs and decreasing pricing power)
- capex risk: recent spectrum auctions set records for costs
- M&A execution risk (small tuck-in acquisitions)
- talent retention risk in the tightest job market in 50 years
- cyber-security risk: hackers and ransomware
- disruption risk: T-Mobile is going hard into 5G home internet and could pressure margins, Amazon (AMZN) and SpaceX are planning to launch low-cost satellite internet
How do we quantify, monitor, and track such a complex risk profile? By doing what big institutions do.
Long-Term Risk Analysis: How Large Institutions Measure Total Risk
- see the risk section of this video to get an in-depth view (and link to two reports) of how DK and big institutions measure long-term risk management by companies
VZ Long-Term Risk-Management Consensus
| Rating Agency | Industry Percentile |
Rating Agency Classification |
| MSCI 37 Metric Model | 92.0% |
AA Industry Leader, Positive Trend |
| Morningstar/Sustainalytics 20 Metric Model | 88.3% |
18.5/100 Low-Risk |
| Reuters’/Refinitiv 500+ Metric Model | 93.0% | Excellent |
| S&P 1,000+ Metric Model | 37.0% |
Below-Average, Stable Trend |
| Just Capital 19 Metric Model | 100.0% |
#1 Industry Leader, Stable Trend |
| FactSet | 50.0% |
Average, Stable Trend |
| Morningstar Global Percentile (All 15,000 Rated Companies) | 80.7% | Very Good |
| Just Capital Global Percentile (All 954 Rated US Companies) | 99.1% | Excellent |
| Consensus | 80% |
Low-Risk, Very Good Risk-Management, Stable Trend |
(Sources: Morningstar, FactSet, S&P, Reuters)
VZ’s Long-Term Risk Management Is The 80th Best In The Master List (84th Percentile)
| Classification | Average Consensus LT Risk-Management Industry Percentile |
Risk-Management Rating |
| S&P Global (SPGI) #1 Risk Management In The Master List | 94 | Exceptional |
| Verizon | 80 | Very Good |
| Strong ESG Stocks | 78 |
Good – Bordering On Very Good |
| Foreign Dividend Stocks | 75 | Good |
| Ultra SWANs | 71 | Good |
| Low Volatility Stocks | 68 | Above-Average |
| Dividend Aristocrats | 67 | Above-Average |
| Dividend Kings | 63 | Above-Average |
| Master List average | 62 | Above-Average |
| Hyper-Growth stocks | 61 | Above-Average |
| Monthly Dividend Stocks | 60 | Above-Average |
| Dividend Champions | 57 | Average bordering on above-average |
(Source: DK Research Terminal)
VZ’s risk-management consensus is in the top 16% of the world’s highest quality companies and similar to that of such other blue-chips as
- Philip Morris International (PM) – dividend king
- Canadian National Railway (CNI) – dividend aristocrat
- Dover (DOV) – dividend king
- Target (TGT) – dividend king
- Automatic Data Processing (ADP) – dividend king
- Visa (V)
- Qualcomm (QCOM)
- Apple (AAPL)
The bottom line is that all companies have risks, and VZ is very good, at managing theirs.
How We Monitor VZ’s Risk Profile
- 29 analysts
- 3 credit rating agencies
- 8 total risk rating agencies
- 37 experts who collectively know this business better than anyone other than management
- and the bond market for real-time fundamental risk updates
“When the facts change, I change my mind. What do you do sir?” – John Maynard Keynes
There are no sacred cows at iREIT or Dividend Kings. Wherever the fundamentals lead we always follow. That’s the essence of disciplined financial science, the math behind retiring rich and staying rich in retirement.
Bottom Line: 5.1% Yielding Verizon Is A Retirement Recession Dream Stock
Bear markets are scary enough, but recessionary bear markets can be downright terrifying. Not only can stocks fall deeper and harder than is reasonable, but you also have to worry about job losses and millions suffer when the economy contracts.
Are we headed for a recession? The bond market thinks so, and so do most CEOs and CFOs. But that doesn’t mean we’re headed for a repeat of 2008, far from it.
Deutsche Bank
Deutsche Bank is one of the 16 most accurate economist teams in the world according to MarketWatch (which monitors their forecasts). They are part of the blue-chip consensus and their most recent forecast is for a mild recession in 2023, that sees GDP contract 3.5% at its peak but just 0.5% for the full year.
- the 2nd mildest recession in history
- behind 2001’s 0.4% contraction
I can confirm through that my own comprehensive monthly deep dive on the economy confirms that there are no indications that another financial crisis or economic catastrophe is looming.
What does a mild recession likely mean for the market in the short-term? Well, earnings are likely to contract by 10% to 20%.
Daily Shot
Morgan Stanley, another blue-chip economist team, estimates a 20% decrease in 2023 EPS relative to current expectations.
Stock valuations have come down at a very rapid rate. But the S&P only fell to a PE of 15.3, and the historical average for trough PEs in recessions is 13 to 15. So if earnings fall significantly, stocks could too.
- another 10% to 35% according to the blue-chip consensus, depending on how the economy and earnings perform
| Time Frame | Historically Average Bear Market Bottom |
| Non-Recessionary Bear Markets Since 1965 | -21% (Achieved May 20th) |
| Median Recessionary Bear Market Since WWII | -24% (Citigroup base case with a mild recession) Achieved June 16th |
| Non-Recessionary Bear Markets Since 1928 | -26% (Goldman Sachs base case with a mild recession) |
| Average Bear Markets Since WWII | -30% (Morgan Stanley base case, no recession) |
| Recessionary Bear Markets Since 1965 | -36% (Bank of America recessionary base case) |
| All 140 Bear Markets Since 1792 | -37% |
| Average Recessionary Bear Market Since 1928 |
-40% (Deutsche Bank, Bridgewater, SocGen Severe Recessionary base case, Morgan Stanley Recessionary Base Case) |
|
(Sources: Ben Carlson, Bank of America, Oxford Economics, Goldman Sachs) |
The worst-case scenario forecast from the blue-chip consensus is a 48% peak decline, from Societe General that includes a long, severe, stagflationary hell.
Such forecasts are scary, and when stocks fall six straight days in a row (-4%) as they recently did, it’s easy to become super pessimistic.
But this is where low volatility, defensive high-yield, and highly undervalued blue-chips like Verizon can help.
I can’t tell you when the bear market will end, or when a recession might or might begin.
Nobody can predict interest rates, the future direction of the economy or the stock market. Dismiss all such forecasts and concentrate on what’s actually happening to the companies in which you’ve invested.” – Peter Lynch (emphasis added)
But guess what I can tell you with high confidence about Verizon.
- lowest PE in 20 years
- yield in the 82nd percentile for the last 25 years
Here’s what else I can tell you with high confidence about VZ right now.
- VZ is one of the world’s safest, most dependable, and highest quality companies on earth
- top 30% of the world’s best blue-chips
- 5.1% steadily growing very safe yield expected to grow 2% over time
- 9.1% CAGR long-term total return potential similar to the last 37 years
- low 18% average annual volatility
- 16% discount to fair value = potential good buy
- 7.2X cash-adjusted earnings = anti-bubble blue-chip bargain
- about 100% consensus return potential over the next five years, 14% CAGR, about 2X more than the S&P 500
- 36% better risk-adjusted expected returns of the S&P 500 over the next five years with 2.5X higher consensus dividend income
If you want to sleep well at night while enjoying generous, very safe, and steadily growing income in all economic conditions, consider Verizon.
If you like the idea of buying one of the world’s best companies at the best valuation in 20 years, Verizon might be for you.
If you want to stop praying for luck on Wall Street, and start making your own, then Verizon might be just the very safe high-yield blue-chip you’re looking for.
Be the first to comment