

David Ramos/Getty Images News
Investment Thesis
Leading Telco behemoth Verizon Communications Inc. (NYSE:VZ) stock has been battered since reaching its highs in November 2020. Before Warren Buffett’s Berkshire (BRK.A) (BRK.B) divested most of its stake in CQ1’22, VZ had already moved into a dominant bearish bias.
The market has been pricing in worsening macro headwinds that could impact Verizon’s profitability further, coupled with rising inflation. Recent price hikes by the leading carriers also need to be monitored carefully on the impact on their revenue growth. Moreover, the recessionary effects on its bottom line could be considerable given Verizon’s fixed costs leverage.
Our valuation model indicates that the market has been pricing in the normalization of its growth and expecting VZ to underperform.
Our price action analysis suggests that VZ is still deeply mired in bearish momentum. However, a recent bear trap (significant rejection of selling momentum) in early May helped sustain its intermediate support ($45.5). However, another lower-high bull trap (significant rejection of buying momentum) formed recently. Therefore, the price action signals don’t augur well for VZ.
As such, we rate VZ as a Sell, leveraging its bearish bias, as the market adjusts its expectations on Verizon.
Verizon’s Growth Is Expected To Normalize
Verizon revenue change % and adjusted EBIT change % consensus estimates (S&P Cap IQ)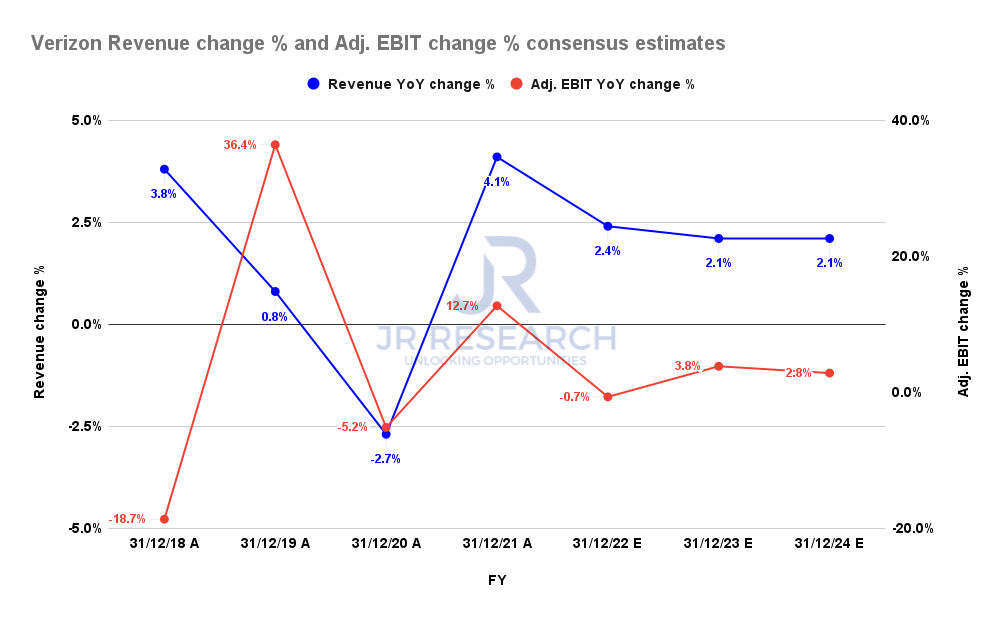
Verizon posted revenue growth of 4.1% in FY21 after recovering from the mayhem in 2020. But, investors should note that Verizon delivered a revenue CAGR of 1.2% and 1.9% over the past five and ten years, respectively. Therefore, the Street expects VZ’s growth to normalize, coupled with worsening macro headwinds.
The consensus estimates (generally neutral) project Verizon to post revenue growth of 2.4% in FY22 before normalizing to 2.1% in FY24.
Verizon adjusted EBIT margins % and FCF margins % consensus estimates (S&P Cap IQ)
Notwithstanding, Verizon’s adjusted EBIT margins are expected to remain stable through FY24. Its free cash flow (FCF) profitability is also likely to remain robust.
Therefore, we don’t think investors should be unduly concerned over its massive debt load of $182.3B reported last quarter. In addition, its operating cash flow is estimated to be more than sufficient to cover its interest expense (TTM: $3.17B), as seen in its FCF margins. As a result, Verizon’s profitability profile is expected to remain healthy.
But VZ’s Price Action Is Not Constructive
VZ price chart (TradingView)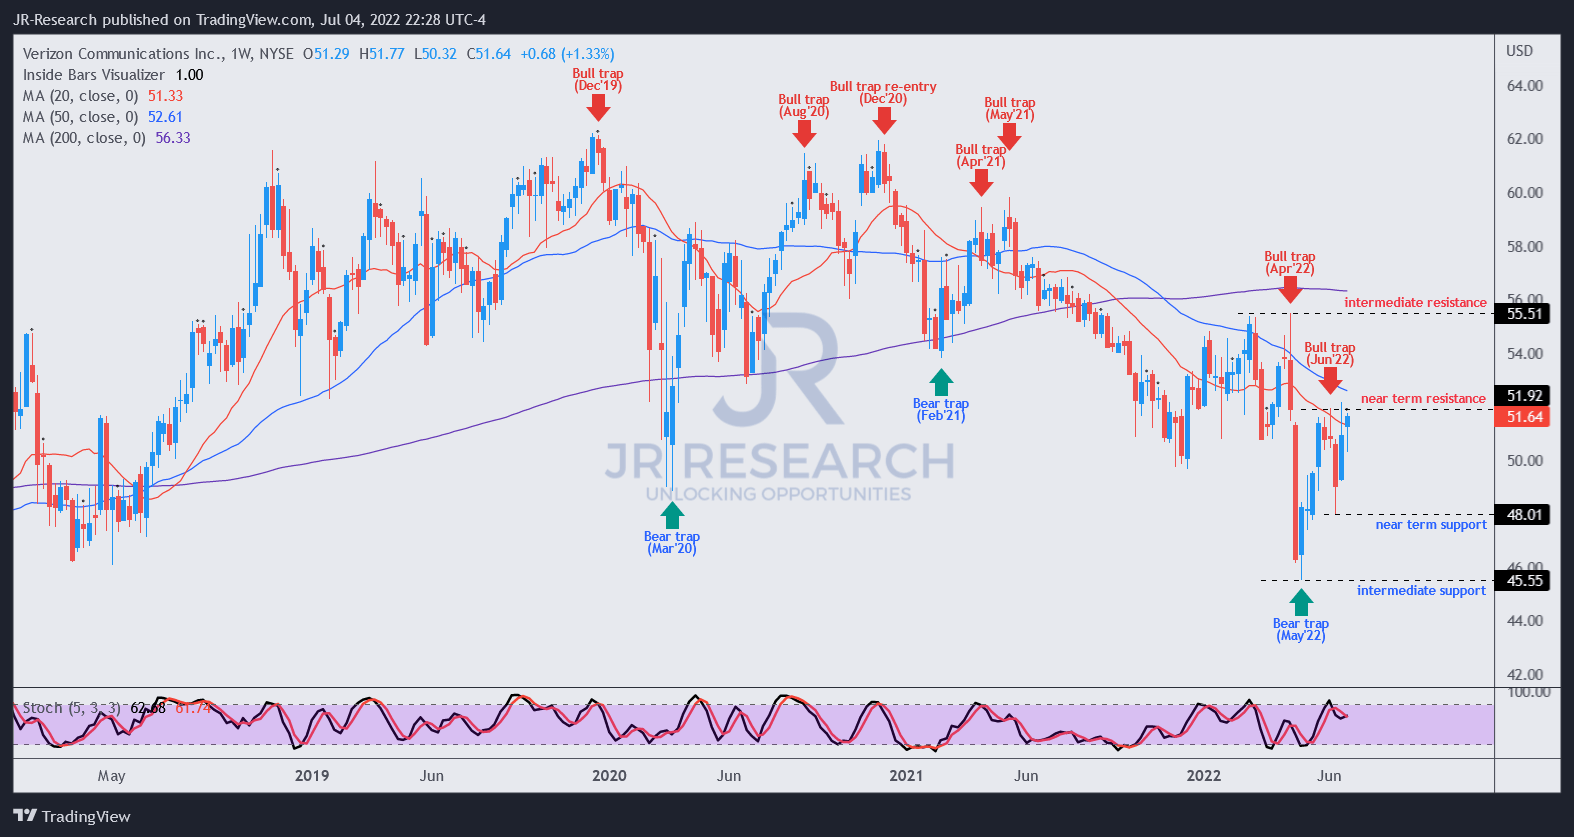
Notably, VZ had already lost its bullish momentum since September 2021. The series of bull traps in 2021 set the stage for the market to digest its recovery from its March 2020 COVID bear trap.
Furthermore, a subsequent bull trap in April 2022 sent VZ into a rapid liquidation and prevented a retaking of its bullish bias. Although a bear trap formed in May 2022 that helped form its intermediate support ($45.5), further buying cadence was rejected by another bull trap in June.
Therefore, we believe the price action signals by the market have been unambiguous. It wants to keep VZ entrenched in a bearish bias, and the proper set-ups are to sell/cut exposure into its rallies or execute directionally bearish trades.
VZ Could Underperform Significantly
| Stock | VZ |
| Current market cap | $216.87B |
| Hurdle rate (CAGR) | 7.67% |
| Projection through | CQ4’26 |
| Required FCF yield in CQ4’26 | 8.17% |
| Assumed TTM FCF margin in CQ4’26 | 15.2% |
| Implied TTM revenue by CQ4’26 | $162.47B |
VZ reverse cash flow valuation model. Data source: S&P Cap IQ, author
We applied a hurdle rate of 7.67%, equivalent to VZ’s 5Y total return CAGR (adjusted for dividends). We also used the 5Y mean of its FCF yield of 8.17% and thus require Verizon to post a TTM revenue of $162.47B by CQ4’26.
It also implies a revenue CAGR of 4.38% from FY22-26, which is unlikely, according to the revised consensus estimates.
VZ last traded at an FCF yield of 9.2%, higher than its 5Y mean. Yet, the recent bull trap in June formed at a yield of 9%. Coupled with its bearish bias, we believe the market expects VZ to underperform its 5Y average returns significantly at the current levels.
Is VZ Stock A Buy, Sell, Or Hold?
We rate VZ a Sell.
Our valuation model suggests that VZ could likely underperform markedly at its current levels.
Our price action analysis indicates the correct set-ups should have a bearish bias, selling into its rallies/bull traps. We encourage investors to watch for the re-test of its intermediate support before considering adding exposure.
Be the first to comment