


Daria Kulkova/iStock via Getty Images
Foreign stocks are beating the S&P 500 lately as the U.S. dollar drops and some value sectors outperform growth areas like Information Technology and Consumer Discretionary. After an impressive rally off its October low, is Santa Claus going to come down the chimney for VEA bulls? Let’s find out.
Dollar Falls, VEA Rallies

Stockcharts.com
According to Vanguard, the Vanguard FTSE Developed Markets ETF (NYSEARCA:VEA), a passively managed index ETF, seeks to track the investment performance of the FTSE Developed All Cap ex US Index. It’s a low-cost and liquid way to get exposure to a portfolio of a diversified group of stocks of large-, mid-, and small-cap companies located in Canada and the major markets of Europe and the Pacific region.
The fund features an annual expense ratio of just 0.05% with a median 30-day bid/ask spread of just two basis points. With a 50-day average volume of more than 18 million shares, the stock indeed has high tradability for short-term traders. For long-term investors, a low turnover rate of just 3.1% makes it efficient tax-wise. Vanguard lists the P/E ratio at just 11.9 and the fund has a high yield compared to the US market of 3.9%, according to Morningstar.
Digging into the portfolio, VEA is a large-cap blended fund – slightly smaller in its average market cap and less growth-oriented than the S&P 500. What’s more, the largest position in VEA is Nestle SA at just 1.6% compared to the top-heavy SPX.
VEA: Portfolio Factor Profile & Key Statistics

Morningstar
Stepping back from VEA, long-term investors should appreciate the relative inexpensiveness of foreign stocks. According to Yardeni Research, the All-Country World Index has a near-average 14.9 forward price-to-earnings ratio – that is propped up by domestic stocks, which carry a somewhat lofty 17.5 forward multiple. EAFE equities, which VEA generally tracks although not precisely, have a much more reasonable 12.5 P/E while Emerging Markets are even cheaper. Some of the variance can be explained by sector differences as the U.S. market is comprised of high-growth (high-multiple) industries.
Ex-USA Stocks Relatively Cheap
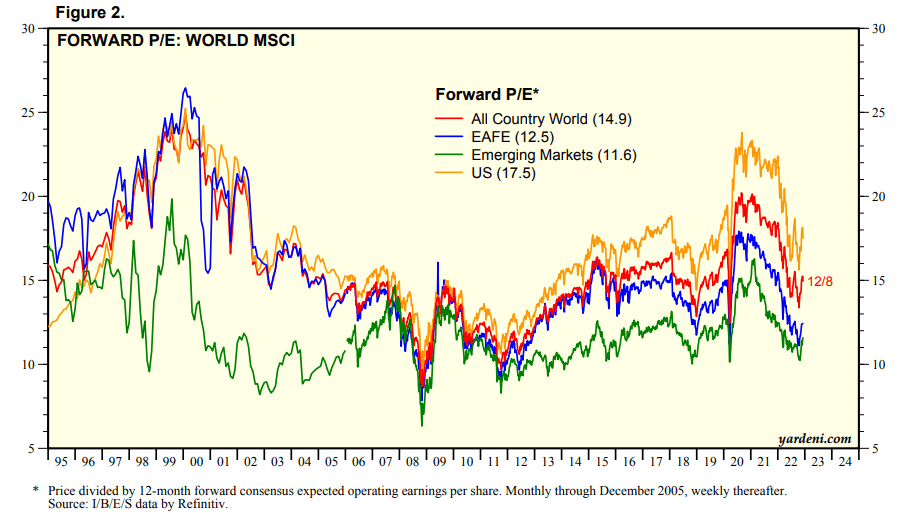
Yardeni Research
Looking at relative price action, this is where things begin to get interesting for VEA. The fund is stuck in a long-term downtrend against the U.S. stock market – for more than 15 years now. If we zoom in to just the past three years, though, VEA appears to be breaking out from its relative downtrend line. I would like to see the relative chart of VEA to SPY rise above a double-top pattern put in earlier this year, but this is a bullish chart for VEA.
Foreign Vs. USA: Highest Since June

Stockcharts.com
With a relative breakout underway, how does the absolute chart of VEA appear? This look suggests caution. First, notice how the ETF put in a bearish false breakout above its August peak a few days ago. I think shares could continue lower to fill a gap from November near $40. The fund is also back below its still-falling 200-day moving average after poking through it in December. Next, volume was on the decline all during the price recovery from October 13 through the middle of this month – the bulls would have liked to see that move come on bigger volume. Finally, the RSI indicator at the top of the chart, like price lately, shows a bearish false breakout.
It is not all doom and gloom, though. I see a significant amount of volume by price down to the upper 30s, so further downside from here should be minor. A break below the October low could lead to a return to its downtrend support line, which is now in the low $30s.
VEA: Bearish False Breakout Near Term

Stockcharts.com
The Bottom Line
I like the long-term valuation on VEA and its solid tradability. The near-term chart is concerning, so waiting to see how this potential false breakout plays out is the prudent move.
Be the first to comment