

The road covered with leaves in the woods corradobarattaphotos/iStock via Getty Images
Yield Hunt Takes Me to Canada
To diversify away from the US stock markets, I have been exploring other stock markets this month in search of better yield. Thus far, I have analyzed the UAE (UAE), Japan (EWJ), Turkey (TUR), China (MCHI) and Pacific markets (VPL). In this article, I now circle back to the United States’ northern neighbor; Canada. Specifically, the yield-rich (dividend-heavy) part of Canada.
Access Canada’s Dividends With VDY
The Vanguard FTSE Canada High Dividend Yield Index ETF (TSX:VDY:CA) tracks the FTSE Canada High Dividend Yield Index. Here’s what its composition looks like:
VDY ETF Composition
Sector Composition
On a sectoral level, banks make up almost 46% of the overall weight in VDY:
VDY Sector Exposure (VDY ETF Website, Author’s Analysis)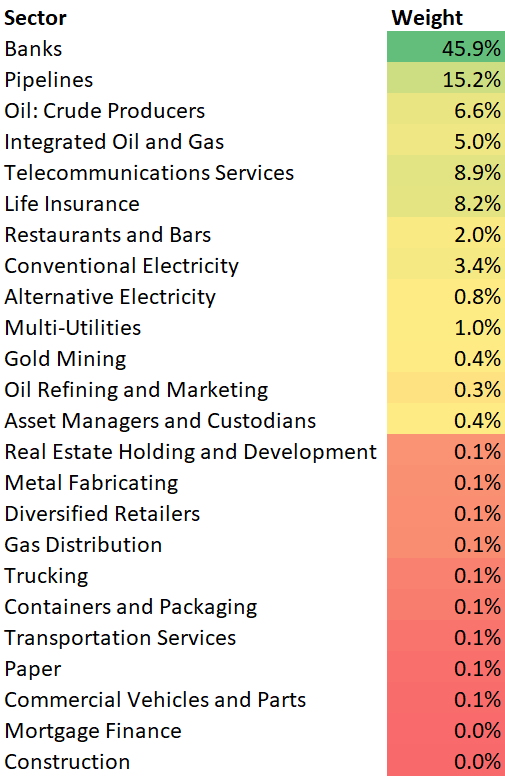
Overall, VDY is quite concentrated towards banks and midstream O&G via pipelines; together, these sectors make up 61.1% of the overall index.
Top 5 Holdings
The top 5 holdings are also concentrated, making up almost 48% of the overall ETF:
VDY Top 5 Holdings (VDY ETF Website, Author’s Analysis)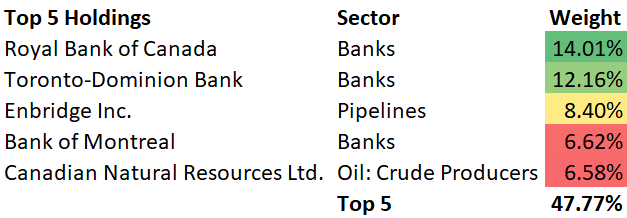
Even within the top 5 holdings, banks make up almost 69% of the overall exposure. The top 5 holdings are Royal Bank of Canada (RY) (RY:CA), Toronto-Dominion Bank (TD) (TD:CA), Enbridge (ENB) (ENB:CA), Bank of Montreal (BMO) (BMO:CA), and Canadian Natural Resources (CNQ) (CNQ:CA).
Canadian Banks May Rise on Higher Rates
Financials generally make better net interest margins on the loans when interest rates rise. Bond yields are correlated to interest rates. Currently, the Canadian 10yr bond yield is in an upward flow and hence has a decent chance of climbing:
Canadian 10yr bond yield (TradingView, Author’s Analysis)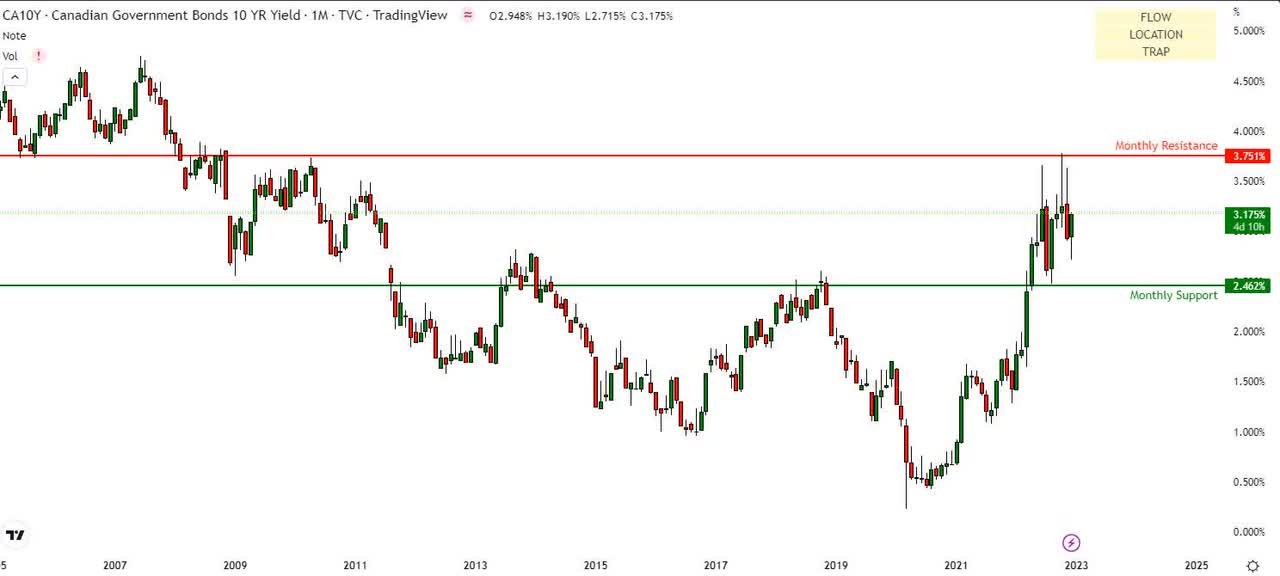
The Bank of Canada’s moves will be a critical monitorable to get an informed view of the interest rate prospects. In their latest December 2022 press release, comments slanted hawkish, that is favoring further interest rate hikes:
Looking ahead, we will be considering whether the policy interest rate needs to rise further to bring supply and demand back into balance and return inflation to target.
– Deputy Governor Kozicki’s speech
O&G Production Projected to Grow
The International Energy Agency prescribed that the world’s oil and gas industry needs to spend an additional $466 billion (50% of what it currently spends) from now till 2030 to meet global O&G demand efficiently. Capital expenditure by some private exploration and production companies is expected to increase by 10-15%. Just today, Macquarie group came out with research that suggests that private O&G upstream companies are expected to send US oil production to record levels in 2023.
This will benefit other players in the O&G value chain. For example, midstream O&G, which includes pipelines would be large beneficiaries as business volumes increase. I have done an analysis of a midstream O&G ETF, AMZA (AMZA) here. O&G drilling and service companies will also benefit from increased upstream activities. You can check out my view on the OIH Oil Services ETF (OIH) here. On the drilling side, I have published a deep dive on NOV (NOV) here.
Altogether, what does this mean for VDY? Well, given around 27% exposure to O&G, including 15.2% exposure to the specific part of O&G that benefits from increased volumes, I would say this paints a bullish picture.
Given those fundamental tailwinds, let’s now look at what the sentiment of the crowd can tell us:
If this is your first time reading a Hunting Alpha article using technical analysis, you may want to read this post, which explains how and why I read the charts the way I do, utilizing the principles of Flow, Location, and Trap.
Read of Relative Money Flow
VDY vs SPX500 Technical Analysis (TradingView, Author’s Analysis)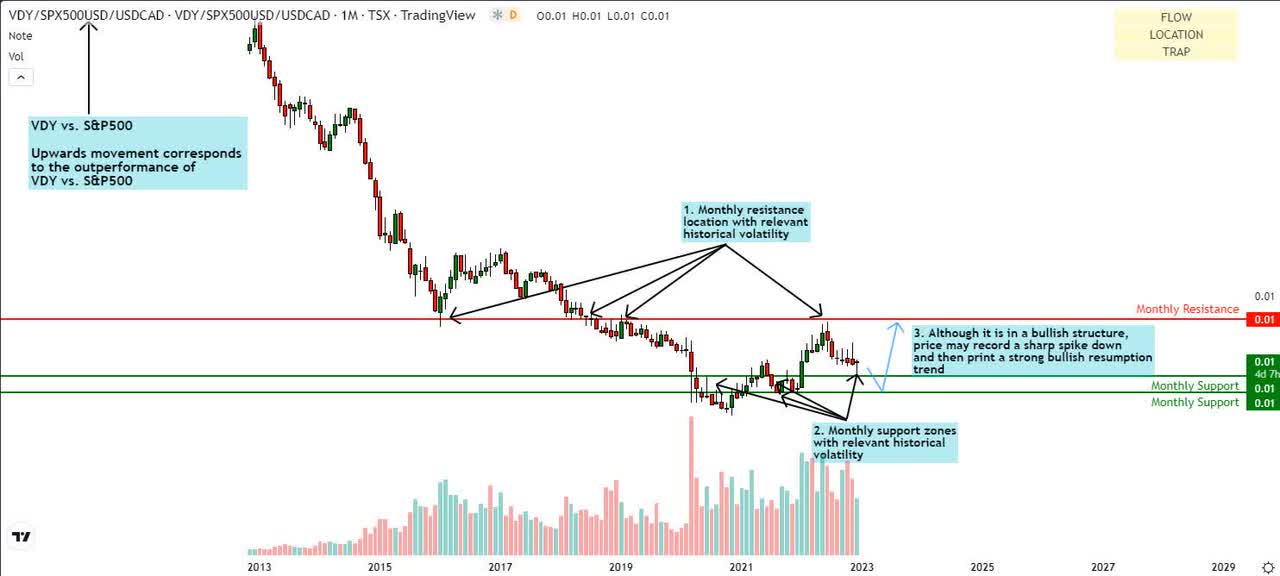
In assessing the VDY/S&P500 pair, I took the currency differences between USD and CAD into account. Since the VDY is denominated in the Canadian Dollars (FXC) while the S&P500 is based on the US dollar (DXY), it is necessary to convert to one consistent currency. This can be done by taking the VDY/S&P500/USDCAD ratio.
The VDY relative to the S&P 500 has shown a steady bullish recovery through most of 2021 to mid-2022, where it kicked off a pullback following a rejection from the monthly resistance. Prices now are currently near monthly support, however, I do not see a clear evidence of a trap via something like a false breakout to the downside. Hence, as I must respect my analysis method, I am forced to remain on the sidelines for now with a ‘hold’ stance.
I envision that prices may drop down to the lower monthly support after which a strong bullish breakout may emerge erupt.
Read of Absolute Money Flow
VDY Technical Analysis (TradingView, Author’s Analysis)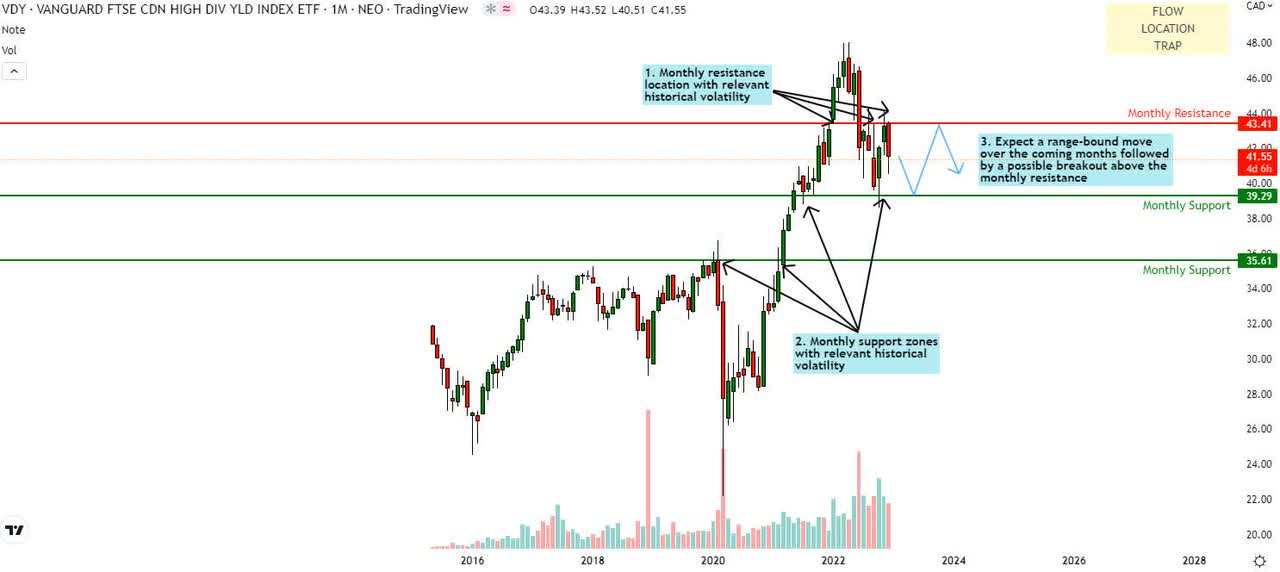
On an absolute basis, I expect a sideways pattern for a little while, which will build to a sharp move later on. The VDY recently got rejected at the critical $43.41 monthly resistance after a sharp recovery from the $39.29 support.
As highlighted in the chart, in 2023, I think we will see a pullback to the $39.29 monthly support mark followed by range-bound movement between the $43.42 resistance and the $39.29 support.
Thus, even in the absolute VDY chart, I lean towards a ‘hold’.
Summary
Despite bullish signs in the fundamentals via prospects of higher interest rates benefiting Canadian banks and increased O&G volumes benefiting midstream pipeline companies, the technical analysis read does not quite align with the bullish fundamentals just yet. Due to this lack of harmony, I am currently on the sidelines, eager to join in on the bullish sentiment, but patiently waiting for the stars to align.
Editor’s Note: This article discusses one or more securities that do not trade on a major U.S. exchange. Please be aware of the risks associated with these stocks.
Be the first to comment