

Khanchit Khirisutchalual
(This article was co-produced with Hoya Capital Real Estate)
Introduction
Environmental, Social, and Governance, referred to as ESG, investing is all the rage, both pro and con. The next chart shows fund-flows during 2021 for both ESG funds and Non-ESG funds.
lipperalpha.refinitiv.com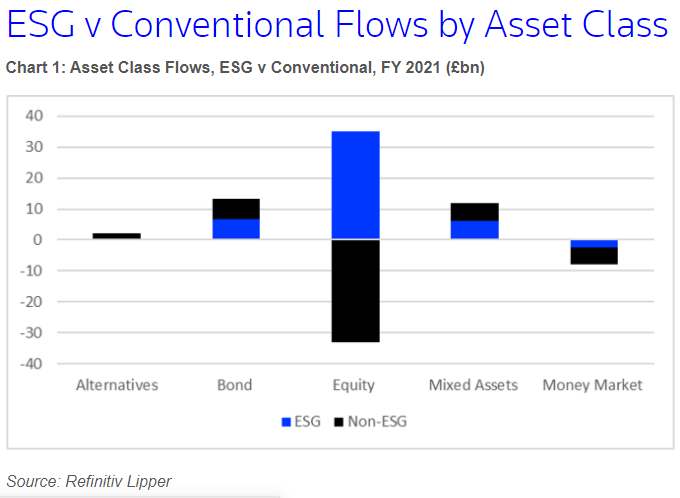
Overall, at the end of the 1st quarter of 2022, ESG funds held $343b in assets and represented about 11% of the total fund market. Does ESG investing work? This statement sums of the debate up nicely:
The explosive growth in ESG investing has created considerable confusion about what investors should actually expect. Academic studies that have examined how ESG factors relate to both corporate operating performance and investment outcomes have found mixed results. Effects on operating performance appear consistently (though not uniformly) positive and suggest companies with high ESG scores are better in a number of ways. The evidence on investment returns is more ambiguous – some studies find the stock prices of companies with high ESG ratings outperform, but others find no measurable effects, and some even document lower monetary returns.
Source: kenan Institute
In my eyes, for Fixed Income assets, the benefit would come via demand from “green investors”; but to the extent those companies could then issue debt with a lower coupons, funds holding them could see yields dampened.
Here we will compare two ETFs from Vanguard. Both have similar durations, an important data point to know when comparing bond funds; plus similar weighted credit rating on their portfolio; a second point of comparison to know. The funds I chose to compare are the:
- Vanguard ESG U.S. Corporate Bond ETF (BATS:VCEB)
- Vanguard Intermediate-Term Corporate Bond Index ETF (NASDAQ:VCIT)
Vanguard has another ETF, the Vanguard Total Corporate Bond ETF (VTC), which could have been used but it is not widely followed and I previously review that ticker.
Vanguard ESG U.S. Corporate Bond ETF review
Seeking Alpha describes this ETF as:
Vanguard ESG U.S. Corporate Bond ETF invests in U.S. dollar-denominated, taxable, investment-grade corporate bonds. It invests in securities with maturity of more than one year. The fund invests in securities of companies that are deemed socially conscious in their business dealings and directly promote environmental responsibility. It seeks to track the performance of the Bloomberg MSCI US Corporate SRI Select Index. VCEB started on 9/22/20.
Source: SeekingAlpha
VCEB has $320m in assets and provides a yield near 2.2%. Vanguard charges 12bps in fees.
A look at the underlying Index
VCEB invests based on the Bloomberg MSCI U.S. Corporate SRI Select Index, which Bloomberg describes as:
The Bloomberg MSCI US Corporate SRI Select Index is a USD-denominated benchmark that includes investment grade, fixed-rate and taxable corporate bonds from both developed and emerging markets issuers. The index follows the same general criteria as the Bloomberg US Corporate Index, but removes issuers with ties to thermal coal, oil and gas or those involved in certain controversial business lines. The index also excludes issuers with very severe ESG Controversies or Red Flags.
Source: Bloomberg MSCI ESG Fixed Income Indices
Included in that same document are Index rules, such as:
- Securities must be rated investment grade (Baa3/BBB-/BBB- or higher) using the middle rating of Moody’s, S&P and Fitch.
- SEC-registered securities, bonds exempt from registration at the time of issuance and SEC Rule 144A securities with registration rights are eligible.
- Coupon rules are:
- Fixed-rate coupon.
- Original zero coupon bonds are included.
- Callable fixed-to-floating rate bonds are eligible during their fixed-rate term only but must be removed one year prior to the changeover.
- Bonds with a step-up coupon that changes according to a predetermined schedule are eligible.
- At least one year until final maturity, regardless of optionality.
ESG restrictions include the following, with a general rule that restricted revenues must be under 10-15% of the company’s total revenue.
Restricted industries:
- Adult Entertainment
- Alcohol
- Gambling
- Weapons (Nuclear, Conventional, Controversial) + Civilian firearms
- Tobacco
- Nuclear Power and Fossil Fuels
- Genetically Modified Organisms
Other restrictions:
- Excludes all issuers without any women on the board of directors or missing MSCI diversity data.
- Excludes all researched companies involved in one or more very severe ESG Controversies.
I could not find a document that indicated how many companies were excluded by these rules.
VCEB holdings review
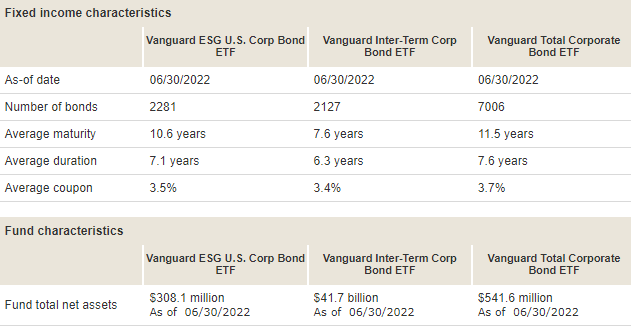
At the end of June, VCEB showed these statistics.
investor.vanguard.com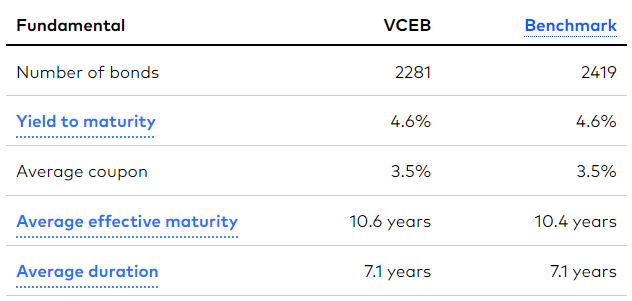
The credit rating allocation as of today is:
investor.vanguard.com VCEB ratings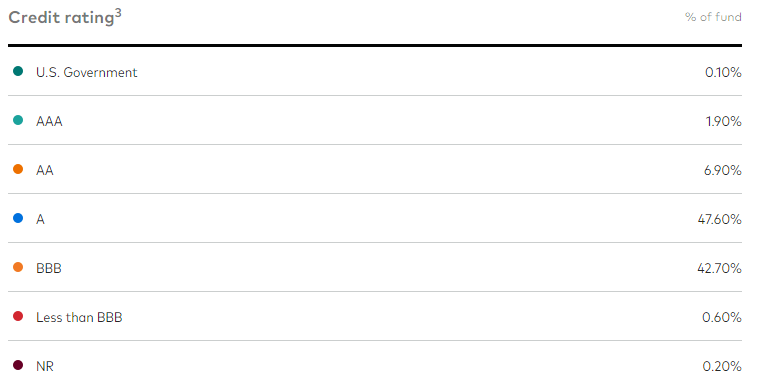
Source: ETF.com
A fraction of the bonds now have a rating below the minimum level of BBB; most likely on the block to be sold. While the rest are categorized as investment-grade, almost all of that weight is in the lowest ratings allowed.
investor.vanguard.com VCEB maturities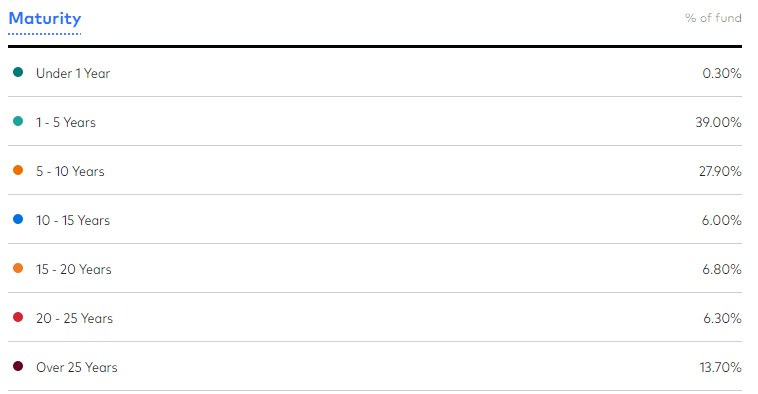
Depending where the 39% listed as maturing 1-5 years is, VCEB might be able to replace existing bonds with ones yielding more, which would allow for the yield to approve. VCEB says 44% of the weight was issued by Financial companies, 56% from Industrials.
Top holdings
Vanguard.com; compiled by Author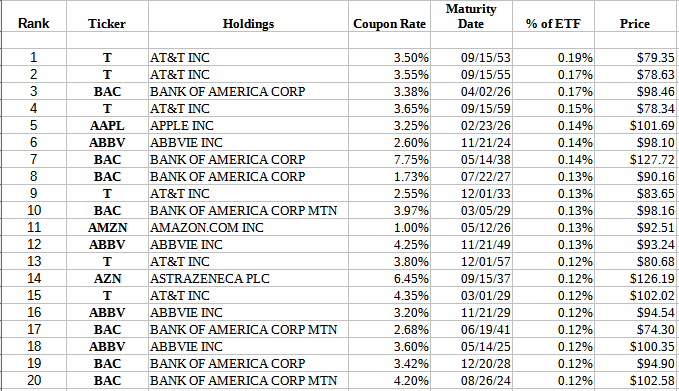
While no individual bond is over .19% of the portfolio, the same Issuer can have multiple bonds held and there are several cases of that in the above list.
advisors.vanguard.com VCEB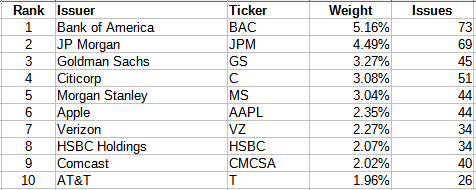
The above shows the largest percent allocations by Issuer and the number of different bonds held for each one. There are over 300 issuers used by VCEB.
VCEB distributions review
seekingalpha.com VCEB DVDs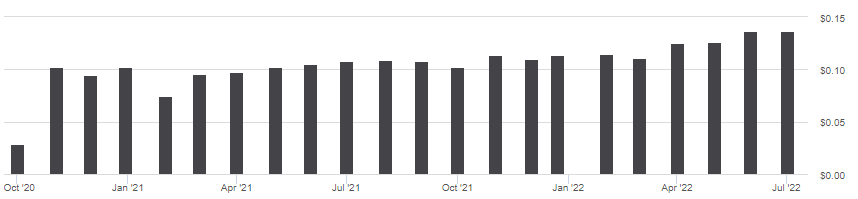
VCEB has shown some growth in its payouts as rates have climbed but more growth could depend on the level of portfolio turnover or AUM growth since few bonds mature in the near term. Seeking Alpha gives VCEB only a “C-” grade for their payout history, some of that is caused by their limited lifespan.
seekingalpha.com VCEB DVD scorecard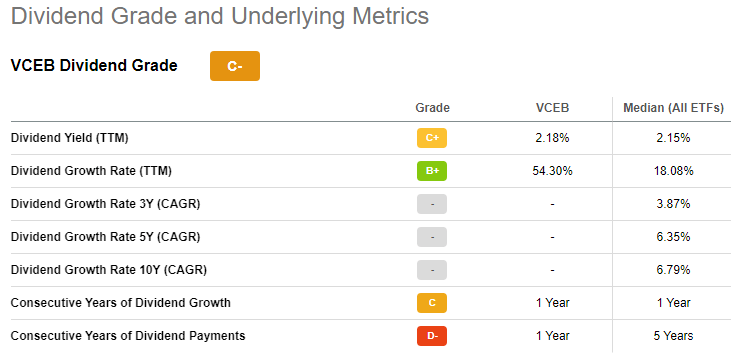
Vanguard Intermediate-Term Corporate Bond Index ETF review
Seeking Alpha describes this ETF as:
The Vanguard Intermediate-Term Corporate Bond ETF primarily invests in U.S. dollar-denominated investment-grade fixed income securities issued by industrial, utility, and financial companies with maturity of 5-10 years. The fund seeks to track the performance of the Bloomberg U.S. 5-10 Year Corporate Bond Index. VCIT started in 2009.
Source: seekingalpha.com VCIT
VCIT has $41.7b in assets and provides investors with a 3.3% yield. Vanguard fees are only 4bps. As is the case sometimes, I could not find a PDF describing the Index used by VCIT. Based on the name, it consists of bonds maturing within the 5-10 year window and looking at VCIT’s holdings, investment-grade corporate bonds only.
VCIT holdings review
The end of June statistics for this ETF were:
investor.vanguard.com VCIT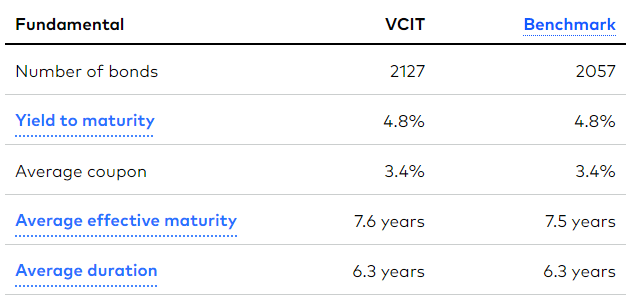
While VCIT’s average effective maturity is 3 years shorter than VCEB’s, the duration difference is under 1 year.
investor.vanguard.com VCIT ratings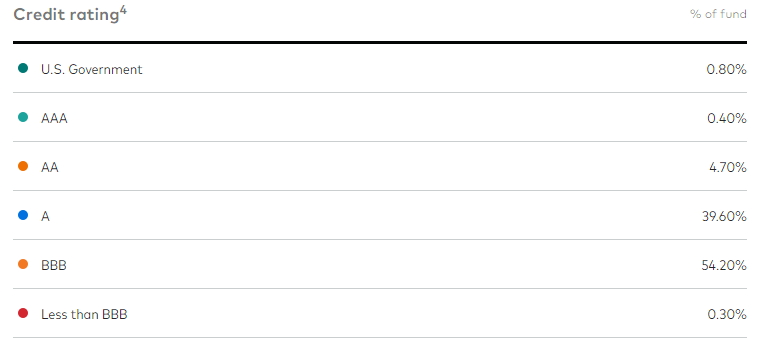
While close to matching VCEB ratings allocation, a closer look show the weighted rating for VCIT would be lower as their allocation to “A” and above is half that of the other ETF.
investor.vanguard.com VCIT maturities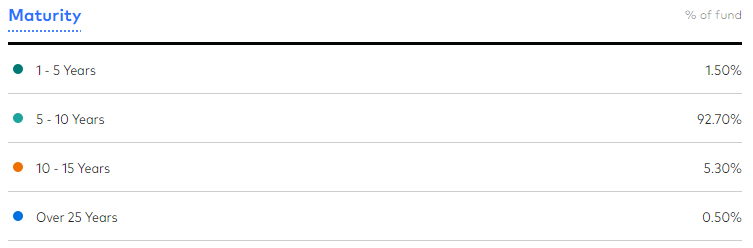
Based on the fact that VCIT WAM is shorter than VCEB’s, most of the 93% in the 5-10 year window must be toward the short end of the that grouping. With no bonds maturing within a year, I would assume the Index doesn’t allow them to be held. VCIT sector allocation is: Industrials: 56%; Financials: 36%; Utilities: 7%; and USTs at 1%.
Top holdings
Vanguard.com; compiled by Author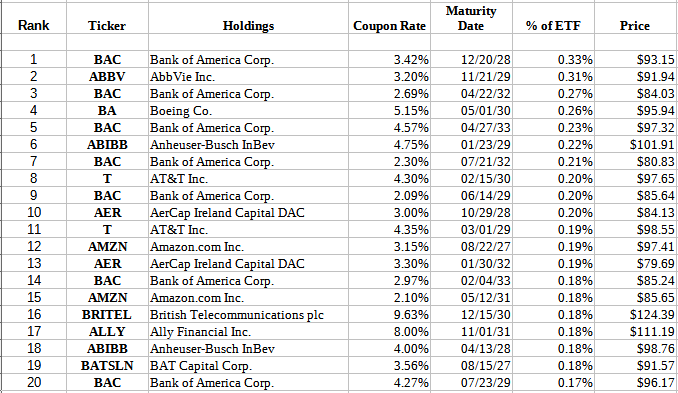
As with VCEB, many issuers have multiple bonds held by the ETF. There are over 600 issuers used by this ETF, twice that of VCEB. The top Issuers, by weight are:
advisors.vanguard.com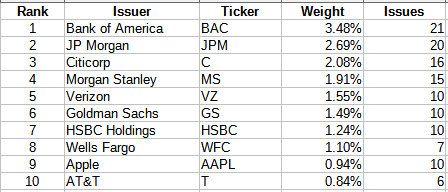
One big difference between VCIT and VCEB is the number of issues held by some issuers; with the highest count for VCIT being 24 for Duke Energy. Each of VCEB’s top issuers have higher counts, with BAC’s 73 being the most there.
Source: ETF.com
VCIT distributions review
seekingalpha.com VCIT DVDs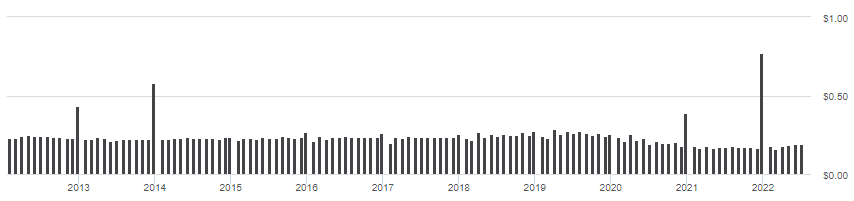
Until COVID hit, VCIT showed a slow growth in their payouts, a pattern that has returned in 2022. With under 2% of the portfolio maturing in the next five years, natural turnover doesn’t exist. VCIT will be very dependent on growing its AUM to enable adding bonds with better yields.
Comparing ETFs
I mentioned that duration and credit ratings matter so here is that data and a few other data points.
| Data point | VCEB | VCIT |
| Weighted duration | 7.1 years | 6.3 years |
| Weighted maturity | 10.6 years | 7.6 years |
| Weighted credit rating | A- | BBB+ |
| Weighted yield | 3.5% | 3.4% |
| Yield-to-Maturity | 4.6% | 4.8% |
Another piece of data that is important is sector allocation. While not as important as with an equity ETF, the strength of the underlying company and its sector will effect what investors demand in terms of yield to hold those bonds.
ETF.com; compiled by Author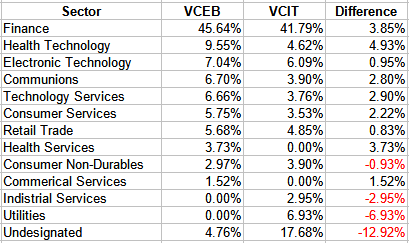
VCEB is more tied to their Top 2 sectors than VCIT is and there appears to be four sector where the other ETF has no or a minor exposure to it.
VCEB holds 661 bonds also held by VCIT, equaling 26% of the portfolio. VCIT owns 651 bonds also held by VCEB but the weight comes to 50% of VCIT’s portfolio.
Portfolio strategy
So which ETF is better? Here I will add the VTC ETF since its duration, maturity and credit risk closely match both of the other ETFs.
personal.vanguard.com/us/funds/vanguard/compare personal.vanguard.com/us/funds/vanguard/compare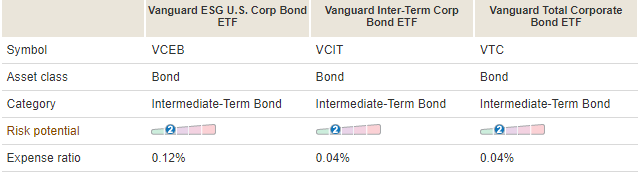
Here is how the three ETFs have performed since VCEB start almost two years ago.
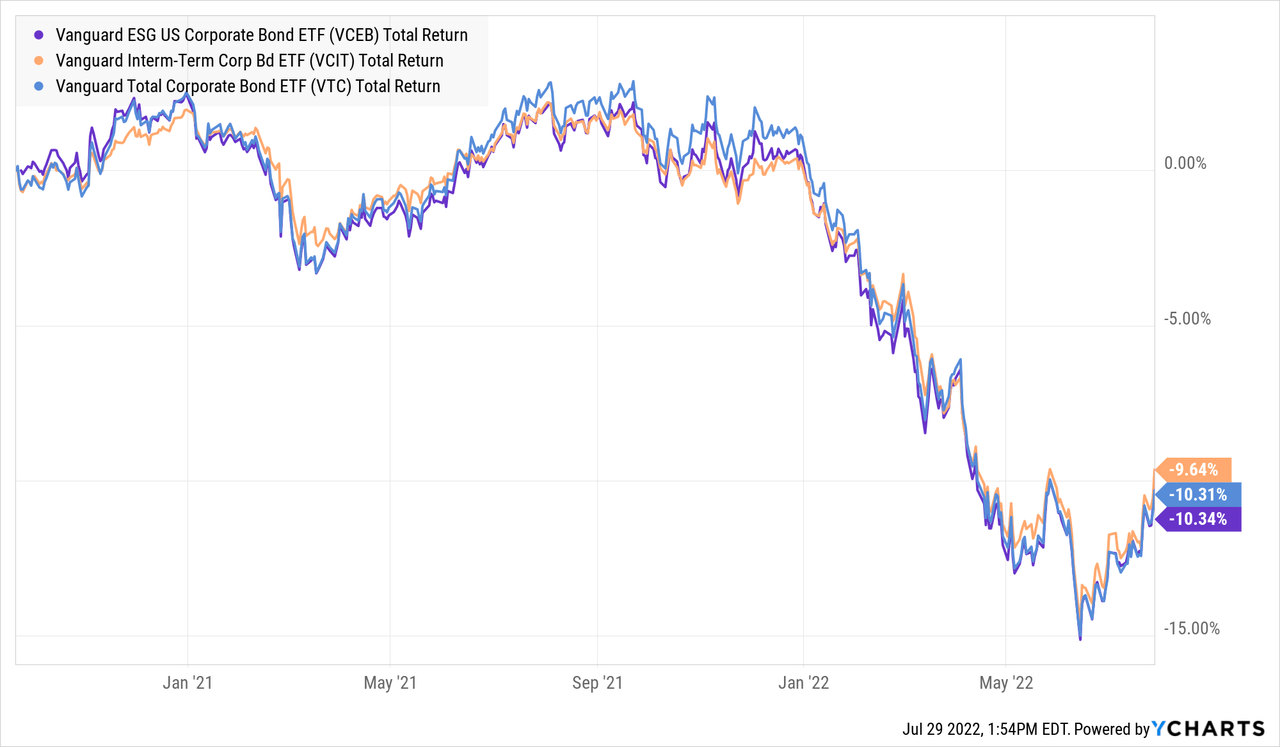
If the reason for owning VCEB is to make more money by being an ESG investor, so far that has not worked well as VCEB is last since it started. Using somewhat truncated data, here is how the three look taking risk into consideration.
PortfolioVisualizer.com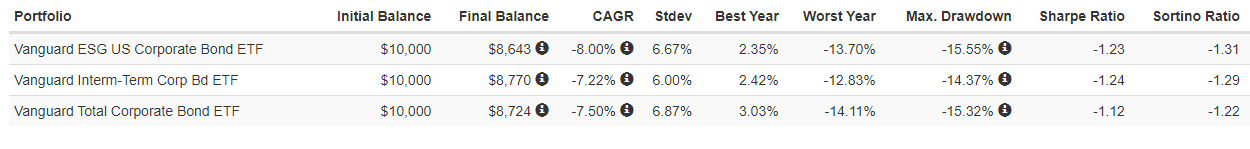
This data gives a mixed picture. One hope was screening companies for ESG would not only provide better returns but lower risk. That is not clearly the case. One reason could be that the ESG ETF might not be more “clean” than the unscreened ETFs, or not to the extent it makes a difference. MSCI divides companies into these categories using over 200 metrics:
msci.com/our-solutions/esg-investing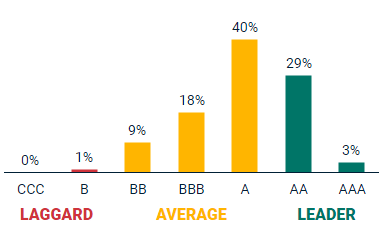
Here are the MSCI ESG scores for all three.
| Factor | VCEB | VCIT | VTC |
| Overall rating | AAA | AAA | AAA |
| Universe ranking | 95% | 79% | 92% |
| Leader percent (AAA/AA) | 33% | 29% | 28% |
| Laggard percent (B/CCC) | 1% | 2% | 2% |
| Carbon intensity | Low (30) | High (256) | High (305) |
Since only 5% of funds should be rated AAA according to MSCI, I especially do not understand how VCIT rates an AAA, or even an AA rating based on its 79% universe ranking. Thus one reason some investors take all this ESG with a large “grain of salt”.
Final thoughts
So far, VCEB might make an investor feel better in their mind, but not so much in their wallet. Which is more important would drive the decision in choosing any of these ETFs. Since its inception in September 2020, VCEB lags the return provided by VCIT, and Vanguard’s Total Corporate Bond ETF. Until VCEB proves the concept, stay with the basic ETF.
There is more data on the equity side and I found this set of data for the MSCI All-Country World Index with ten years of results.
www.msci.com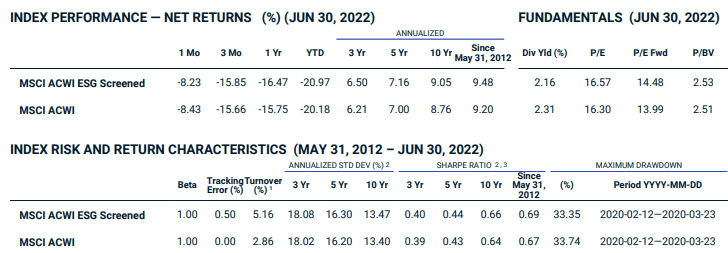
Here the ESG version of the index was ahead by 2.8bps annually and it has similar risk data as the full ACWI Index. In sports, they would call that “No harm no foul”. BlackRock, in 2020, launched the Shares ESG Advanced MSCI EAFE ETF (DMXF) as one of the many new ESG ETFs; so far it has lagged behind the basic EAFE-invested ETF.
Be the first to comment