

mrbfaust/iStock via Getty Images
Thesis
The Vanguard Intermediate-Term Bond ETF (NYSEARCA:BIV) is a fund that seeks to track the performance of the Bloomberg U.S. 5-10 Year Government/Credit Float Adjusted Index. The ETF provides for a diversified exposure to the intermediate-term, investment-grade U.S. bond market, having a 50/50 split between government securities and investment grade bonds. The fund has 3-, 5- and 10-year trailing total returns which hover around the 3% mark, achieved with a low standard deviation of 3.93 and a Sharpe ratio of 0.57 (both measured on a 5-year basis). The fund’s main risk resides with interest rates moves, with its credit risk profile being well mitigated by its granular build. The fund has a 6.6 years duration, which is going to drive its NAV performance in the next six months. With 7-year yields around 2% currently, we believe we are going to see a retracement of the 2018 tightening cycle when this point in the yield curve moved up to 3%. We expect further weakness from higher rates in the next six months with a predicted price move of -5% as implied by the ETF’s intermediate duration analytics. The fund is a solid long term buy-and-hold vehicle, having outperformed its pure Treasuries peer iShares 7-10 Year Treasury Bond ETF (IEF) on a 10-year basis, but it is not going to escape the current tightening environment. We believe a retail investor is best suited to Sell BIV now and revisit in August/September when most of the tightening move should be priced in the yield curve and the downside in NAV is going to be limited going forward.
Holdings
The fund is composed of a blend of Treasuries and investment grade bonds:
Fund Allocation (Annual Report)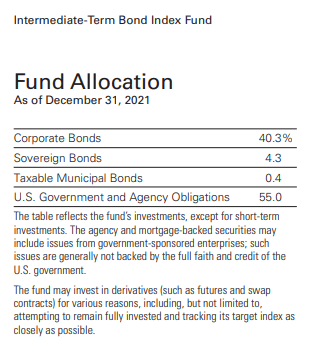
The investment grade bond portion of the portfolio lies on the bottom of the ratings spectrum for the asset class:
Credit Quality (Fund Fact Sheet)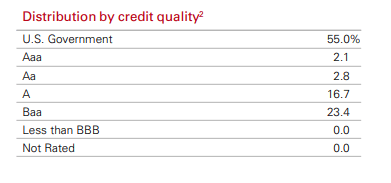
We can see how the bond portion of the portfolio is tilted towards the more poorly rated credits, namely BBB credits which account for 23.4% of the portfolio.
On the corporate side we can also see that the portfolio is overweight industrials and financials:
Industry Distribution (Fund Fact Sheet)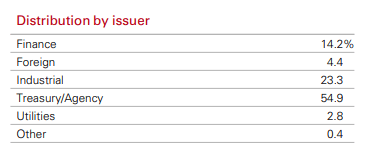
Credit & Market Risks
The fund’s main risk is composed of market risk, and specifically the duration run interest rate sensitivity:
Duration (Fund Fact Sheet)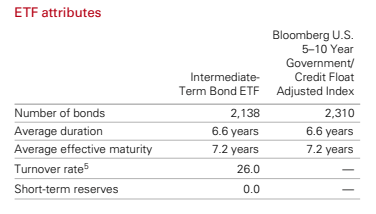
We can see that the ETF has an intermediate duration of 6.6 years, which will adversely affect performance as interest rates rise. If we revisit the bond math table from Vanguard we can get a better sense of the duration impact:
Duration Impact (Vanguard)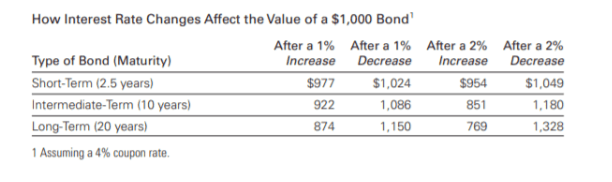
The ETF roughly falls in the intermediate term bucket, which gives it an approximate further 5%-6% negative performance if 7-year yields rise by a further 1% (i.e. 100 bps).
If we look at the historical performance for 7-year yields we can see that they peaked at 3% in the last tightening cycle:
7-Year Rates (Author)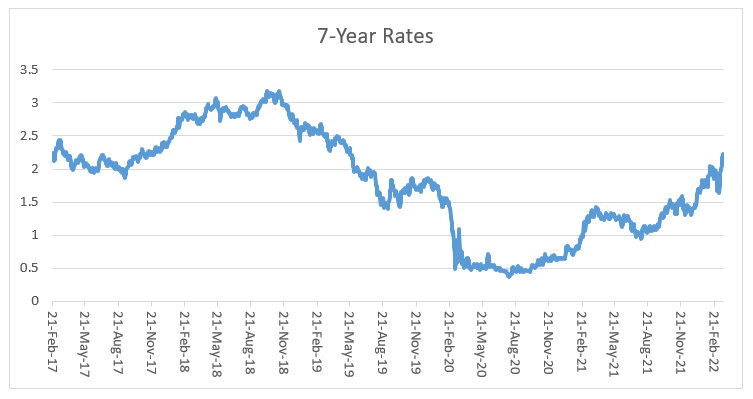
Inflation is running at a much higher level than in 2018, thus we fully expect the 7-year point in the treasury curve to retrace the performance during the past tightening cycle, with the possibility of yields going even further. A continuous inversion of the yield curve however tells us that the market does not think the Fed has as much leeway as it should in such a high inflation environment, thus we do not think 7-yield rates will overshoot by much the 3% mark.
The fund runs a small amount of credit risk through its corporate bond holdings, and specifically through its BBB bond bucket. Credit risk addresses the possibility of default by an underlying issuer, performance which is measured by its credit rating and credit spread to treasuries. While indeed the BBB bucket is fairly large, the fund is very well diversified with over 2,000 bond holdings (thus a very granular issuer profile) so we think the carry drag from a bond default (i.e. impact to fund performance) is fairly muted.
Flows
This year has seen a substantial investor money outflow from fixed income:
Fixed Income Flow (Bank of America)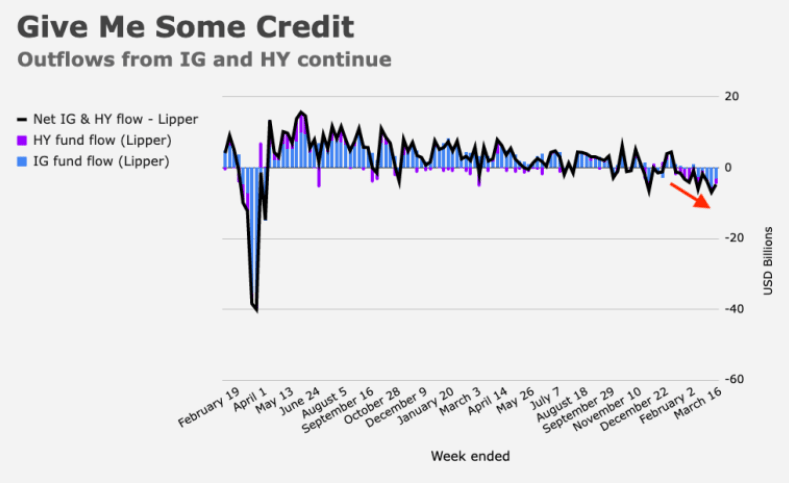
The market is recognizing the duration induced weakness inherent in fixed income and is voting to leave. We do not expect flows to be conducive to a positive performance until we have a clearer picture of where the yield curve is going to end up and how determined the Fed is to fight inflation as it negatively affects GDP growth.
BIV is going to be negatively affected by continued outflows from fixed income IG credit.
Performance
The fund has total trailing returns that hover around the 3% mark on a 3-, 5- and 10-year lookback period:
Trailing Total Returns (Author)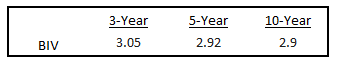
Given higher yields the ETF is down on a year-to-date basis:
YTD Total Return (Seeking Alpha)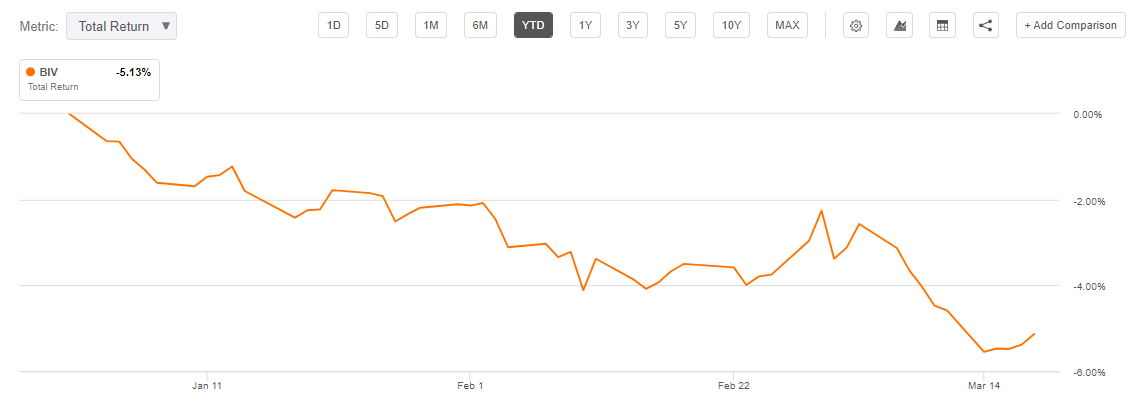
On a 5-year basis the ETF has a very similar return profile to the pure Treasuries ETF iShares 7-10 Year Treasury Bond ETF (IEF), while the pure corporate product (LQD) displays a more volatile, albeit higher total return profile:
5-Year Performance (Seeking Alpha)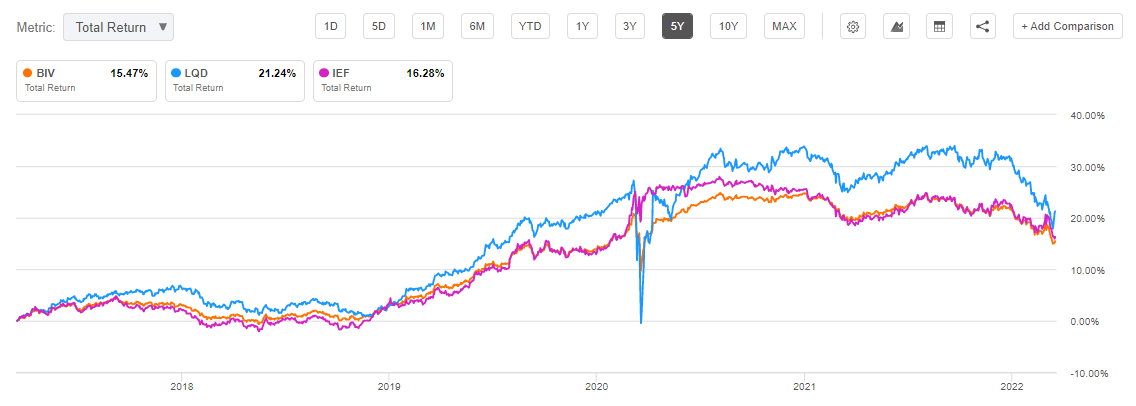
The 10-year chart paints a similar picture, with BIV being a solid buy-and-hold vehicle that provides a nice blend of treasuries and investment grade bond portfolio returns:
10-Year Returns (Seeking Alpha)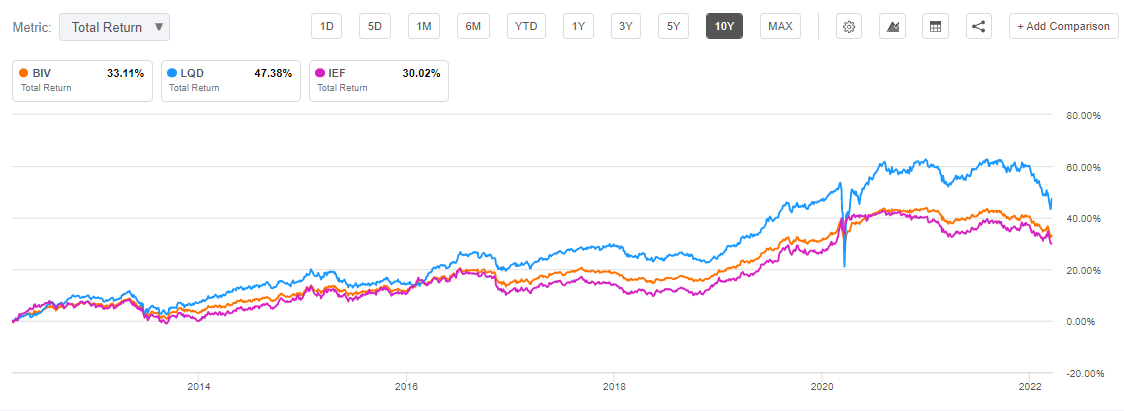
Conclusion
BIV is a fixed income ETF that has a 50/50 split between treasuries and investment grade bonds. On a long term basis expect a 3% annual total return from this fund, as highlighted by its 3-, 5- and 10-year trailing total returns. The fund’s main risk resides with yield curve moves, with the ETF losing value in an aggressive tightening environment. The fund has an intermediate duration of 6.6 years and is set for further weakness as 7-year yields move towards the 3% mark, the level we saw as the upper bound in the past tightening cycle. An even more aggressive Fed willing to fight inflation can move yields further up as compared to the past cycle. We rate this fund a Sell expecting a further -5% move in the next months as the market trades the 7-year curve point higher toward the 3% mark.
Be the first to comment