

Vladimir_Timofeev/iStock via Getty Images
Introduction
The Vanguard Real Estate ETF (NYSEARCA:VNQ), with a listing history of nearly 18 years, is currently the largest REIT focused ETF around, with AUM of over $40bn. The ETF tracks the MSCI US Investable Market Real Estate 25/50 Index directly (through indexing), and indirectly (by owning shares of the Vanguard Real Estate II Index fund, which accounts for ~11.4% of VNQ’s funds).
I can appreciate why some investors may be wary about pursuing REITs in the current environment, but I don’t believe things are as bad as they are made out to be and VNQ may even have a few qualities that could prove to be useful.
Well-poised to mitigate inflationary pressures
Inflation has been one of the dominant themes of this year and could remain so for the foreseeable future. Fortunately, this is an asset class that has traditionally fared rather well during periods of moderate (2.5%-6.9%) and high inflation (>6.9%), delivering higher total returns than the S&P500 in the process.
NAREIT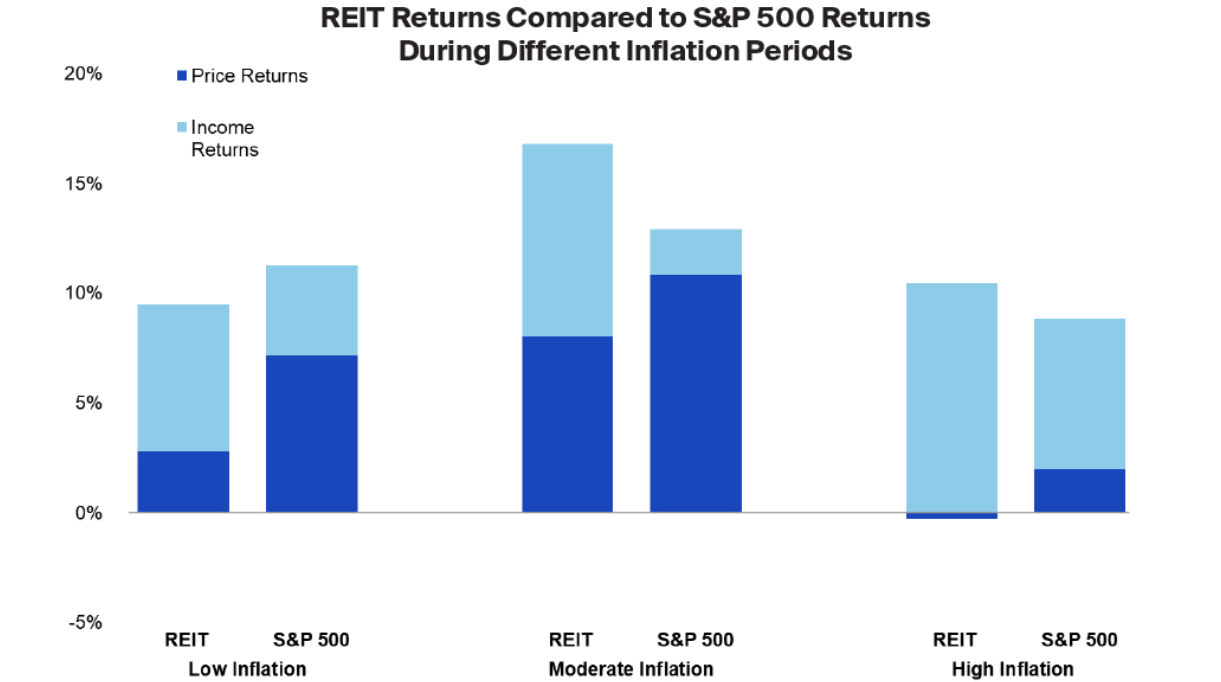
If one looks at VNQ’s portfolio, we can see that it is predominantly exposed to specialized REITs that cover terrains such as tower, infrastructure, data centers, etc. (this segment accounts for 37% of the holdings and 3 out of the top 10 stocks). Whilst these segments may not necessarily have the typically short lease agreements of, say, a hotel/lodging sector (this sector only accounts for 2.8% of the portfolio), which can quickly pass on prices to the end-market, it would be incorrect to believe that they have no protection whatsoever. In fact even though most of these contracts are long-term in nature, they still have annual clauses which adjust for inflation; American Tower (AMT), for instance, typically benefits from ~3% annual contractual increases in the U.S., even as its international contracts are linked to local inflation rates. Besides, structurally, in some segments such as tower infrastructure, the supply-demand position is already quite favorable for operators to demand higher prices, and they could be in an even better position with the potential rollout of mid-band 5-G spectrum.
The best yield amongst the largest ETFs, backed by attractive yield differentials of the top-10 holdings
Even though this ETF gives you access to 170 odd stocks, the top-10 stocks alone (not including the Vanguard Real Estate II Index Fund) constitute a hefty weight of 36%, so much of VNQ’s prospects will be driven by how investors feel about these names in particular. A few months back it was questionable if investors were getting adequate yields from some of these names, but I believe that situation has transitioned into a more appealing picture. As we can see from the image below, except for a couple of names (Public Storage (PSA) and Welltower (WELL)), all the other top 10 stocks are currently offering yields that are superior to their long-term averages, even as the weighted average figure trades at a premium to the long-term average.
Seeking Alpha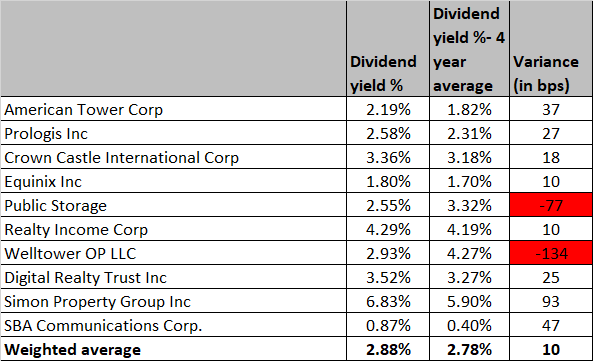
The other point to note is that amongst the large real estate ETFs, VNQ also currently offers the best yield figure.
Seeking Alpha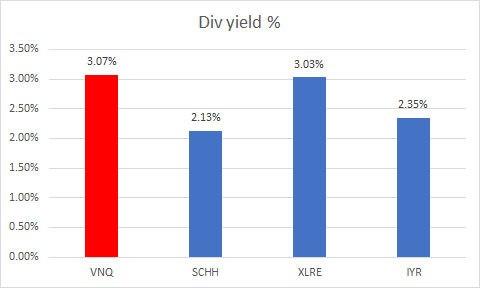
The tighter interest rate environment doesn’t necessarily have to be a bugbear
A lot of sectors have witnessed sizeable drawdowns this year on account of tighter monetary conditions and more stringent credit standards; whilst some of these sectors may not be in a good spot to handle the change in financing circumstances, I believe REITs are somewhat better-placed. Firstly do consider that leverage levels are not as pronounced as in previous crises; The debt-to-book assets ratio of REITs stands at 48.1% (vs 58% pre-GFC) even as the book leverage is currently at record lows.
Also note the image below highlighting the Debt-to-EBITDA position of the top-10 names of VNQ relative to their own specific sub-sector averages; for instance, American Tower Corp, Crown Castle International (CCI), and SBA Communications (SBAC) are benchmarked against the average debt/EBTIDA of “infrastructure” REITs. The takeaway here is that except for a few names, the majority of the top-10 names have debt-to-EBITDA ratios that are well below the sector average. In fact the weighted average figure for the top 10 implies that debt levels relative to EBITDA are around 14% lower than the industry averages.
NAREIT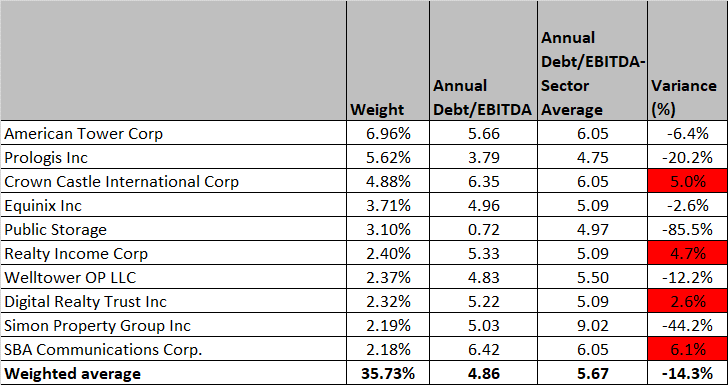
Interest coverage ratios too remain healthy at 6.5x even as aggregate coverage ratios are at their highest levels since 2000.
The other comforting aspect of VNQ is that it also has low exposure to the office segment (~6% of portfolio) which is currently experiencing heightened concessions and unfavorable lease terms, and could be one of the chief flagbearers of worsening credit quality.
Theoretically, whilst rising rates should be inimical for the valuations of REITs, history shows that it has not prevented investors from gravitating towards them. NAREIT data shows that the average four-quarter return for REITs during non-rising periods was 10.68%; during rising periods, these returns were bettered by 1.54x. The image below also shows that REITs have had a respectable track record in outperforming equities during eras where 10-year yields have gained significant traction.
S&P Global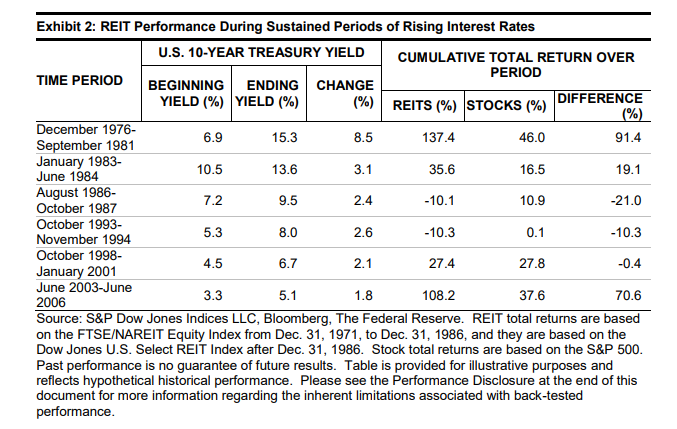
Even if you want to disregard all this, perhaps it may be time to consider if we are getting to a point where aggressive rate hikes expectations have largely been priced in? Just for some perspective, market expectations of the Fed funds rate have recently dipped by 20bps to 3.31%.
Good track record of risk-adjusted returns
To know if you’re in good hands, it’s also important to get a sense of how effectively VNQ has mitigated risk in its attempt to deliver returns. In that regard, I’ve taken a look at some of VNQ’s short and long-term risk-adjusted return metrics and compared it to the other top 3 real estate ETFs by AUM – The Real Estate Select Sector SPDR ETF (XLRE), iShares US Real Estate ETF (IYR) and Schwab US REIT ETF (SCHH)
As far as the 10-year data is concerned (XLRE was only set up in 2015 hence no data), we can see that IYR appears to be the least volatile product. The relatively lower standard deviation number should have set it up nicely to deliver superior excess return vs the risk-free rate (as measured by the Sharpe ratio), but it falls short of what VNQ achieves. We have a similar conclusion with regards to the 10-year Sortino Ratio, where VNQ appears to have managed downside deviation rather effectively relative to its peers.
However, when it comes to the short-term track record, whilst VNQ’s numbers are good, it is not as great as XLRE’s. XLRE is a much more focused portfolio (only 30 stocks as opposed to 170 for VNQ) and does not consider mortgage REITs in its portfolio. It is also the least volatile portfolio of the lot, with annualized standard deviation of 22.9% vs the peer set average of 24.1%. The lowly standard deviation number lays the foundation for a very strong Sharpe ratio. Whilst VNQ does a decent enough job in coping with harmful volatility (Sortino ratio of 0.36) relative to SCHH and IYR, it isn’t as compelling as XLRE’s figure of 0.513.
YCharts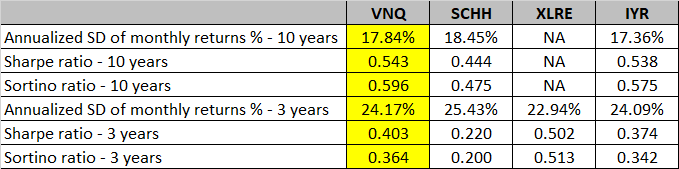
Decent risk-reward on the standalone and relative strength charts
VNQ’s portfolio may even appeal to technically minded investors looking for opportunities with good risk-reward in the broader markets.; this is exemplified by a relative strength chart, highlighting the performance of VNQ as against the Vanguard Total Stock Market ETF (VTI) which covers over 4100 large, mid-and small-cap stocks.
Stockcharts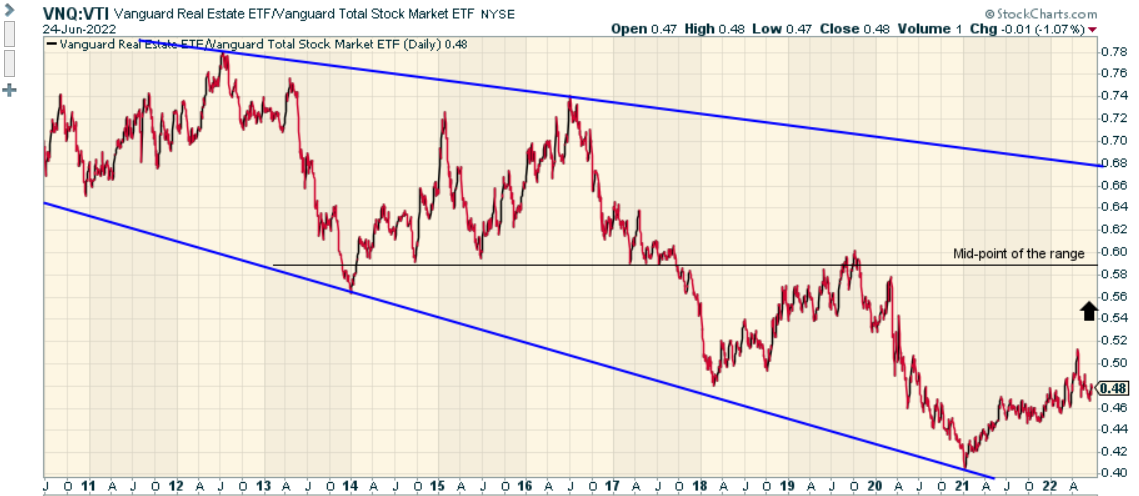
As you can see from the image above, whilst this ratio has picked up from record lows of 0.4x, it is still a long way from the mid-point of the range, as well as the upper boundary of the long-term descending wedge pattern, implying good (relative) value on offer.
Investing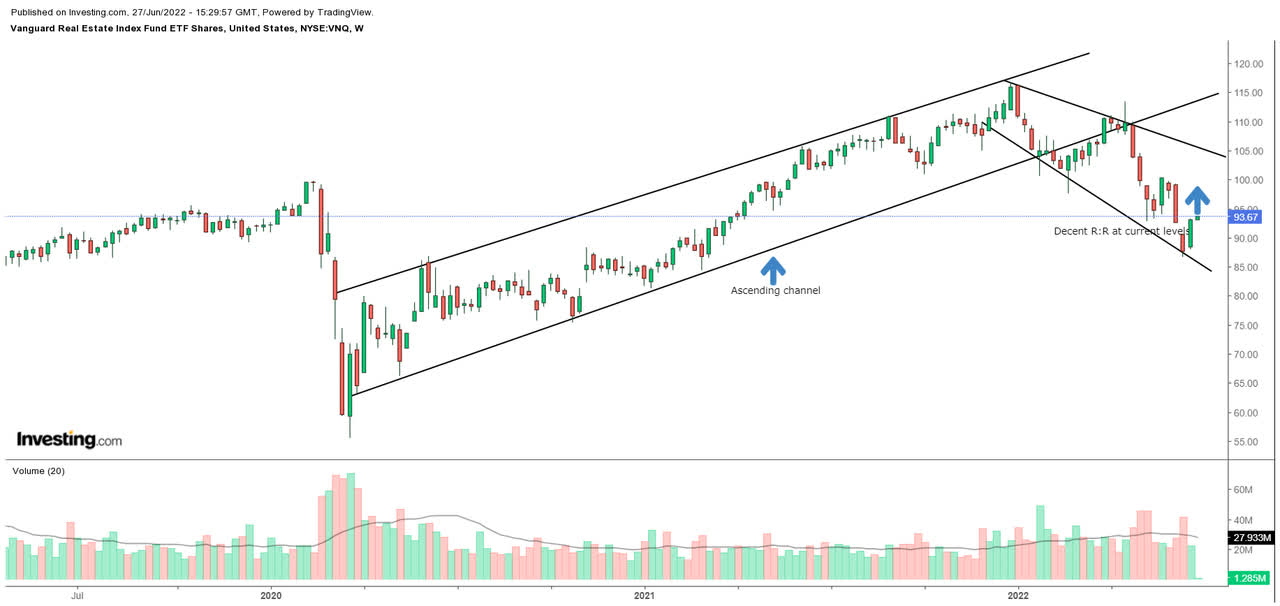
If we switch over to the standalone chart of VNQ, we can see that it fell out of its long-term ascending channel in January and has now corrected by over 20% from its lifetime highs. Since falling out of its ascending channel, the downtrend has persisted with no concrete signs of a bottom as yet. However, even if you think that the conditions may not entirely be right for a retest of the lifetime highs, I still feel one could perhaps make a case for a short-term rally to levels just below $105 (the upper boundary of the corrective wedge).
Be the first to comment