


Andrii Yalanskyi/iStock via Getty Images
The U.S. bond market has seen a brutal selloff over the past few months as the surge in inflation has forced the Federal Reserve to adopt a much more hawkish stance with regards to interest rates. The Vanguard Total Bond Market ETF (NASDAQ:BND) now offers a yield of 3.0%, having risen by over 200bps from its 2020 lows. This yield is now back above long-term inflation expectations, even as inflation expectations have risen sharply. While further losses in the BND look likely in the near term, I am dipping my toe into the market as I believe it offers strong upside potential in the event of a downside reversal in commodity prices.
The BND ETF
BND tracks the Bloomberg Aggregate Float-Adjusted Bond Index and charges a minimal expense fee of just 4bps per year. BND has an effective maturity of 8.9 years, yet the yield is higher than the 10-year U.S. Treasury’s current 2.5% as the fund also holds a substantial amount of corporate and securitized bonds which have higher default risk. The fund’s holdings are shown in the chart below.
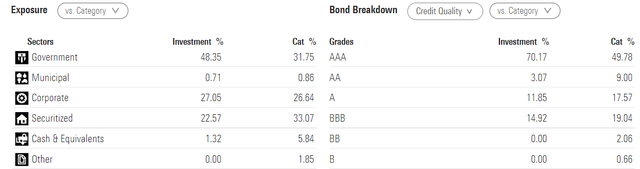
BND Holdings By Sector And Credit Rating (Morningstar)
Over the long term, BND has moved very closely in line with the performance of 10-year USTs although it has outperformed by around 60bps a year over the past decade due to the higher yield offered on the corporate and municipal bonds. This exposure to credit risk has come at a cost of underperformance during times of credit stress experienced during economic downturns. However, BND has still proven to perform well during such periods as strength in its UST holdings has outweighed weakness in its corporate holdings.
High Debt Levels May Tie The Fed’s Hands
We can compare the 3.0% yield on the BND with the yield that investors will receive on U.S. dollar cash over the coming year under different policy rate scenarios. As shown in the chart below, 270bps separate the current yield on the BND from the current Federal funds rate, meaning that in order to underperform cash, the Fed funds rate would have to average more than 2.7% over the next 8.9 years.
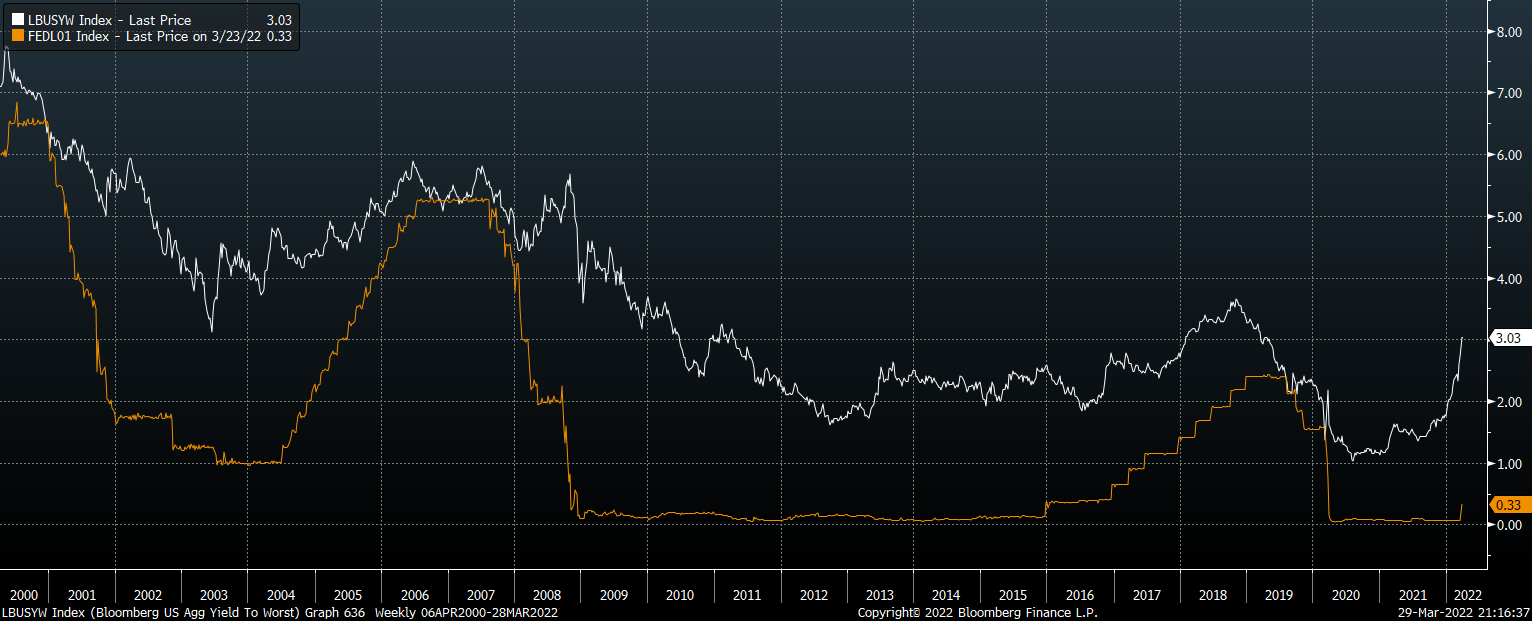
U.S. Aggregate Bond Index Yield Vs Fed Funds Rate, % (Bloomberg)
Considering that the total level of U.S. debt relative to GDP is at an all-time high of 271%, such an aggressive interest rate hiking cycle would likely wreak havoc on heavily indebted sectors of the economy. Perhaps most important of which is the Treasury, which would see the interest costs on its huge debt load rise exponentially.

U.S. Total Nonfinancial Debt, % of GDP (Bloomberg)
The Treasury market is currently inverted, with the 5-year now higher than the 10-year by 11bps, signaling that bond investors expect aggressive hikes over the coming years to be unwound in future years. The majority of previous such occurrences have occurred just prior to significant declines in yields across the board.

Bloomberg, Author’s calculations
While I believe aggressive interest rate hikes would be self-limiting due to the high degree of debt in the economy, a repeat of the late-1970s/early-1980s cannot be ruled out. Back then, rising inflation forced the Fed to hike rates into double digits, causing bond prices to crash, and with headline inflation currently running close to 8%, the bearish case is easy to make. However, inflation expectations as measured by the bond markets show that investors expect to see inflation moderate over the coming years. 10-year inflation expectations sit at 2.9%, while 30-year expectations sit at just 2.5%.
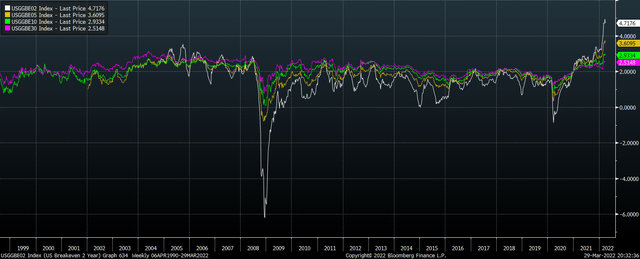
U.S. Breakeven Inflation Expectations, % (Bloomberg)
A Good Hedge Against An Equity Crash
The main reason I like the BND is that it offers the potential for upside in the event of a recession and/or a downside reversal in the U.S. equity market, particularly if commodity prices begin to suffer. For those investors who are long only and therefore unable to hedge their equity positions, the BND provides a good hedge in the event of a recession-driven market crash. In both the global financial crisis and the Covid recession, the BND performed well despite an initial selloff driven by weakness in corporate debt. For those investors who are heavily invested in commodity-related stocks as I am, the BND offers the added benefit of acting as a hedge against downside reversal in resource prices. A fall in oil prices in particular would ease the pressure on the Fed to hike rates aggressively, benefitting the BND.
From a short-term perspective, the outlook for BND is supported by the positioning of futures traders, which have amassed heavy positions betting on continued increases in bond yields. As the chart below shows, when net non-commercial positions have been as negative as they are currently, it has tended to signal that an intermediate top in yields is likely.
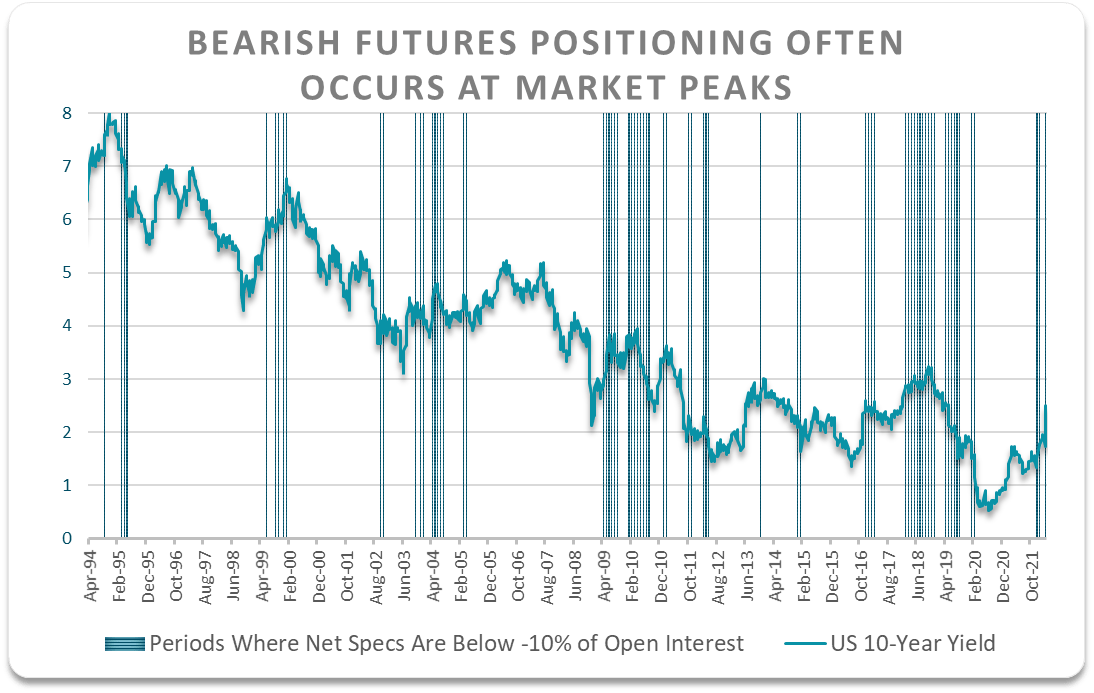
Bloomberg, Author’s calculations
Summary
After a brutal selloff in U.S. bond yields the Vanguard Total Bond Market ETF now offers a yield of 3.0%, recently moving back above long-term inflation expectations. Given the extreme level of debt in the U.S. economy, the Fed may be unable to hike rates as aggressively as the market currently expects. Furthermore, the BND offers a good hedge for investors looking to minimize the risk of a downside equity reversal, particularly one that occurs alongside a U.S. recession and a decline in commodity prices.
Be the first to comment