

marchmeena29/iStock via Getty Images
By Michael J. Fleisher
Over the years, volumes have been published discussing the value and debating when this style of investing might be in or out of favor. We, too, have added to the conversation, writing previously about the benefit of utilizing a valuation spread or discount to time value cycles. Since then, while we have found that the valuation spread has been an effective tool for predicting value regimes, we also have explored a behavioral reason for value’s outperformance. We believe a major contributor to the value anomaly is simply a basic emotion – fear. We consider value investing to be a strategy that strongly reverts and outperforms after there is enough fear in the marketplace causing value stocks to reach their deepest discount level.
How to Measure Fear?
In Chart 1, we measure the valuation discount by calculating the spread between the median of the cheapest 25% of companies’ valuations based on price-to-book ratios and the median of the broad U.S. market as measured by the top 1,000 stocks based on market capitalization. As shown, the valuation spread tends to be very wide during a crisis and/or recessions, followed by narrowing of the spread. When this narrowing occurs, value stocks tend to significantly outperform.
Author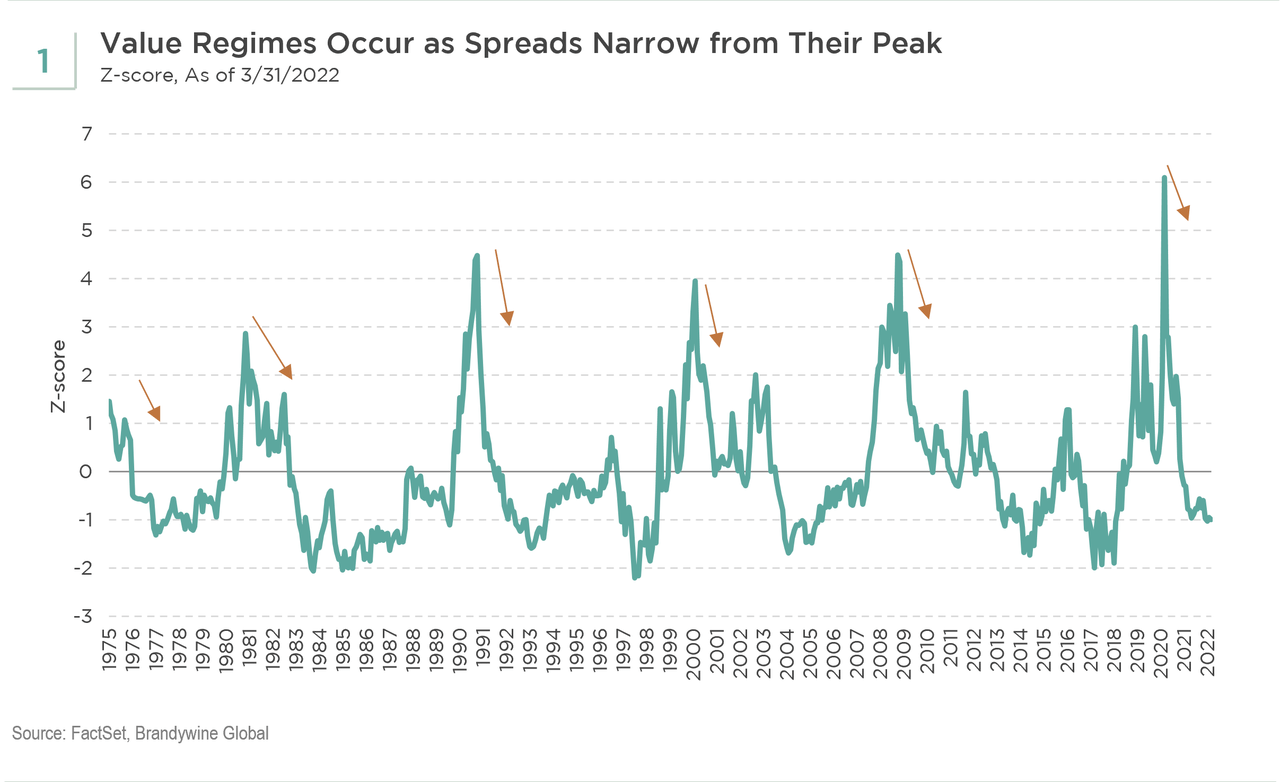
The extreme widening of the valuation spread during market dislocations that occur during or near the start of value cycles suggests that fear may act as a catalyst and play a role in extending the outperformance of value. To incorporate a proxy to represent fear-based investor behavior, we integrated a credit spread – the Baa corporate bond yield minus the 10-year Treasury bond yield – within our analysis of the valuation spread. These two spreads, the valuation and credit spreads, demonstrated a high correlation of 0.5 since 1975 (see Chart 2). Over the past 20 years, they were even more strongly correlated with a correlation coefficient of 0.8.
Author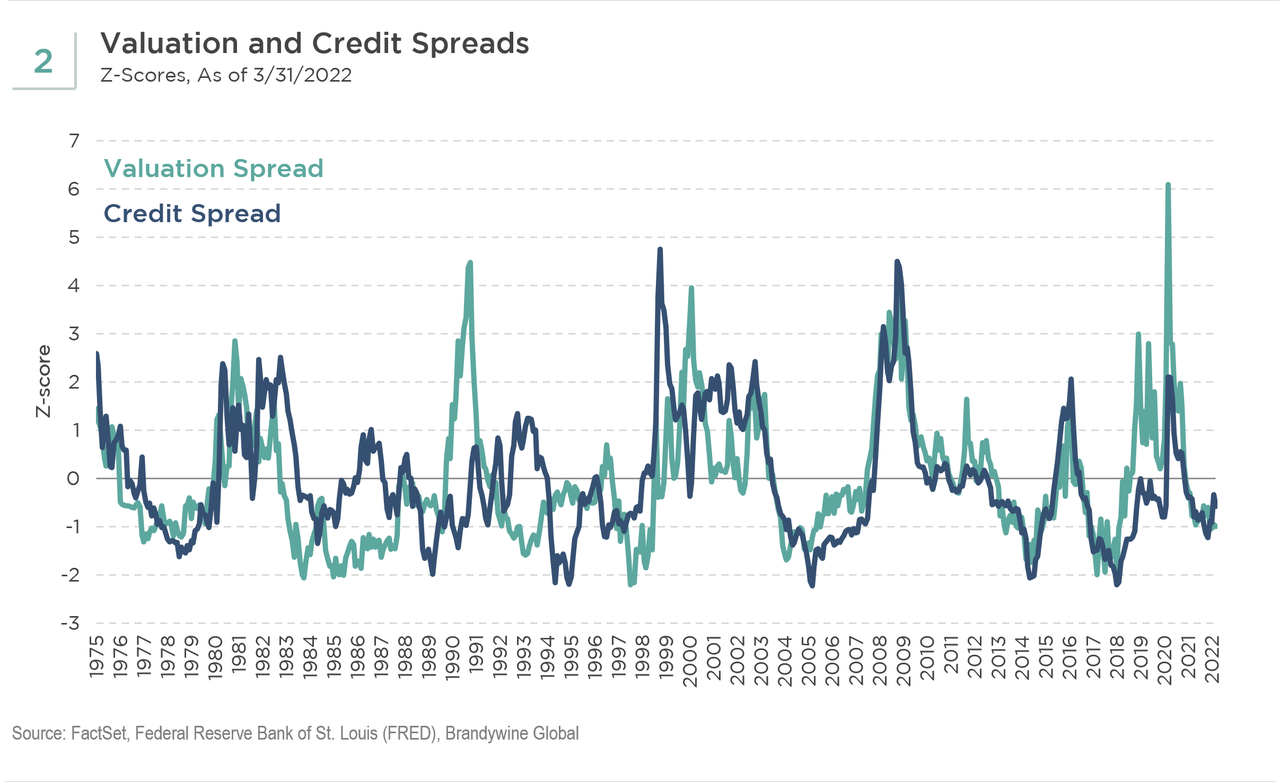
Our initial research has revealed that the magnitude and time period of the credit spread widening combined with the magnitude and narrowing of the valuation spread may influence the performance of value stocks. In Chart 3, we show certain crises that most likely caused both the valuation and credit spreads to be very wide. The crises also were followed by the start of value cycles as valuation spreads began to narrow, depicted by the arrows. During the initial months of the six value cycles, these discounted stocks outperformed expensive companies in all cycles except during 1991 (Value Cycle #3, shown in Chart 3). You can see during that year the valuation spread peaked and then narrowed, but the credit spread was not extremely wide, resulting in value underperforming in 1991. However, as the credit spread increased during 1992, and the valuation spread continued to narrow, value stocks significantly outperformed into and throughout 1993. Also of note is that the valuation spread became very wide in 2018, but value stocks did not outperform. You can see that the credit spread was narrow during that period, and we posit that perhaps a lack of fear in the bond market resulted in value companies continuing to underperform. In Value Cycle #5 in 2009, while valuation spreads were very wide at their peak, the credit spread quickly narrowed, resulting in roughly equal returns for value versus growth stocks over the next few years.
Author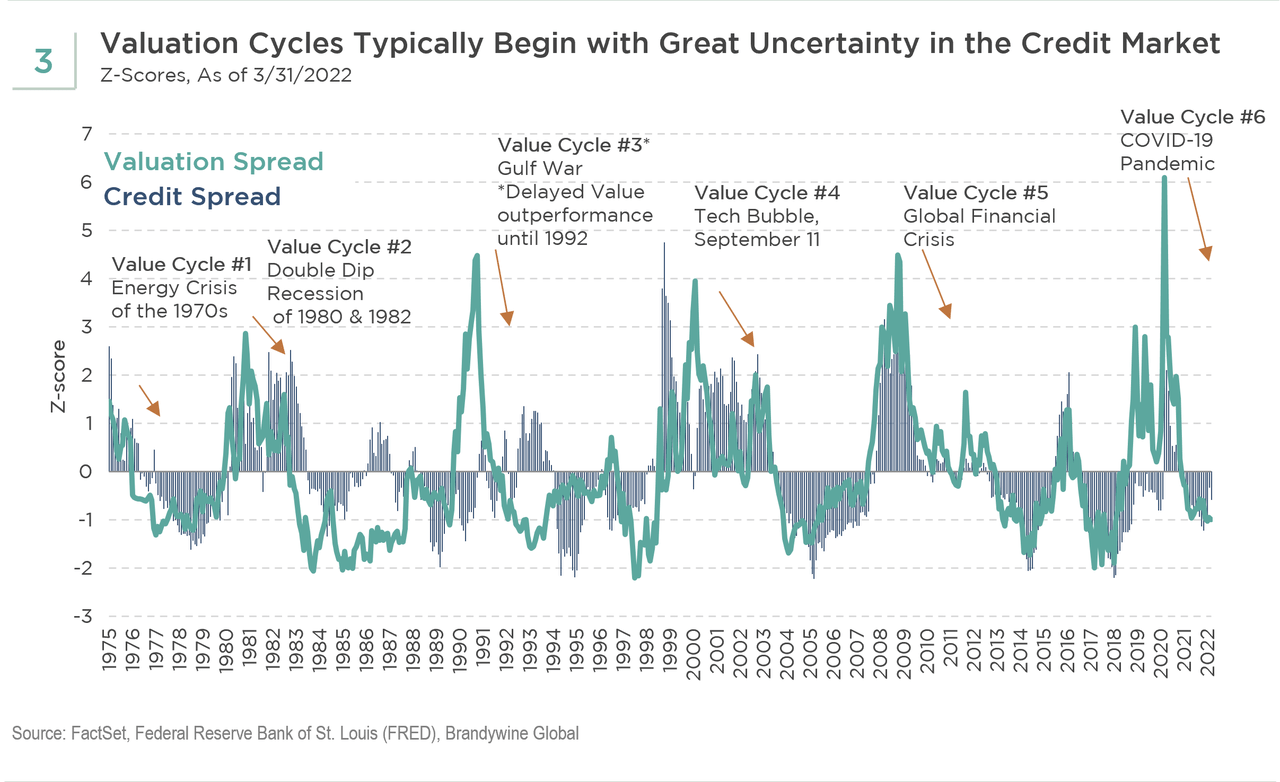
Magnitude and Duration Matter
The table below reveals that, along with valuation spreads, both the magnitude of the credit spread and the length of time during which credit spreads remained wide may affect the performance of value stocks. You can observe that for each value cycle, maximum historical valuation spreads were all extremely wide – greater than two standard deviations above long-term history. However, when looking at credit spreads, there was more variation in the duration of a wide spread.
In the table (see Figure 4), we have highlighted three value cycles with similar valuation spreads but very different credit spread environments. We looked at the credit spread magnitude and duration of each and the relationship to value’s outperformance over growth.
Historically, the highest outperformance of value over growth occurred in the early 2000s (Value Cycle #4) when there was both a wide valuation spread and a wide credit spread that remained wide for a longer period of time. When the credit spread was wide for only a brief time period, which occurred coming out of the Global Financial Crisis (Value Cycle #5), value barely outperformed. When the maximum credit spread was at the lowest level of the six value cycles, which occurred in the early 1990s (Value Cycle #3), the value outperformance was lower relative to the other cycles, excluding Value Cycle #5. Although there are a limited number of cycles to evaluate, thus far, there appears to be an indication that the greater the fear, expressed as both magnitude and longer duration of high credit spreads, the greater the potential for value to outperform.
Author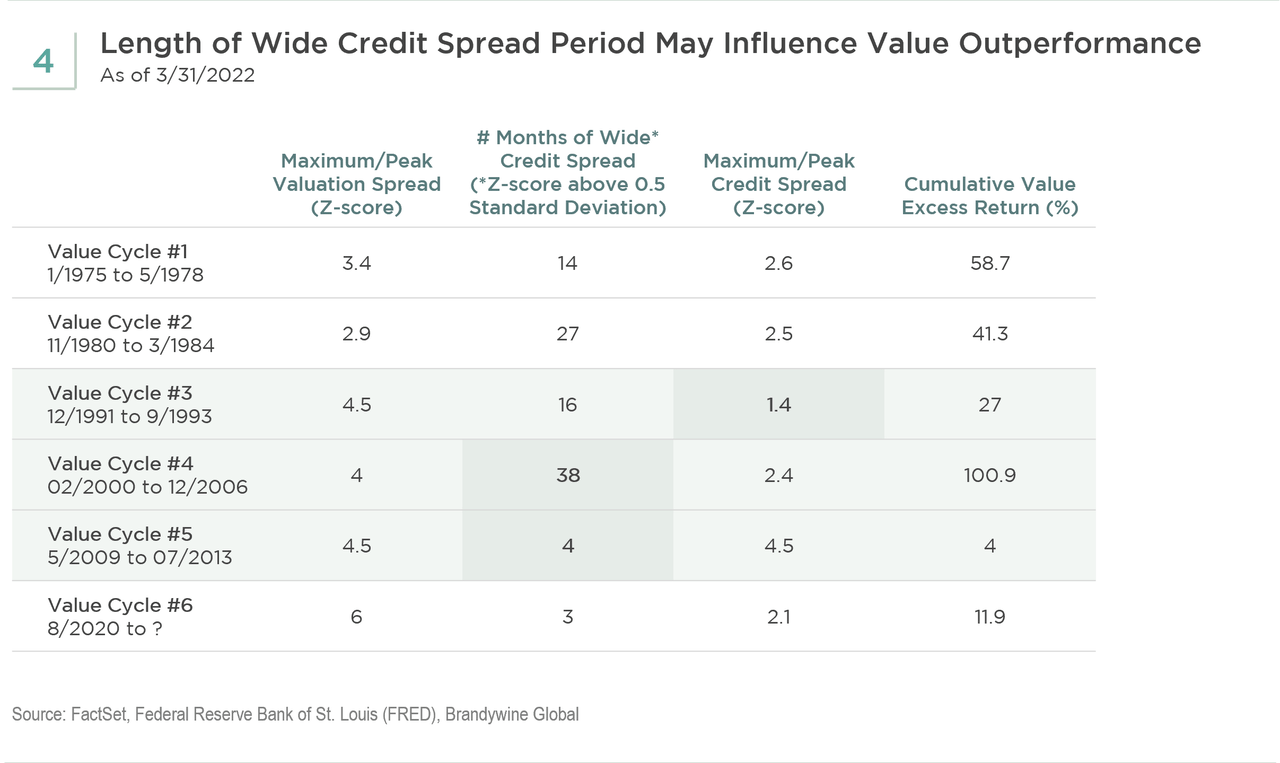
Implications for Current Value Cycle
Looking at the current value cycle underway (Value Cycle #6), the credit spread has been significantly wide for only three months. However, the credit spread has started to trend wider as valuation spreads have narrowed over the past few months. A continuation of this trend in both spreads – valuation and credit – could possibly extend the value cycle, similar to what occurred in 1992 and 1993 (Value Cycle #3).
Understanding Value Anomalies
While there are only five value cycles to analyze, we are conducting this research to make an intuitive sense of what may be contributing to the value anomaly. We believe that investor behavioral biases play a role in all investing. Regardless of the factor, whether it is the CBOE Volatility Index (VIX), stock price volatility, credit spreads, or any other factor exemplifying fear, we believe that this emotion plays a role in the outperformance of value stocks.
Editor’s Note: The summary bullets for this article were chosen by Seeking Alpha editors.
Be the first to comment