


naphtalina/iStock via Getty Images
My View: Market Is Expensive, Even Value
Over the past year I have written a number of articles for Seeking Alpha about market and individual equity valuations. The general theme: Market is expensive.
Today’s write-up builds off these past articles:
- ‘Epic Bubble’ 3.0 – Putting 70 Value Stocks Under the Valuation Microscope, February 2021
- Time to De-Risk, July 2021
- Time To De-Risk 2.0: Not Time to Be Bold, Correction Creates Opportunities, May 2022
Value Funds Outperforming But Not Cheap
Large Cap Value funds have outperformed the market as this chart shows. However, price change year-to-day (May 20) is -8.2% for the Vanguard Value ETF (VTV).
In contrast, the Vanguard Growth ETF (VUG) and the SPDR S&P 500 Trust ETF (SPY) are down 29% and 27%, respectively.

Price Change YTD (Ycharts)
The histogram below shows the median quarterly PE for the 70 largest companies in the Vanguard Value ETF from 2000 to May 2022. The current median PE is favorable to both the ten-year average PE as well as the average since 2000.
While 18.8x median PE is favorable to history, the current PE is not cheap and not signaling a “buy” given economic uncertainty.

PE History Large Cap Value (Ycharts, Vanguard)
Not A Market Timer
Whenever I write articles about market valuations, I invariably hear a chorus of warnings from investors to “not time the market.”
I agree.
Yet, market turmoil creates a time for tweaks.
I am a buy-and-hold investor with a large-cap Value tilt. My current portfolios include 29 of the Vanguard Value ETF’s largest 70 holdings.
My top ten Value holdings are in companies owned for more than a decade. These are: Exxon Mobil Corporation (XOM), Johnson & Johnson (JNJ), The Procter & Gamble Company (PG), CVS Health Corporation (CVS), Walmart Inc. (WMT), BlackRock Inc. (BLK), PepsiCo, Inc. (PEP), Berkshire Hathaway Inc. (BRK.B), Abbott Laboratories (ABT), and Cisco Systems, Inc. (CSCO).
Data Search: Looking For Value, Safety, Dividends From Large-Cap Value
The Heat Map table below shows my favorite data for the 70 largest Vanguard Value holdings.
There are ten columns in addition to the first column which shows symbols.
- PS (Price to Sales) Z = z-score for current PS compared to ten-year P/S.
- PE (Price to Earnings) Z = z-score for current PE compared to ten-year P/E.
- PB (Price to Book) Z = z-score for current PB compared to ten-year P/B.
- ROE Q1 = Most recent Return on Equity
- ROE Z = Most recent ROE to ten-year ROE.
- RAROE = Ten-year average ROE minus the standard deviation of ten-year ROE
- Div. Yield = May 20 dividend yield TTM.
- Payout Ratio = Most recent dividend payout ratio.
- Cons. = Consensus analyst Buy/Hold/Sell rating.
- Beta = ten-year Beta.
Color coding is subjective. Bright green reflects statistically significant positive variance. Light green = positive variance. Yellow = moderate variance. Pink = significant negative variance.
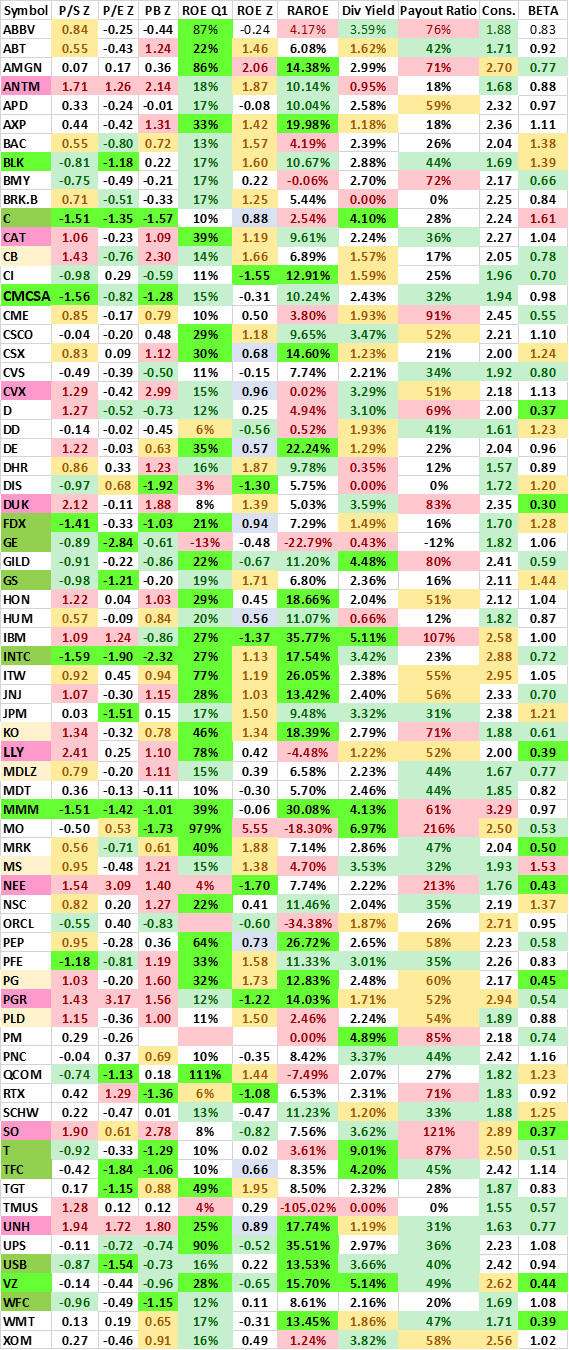
Heat Map (Ycharts)
Price Change YTD
The chart below shows the YTD price change for the 22 large-cap Value firms showing share price appreciation in 2022.
Energy, Pharmaceuticals, Tobacco, and Public Utilities are the big drivers of the relative outperformance of large-cap Value YTD. Here are the large cap Value companies with positive stock price change this year.
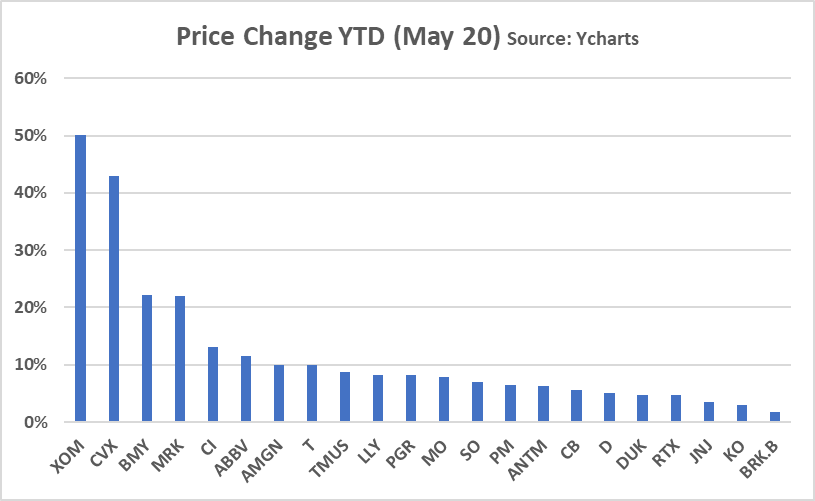
Share Price Change YTD (Ycharts)
The next chart shows the YTD price change for the 26 large-cap Value companies with price changes ranging from -2% to -19%. Banks, Info Technology, and Industrials are among the decliners.
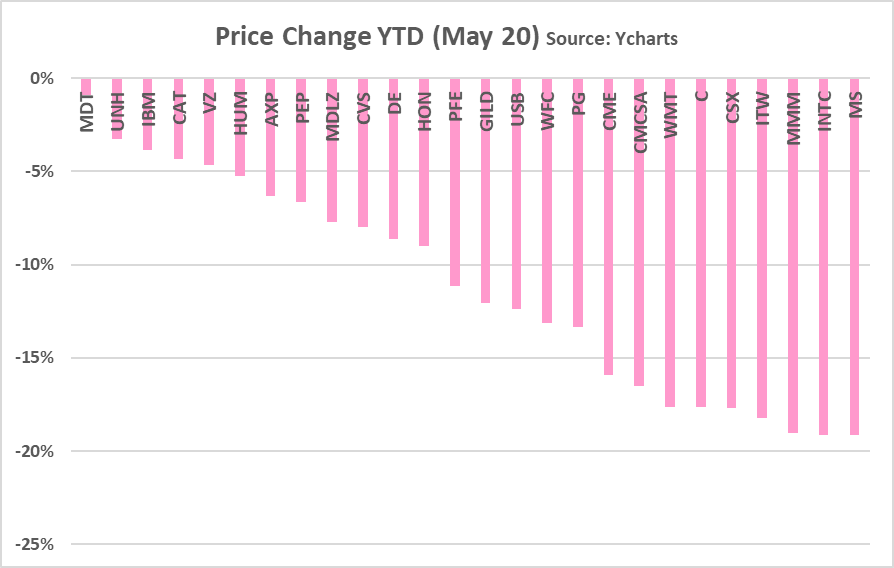
Share Price Change YTD (Ycharts)
Here are the worst performing large-cap Value firms YTD, all with total returns worse than -20%.

Share Price Change YTD (Ycharts)
Action Plan
My current plan is to accumulate shares in the four companies noted in bright green:
Here is a thumbnail sketch of key data, observations, and risks associated with each:
BlackRock (Adding to existing position. Dividend reinvesting.)
- CFRA (S&P) Quality Rating: A
- PE, PS, PB: statistically favorable to history.
- Excellent long-term ROE.
- Div. Yield: 2.88% TTM, 3.25% forward. Quarterly dividend ($4.88) up 18% Y/Y.
- Share Buybacks: Shares O/S 151.5 million April 2022 vs. 155.2 million YE 2019.
- CFRA revenue forecast growth of 8-12% in 2022 with margin forecast in line with 2021.
- YTD price change is -34%, the worst performer among the 70 large-cap Value.
- Net inflow of $11.48 billion in Q1.
- Fan of their unleveraged closed-end funds.
- Seven of the last ten Seeking Alpha articles on BlackRock are Buys (three Holds). This Hold recommendation article says that $476 is the “price to consider buying BlackRock.”
- Negatives/Risks:
- Strong Consensus: 1.69. Merrill, CFRA, Morningstar each have BUY rating with average 12-month target price of $917 (current price $600), indicating 52% potential upside.
- Merrill recently reduced EPS estimates because of “slightly softer-than-expected core profits” and need to invest in talent and technology.
- Morningstar worries about BlackRock’s “sheer size and scale” as “impediment to… growth.”
- S&P notes that shrinking equity and bond valuations will reduce AUM.
Comcast (New position)
- Seven of the last ten Seeking Alpha articles show Comcast as a Buy or Strong Buy (three Holds). Here is the most recent.
- CFRA Quality Rating: A
- Moderately Strong Consensus: 1.94. Buy ratings from CFRA, Morningstar. Merrill: Neutral. Average 12-month target price of $55 (current price $42), indicating 31% potential upside.
- PE statistically favorable to history.
- Div. Yield: 2.43% TTM, 2.57% forward. Quarterly dividend ($.27) increased 8% in January.
- Share Buybacks: Shares O/S 4.48 billion April 2022 vs. 4.55 billion YE 2019. January 2022 announced $10 billion buyback.
- S&P revenue forecast growth of 3.8% in 2022 with EBITDA forecast in line slightly favorable to 2021.
- YTD price change is -16.5%.
- Negatives/Risks
- Regulatory.
- Increasing broadband competition.
- Theme parks pandemic.
- Reputation for poor customer service (main reason I have not owned in past).
- Debt so high that acquisitions unlikely even as market valuations of attractive acquisition candidates decline.
3M (Adding to existing small position. Dividend reinvesting. Contrarian call.)
- Eight of the last ten Seeking Alpha articles on 3M are Buys (two Holds). This May 22 article calls 3M a “dividend dream stock.”
- CFRA Quality Rating: A
- PE, PS, PB: statistically favorable to history.
- Div. Yield: 4.13% TTM, 4.14% forward. Quarterly dividend ($1.49) increased <1% ($.01) in February.
- Highly diversified industrial firm.
- Shares Outstanding: Shares O/S 569 million April 2022 vs. 575 million YE 2019.
- YTD price change is -19%.
- Negatives/Risks
- Leveraged to economy.
- Litigation risk is high.
- Weak Consensus: 3.29. Buy ratings from Morningstar. Merrill: Sell. Average 12-month target price for 21 analysts is $161.17 (range $140 to $207) (current price $143.82), indicating 12% potential upside.
- Dividend yield and dividend growth rate anemic, reflecting economic uncertainty and litigation risk.
- Payout ratio high: 61%.
- Revenue growth flat despite nominal GDP in the US
- Inflation hurting margins as cost of sales up 7% Y/Y.
Verizon (Adding to existing moderate-sized position.)
- The last eight Seeking Alpha articles on Verizon show seven Buys and one Strong Buy.
- CFRA Quality Rating: B (I prefer A+, A, A-, with a small exposure to B+ and even smaller to B.)
- Low Beta (.44).
- Consistent, attractive ROE that exceeds cost of capital.
- Div. Yield: 5.14% TTM, 5.17% forward. Quarterly dividend ($.64) increased only 2% ($.0125) in Sept. 2021.
- Shares Outstanding: Shares O/S 4.20 billion April 2022 vs. 4.16 billion YE 2019.
- YTD price change is -5%
- Use their products and see share ownership as dividends as inflation hedge.
- Leading network availability, strong investment in 5G, scale, efficiency.
- Largest customer base in the US.
- Negatives/Risks
- Berkshire Hathaway exit of Verizon in Q1 indicates Buffett is not a believer.
- Consensus moderately weak at 2.62. CFRA has sell. Merrill and Morningstar: Buy. Consensus 12-month price $58.35 (current price $49.53), indicating 18% upside.
- Revenue growth not keeping pace with inflation.
- Largest customer base in the US, slowing wireless growth reflecting intense retail competition.
- Leveraged to economy at risk of recession.
- Debt overhang.
Funding Share Purchase With Three Sales
Over the past six weeks, I have sold shares in three long-held positions: Oracle Corporation (ORCL), The Walt Disney Corporation (DIS), and The Southern Company (SO).
Oracle (selling shares)
- Share buybacks have fueled strong stock price appreciation: 2.67 billion March 2022 versus 3.21 billion YE 2019.
- Moderately weak consensus.
- Revenue slow growth, margins narrowing.
- Weak dividend, weak dividend growth.
Disney (selling shares)
- Strong consensus at 1.72.
- No dividend: should have sold when Disney eliminated dividend.
- Concerns about leadership.
- Concerns about mission/purpose confusion.
- Concerns that company is not shareholder friendly.
Southern (selling short-dated calls)
- Stellar performer as have all utilities.
- Been a great ride, but utilities relative performance out-of-line with history.
- PE, PS, PB statistically unfavorable to history as is case with Duke Energy Corporation (DUK) which I recently exited.
- Current dividend yield at 20+ year low.
Closing Comment: Not Going Hog Wild
Slow-and-steady wins the race.
I like dividends from high quality companies.
Current acquisition plan:
- Verizon: Highest priority for new share purchases. Have sold June 3 Puts ($48) at $1.20. Will sell more Puts over time on weakness with intention of adding shares to current position. Goes x-dividend in early July.
- BlackRock: 2nd highest priority for share purchases. Will acquire new shares over time. $600 attractive price for long-term hold. X-dividend early June. Reinvesting shares.
- Comcast: Moderate buyer at $42. No rush to buy so will start slow. X-dividend early July.
- MMM: Cautious. Will add small position (+10% to current holdings) this week if price falls <$140. Went x-dividend May 19. Reinvesting shares.
Caveat
Investors need to understand goals and appetite for risk. Having a perspective on market valuations is just one element of an investor’s risk appetite.
My Risk Profile is such that I am not trying to beat the market. Capital preservation is important. I am willing to trade high side opportunity for low side protection.
Diversification is my best protection against out-sized risk, but it does not provide perfect protection against worldwide equity weakness.
My “house rule” is that no one individual equity should represent more than 4-5% of my investable assets. Yes, I know that is conservative.
My long-held view is that buy-and-hold, and dividend reinvestment, are sound means to building and protecting meaningful wealth over time. Zigging in and out of the market takes exceptional skill.
Investors need to do their own due diligence before investing.
Be the first to comment