

Drazen_/E+ via Getty Images
Investment Thesis
Costco Wholesale (NASDAQ:COST) and BJ’s Wholesale (NYSE:BJ) aim to do the same thing; provide affordable food and packaged items to consumers while generating the majority of profits through membership fees. They are both fantastic companies with high barriers to entry given their extremely low prices, undercutting traditional grocery stores. What differs between the companies, however, is the valuation. As Benjamin Graham once said, “there is no such thing as good stocks, just good stock prices.” In this article, I advocate Costco’s stock price has moved up too far, too fast, with my DCF model predicting the stock is 27% overvalued. For BJ’s, the opposite story exists, with my model predicting a 29% increase from current levels. While both are fantastic companies, there is only one good stock price here. My analysis suggests it’s BJ’s.
Costco Vs. BJ’s Wholesale – Business Models
Costco and BJ’s operate through a similar and unique business model. Both companies offer subscriptions to their customers and give them access to the best pricing for food, other packaged items, and even gas. Below you can find a summary of Costco and BJ’s membership options:
Costco
Costco Membership Options (Costco Website )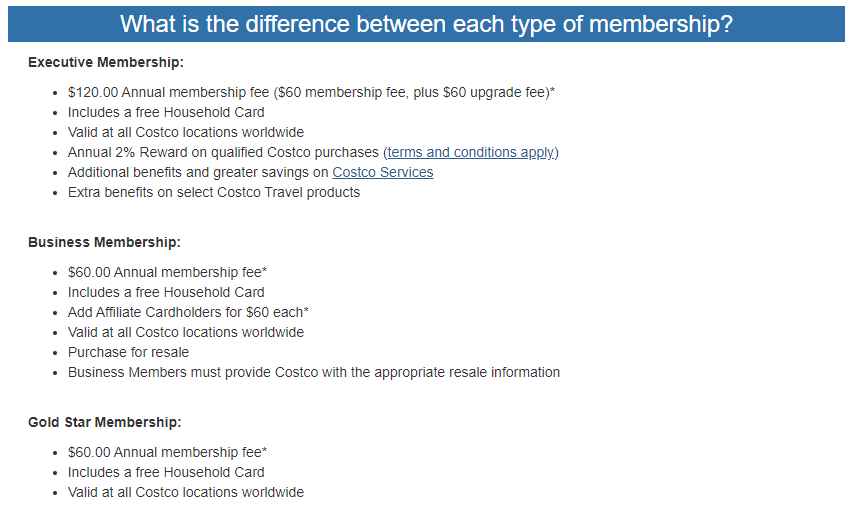
BJ’s
BJ’s Membership Options (BJ’s Website)
Comparing the subscription options for both companies, they are relatively similar in features and pricing (with BJ’s being slightly cheaper). These subscriptions aim to provide extensive value to customers by offering low prices and adding extra rewards for members. With these subscriptions, members can shop in-store, where the company makes nearly all of its sales.
Costco Vs. BJ’s – Operating Overview
In terms of sales, both Costco and BJ’s generate 2% of their sales from membership fees and the rest comes from selling food and other products in stores. A disaggregation of both companies’ revenues can be found below.
| Costco Revenue ($mm) | 2019 | 2020 | 2021 | 3-Year CAGR |
| Net Sales | 149,351 | 163,220 | 192,052 | 8.74% |
| % of revenue | 98% | 98% | 98% | 0.07% |
| Membership Fees | 3,352 | 3,541 | 3,877 | 4.97% |
| % of revenue | 2% | 2% | 2% | -3.40% |
| Total Revenue | 152,703 | 166,761 | 195,929 | 8.66% |
| BJ’s Revenue ($mm) | 2020 | 2021 | 2022 | 3-Year CAGR |
| Net Sales | 12,889 | 15,097 | 16,306 | 8.16% |
| % of revenue | 98% | 98% | 98% | 0.04% |
| Membership Fees | 302 | 333 | 361 | 6.10% |
| % of revenue | 2% | 2% | 2% | -1.85% |
| Total Revenue | 13,191 | 15,430 | 16,667 | 8.11% |
Source: Company 10-K SEC Filings
NOTE: Fiscal Years Are Different (This Is Why Years Are Not Directly Matched)
Both companies have similar trends in their revenue, with each growing revenues at a ~8-9% CAGR over the past three years. BJ’s has been able to outpace Costco’s growth in membership fees, however, growing at a 6.1% 3-year CAGR vs Costco’s 4.97%. While the difference is not extreme, it is important to point out that BJ’s is more than keeping up with the Wholesale giant.
In terms of free cash flow, BJ’s has done a tremendous job over the past few years at generating cash.
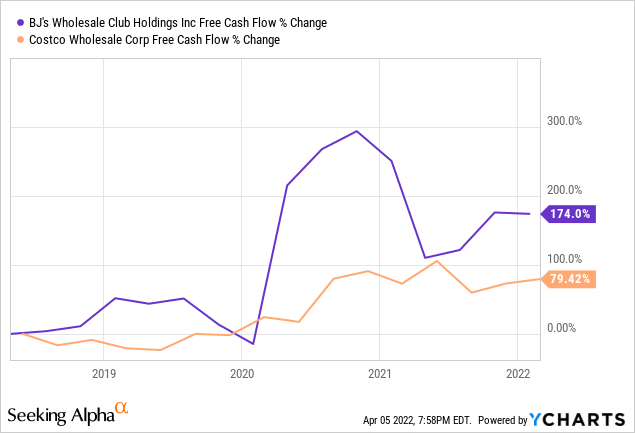
Since 2018, BJ’s has nearly tripled its free cash flow and continues to advantageously support shareholders. On November 18, 2021, the company announced a $500M share repurchase program, representing ~5.5% of the company’s current market cap. In 2019, Costco announced its own share , and still has $3.132B left in the coffer as of its recent quarterly report. While this is more than BJ’s in dollar terms, the $3.132B only represents 1.32% of the current market cap. Therefore, BJ’s repurchase program will provide ~4x more support than Costco’s.
Costco Vs. BJ’s Wholesale – Margins
Margins have held up remarkably well for both companies. A common argument for Costco over BJ’s could be the larger buying power that Costco has based on its sheer size. Its size gives it an advantage with suppliers to negotiate lower prices and buy in higher bulk. BJ’s seems to be keeping up just fine, however, as both companies’ profit margins are ~2.6% despite the higher costs they are seeing as a result of inflation.
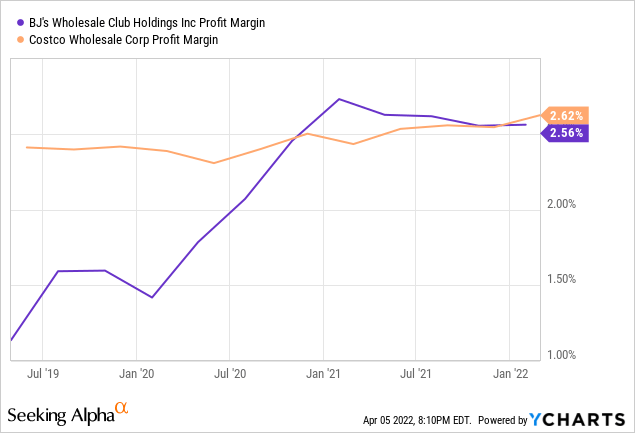
I argue that BJ’s is doing an even better job than Costco in managing higher costs as BJ’s merchandise gross margin (excluding gas) rose by 10 bps in the recent quarter versus Costco’s (excluding gas) shrinking 43 bps. Clearly BJ’s is keeping up, and the stock price performance over the past three years proves it. This can be shown in the company’s superiority in gross margin, detailed in the chart below.
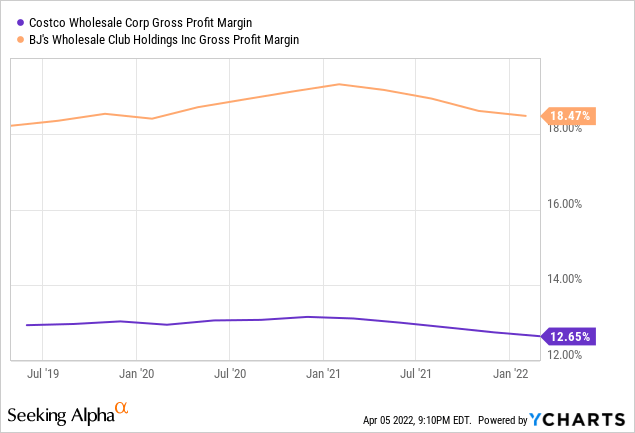
BJ’s gross margin is nearly 6% higher than Costco as it is able to maintain a low COGS due to its strong relationship with suppliers. This helps mitigate the impact of inflation and maintain margins, both of which BJ’s has done.
COST Vs. BJ – Stock Performance
A chart of both Costco and BJ’s stock prices can be found below.
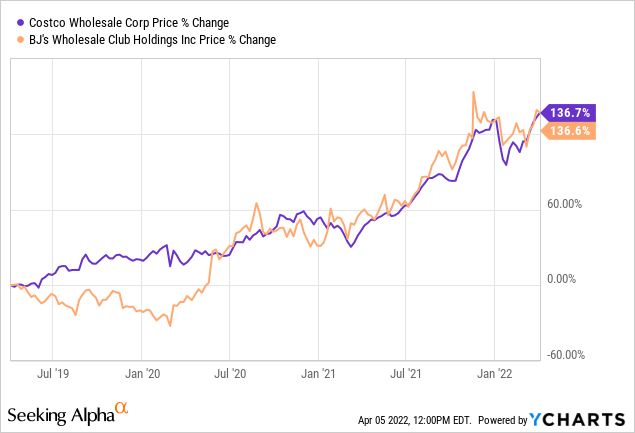
Both companies have returned almost exactly the same amount over the prior three years, but earnings have grown almost 4x faster for BJ’s than Costco.
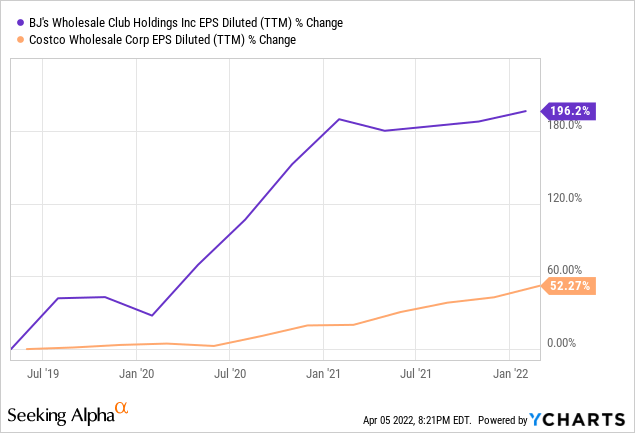
This discrepancy to me is alarming, especially considering the business models of both are virtually identical. This brings us to the valuation portion of the article which suggests the market is severely undervaluing BJ’s and overvaluing Costco.
COST & BJ Stocks Valuation
On a multiple basis, BJ’s is much cheaper than Costco. The chart below proves it.
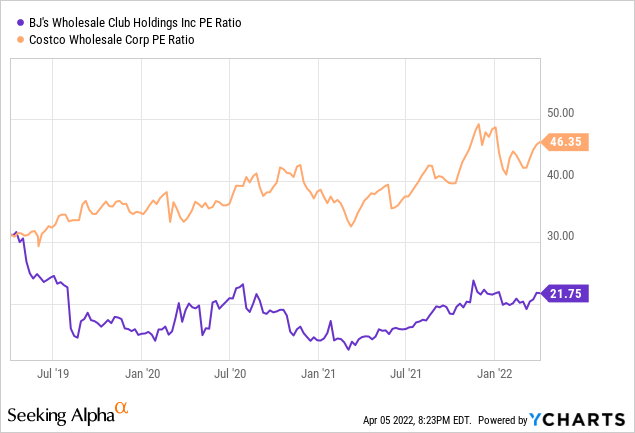
Over the past three years, BJ’s multiple has compressed while Costco’s has expanded. I anticipate a re-rating process of Costco’s multiple back to a more normalized level whilst BJ’s is set to expand as the market comes to senses with how well the company’s operations have been going.
Seeking Alpha seems to agree, ranking Costco’s valuation a whopping “F.”
Costco Valuation Score – Seeking Alpha (Seeking Alpha)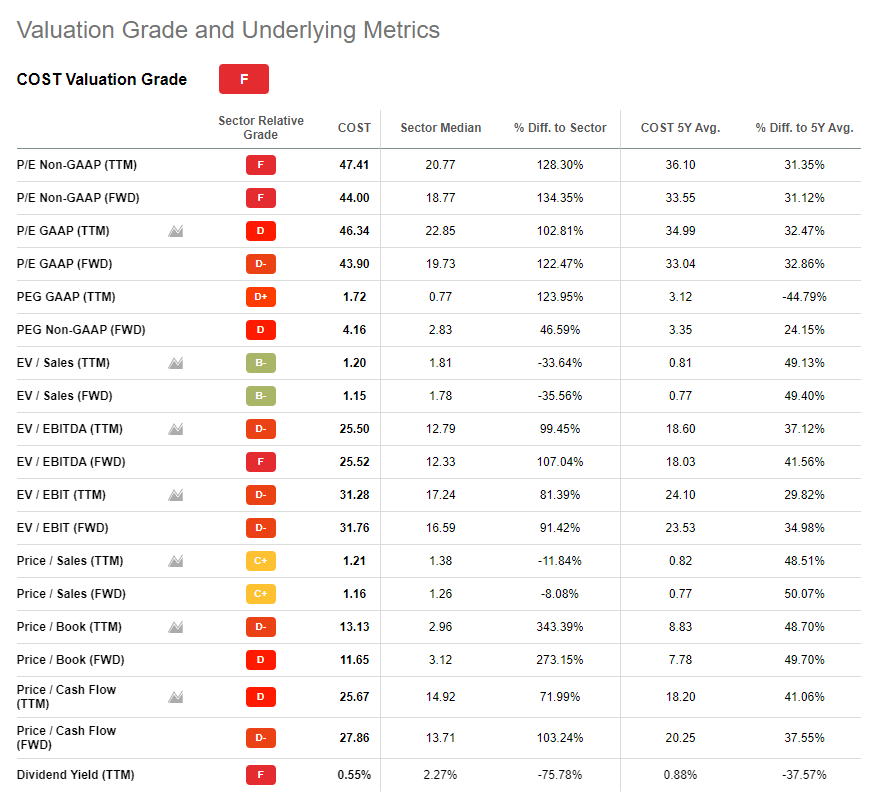
My DCF models tell the same story, as will be articulated below.
DCF Model: Costco
My DCF model for Costco is driven by my revenue assumptions over the next five years.
Costco Revenue Projection (Image made by author using own forecasts and assumptions)
NOTE: Fiscal Years Are Different (This Is Why Years Are Not Directly Matched)
I anticipate Costco maintaining strong growth over the next five years and growing its top line by a 5.49% 5-year CAGR. My DCF model can be found below.
Costco DCF Model (DCF model made by author using own assumptions and forecasts)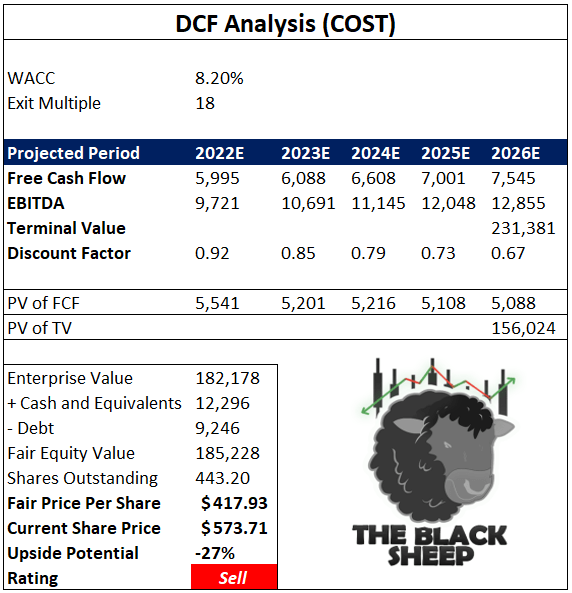
On top of my free cash flow and EBITDA assumptions (which can be found in the mode), I also assume a WACC of 8.20%, an exit multiple of 18 on year five EBITDA, and after subtracting net debt arrive at a fair share price of $417.93. This is roughly 27% below where the company is currently trading and suggests a selling opportunity.
DCF Model: BJ’s
For BJ’s my model is driven by my revenue projections as well.
Black Sheep Revenue Forecast BJ’s (Made by author using own calculations)
NOTE: Fiscal Years Are Different (This Is Why Years Are Not Directly Matched)
My 5.27% 5-year CAGR for BJ’s revenue (slightly lower than Costco) is based on the company continuing to expand its membership offerings (as it recently did by announcing a same-day delivery option). Assuming similar historical free cash flow and EBITDA margins, my DCF model can be found below.
BJs DCF Model (DCF made by author using own forecasts and assumptions)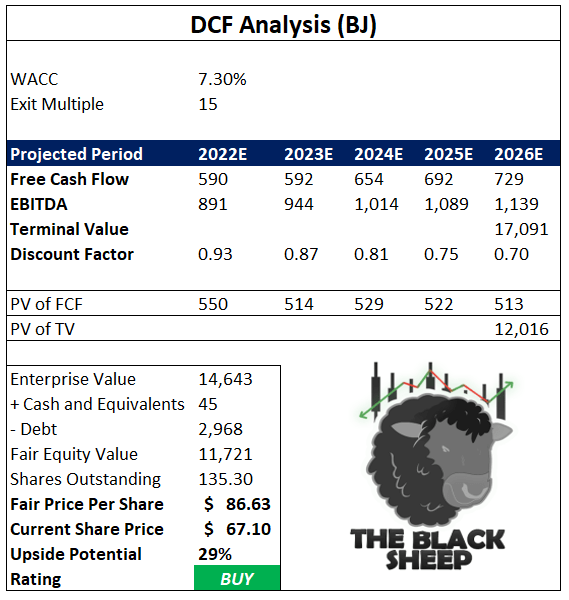
I assume a WACC of 7.30%, exit multiple of 15 on year five EBITDA, discount all cash flows/terminal value, subtract net debt, and arrive at a fair share price of $86.63. This suggests a buying opportunity with 29% upside potential.
Clearly, BJ’s offers a healthy margin of safety while Costco fails to provide the same.
Costco vs. BJ’s – Balance Sheet Comparison
Below is a table of some important balance sheet metrics for both Costco and BJ’s.
| Short Term Debt |
Costco |
BJ’s |
| Long Term Debt |
6.66B |
748.57M |
| Current Ratio |
1.03 |
0.76 |
| Quick Ratio |
0.46 |
0.11 |
| Covered Ratio |
48.36 |
10.86 |
| Book Value Per Share |
43.81 |
-2.96 |
| Debt/Free Cash Flow |
7.91 |
11.16 |
| Long Term Debt/Total Capital |
31.64% |
78.07% |
(Source: Seeking Alpha Peer Analysis Tool)
In my opinion, Costco has a slightly strong balance sheet than Costco. This is because BJ’s has over twice the amount of debt/total capital as Costco and a lower current ratio (1.03 vs .76). I am not overly concerned with this, as Costco is continuing to pay down debt. Management noted this on the company’s recent earnings call stating “beyond profitability, we also made significant progress on our balance sheet, paying off $360M of debt and bringing leverage to less than 1 turn versus nearly 3 turns just 3 years ago.” Given management is prioritizing this, I do not see the company’s current debt load holding the company back in the long run.
Final Thoughts
It is no doubt that both Costco and BJ’s have done a terrific job over the past few years at expanding operations and increasing shareholder value. The stock chart comparison between the two companies above proves it. But going forward, I believe BJ’s performance will outpace Costco as the market comes to sense with the durability of its business model and its similarity to Costco’s. I advocate investors get interested in BJ’s given the cheap valuation currently and become more constructive on Costco as the valuation has gone too far too fast. I rate Costco shares a sell and BJ’s a strong buy based on this analysis.
Be the first to comment