

Sundry Photography
Introduction
San Antonio-based Valero Energy Corp. (NYSE:VLO) released its third-quarter 2022 results on October 25, 2022.
Note: This article is an update to my article published on September 23, 2022. I have followed VLO on Seeking Alpha since December 2017.
Valero Energy is one of the three refiners I follow quarterly: Marathon Petroleum, Phillips66, and Valero Energy.
For those interested in Marathon Petroleum, you can read my article about the third quarter by clicking here.
Valero’s assets are extensive and spread mostly in North America.
VLO Assets Map (VLO Presentation)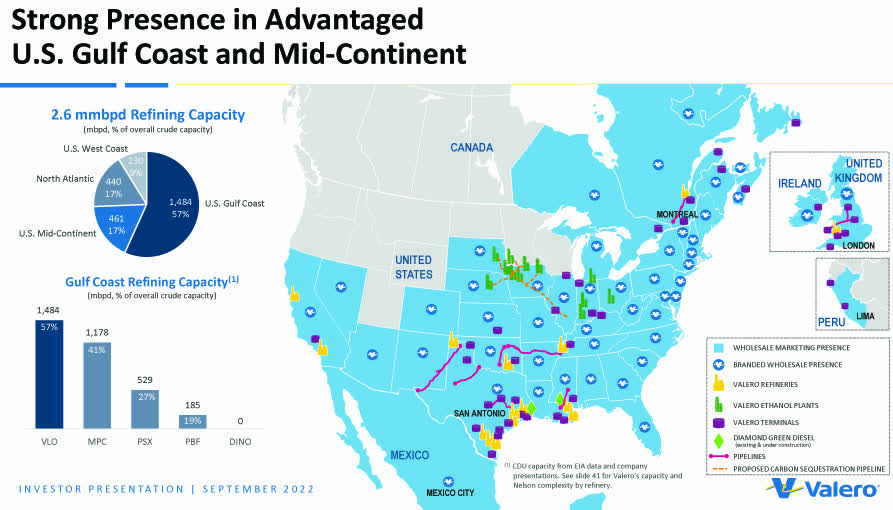
1 – 3Q22 results snapshot
The U.S. refiner reported third-quarter 2022 adjusted earnings of $7.14 per share, significantly increasing from $1.22 per share in the year-ago quarter. The results beat analysts’ expectations.
Total revenues surged from 29,520 million last year’s quarter to $44,454 million in 3Q22, which was over the consensus estimate.
Increased refinery throughput volumes and a higher refining margin supported the better-than results.
Joe Gorder, Valero’s Chairman, and Chief Executive Officer said in the press release:
Refining fundamentals remain strong as product demand through our system has surpassed 2019 levels, while global product supply remains constrained due to capacity reductions and high natural gas prices in Europe are setting a higher floor on margins,… We continue to maximize refining utilization in a safe, reliable and environmentally responsible manner to provide essential products.
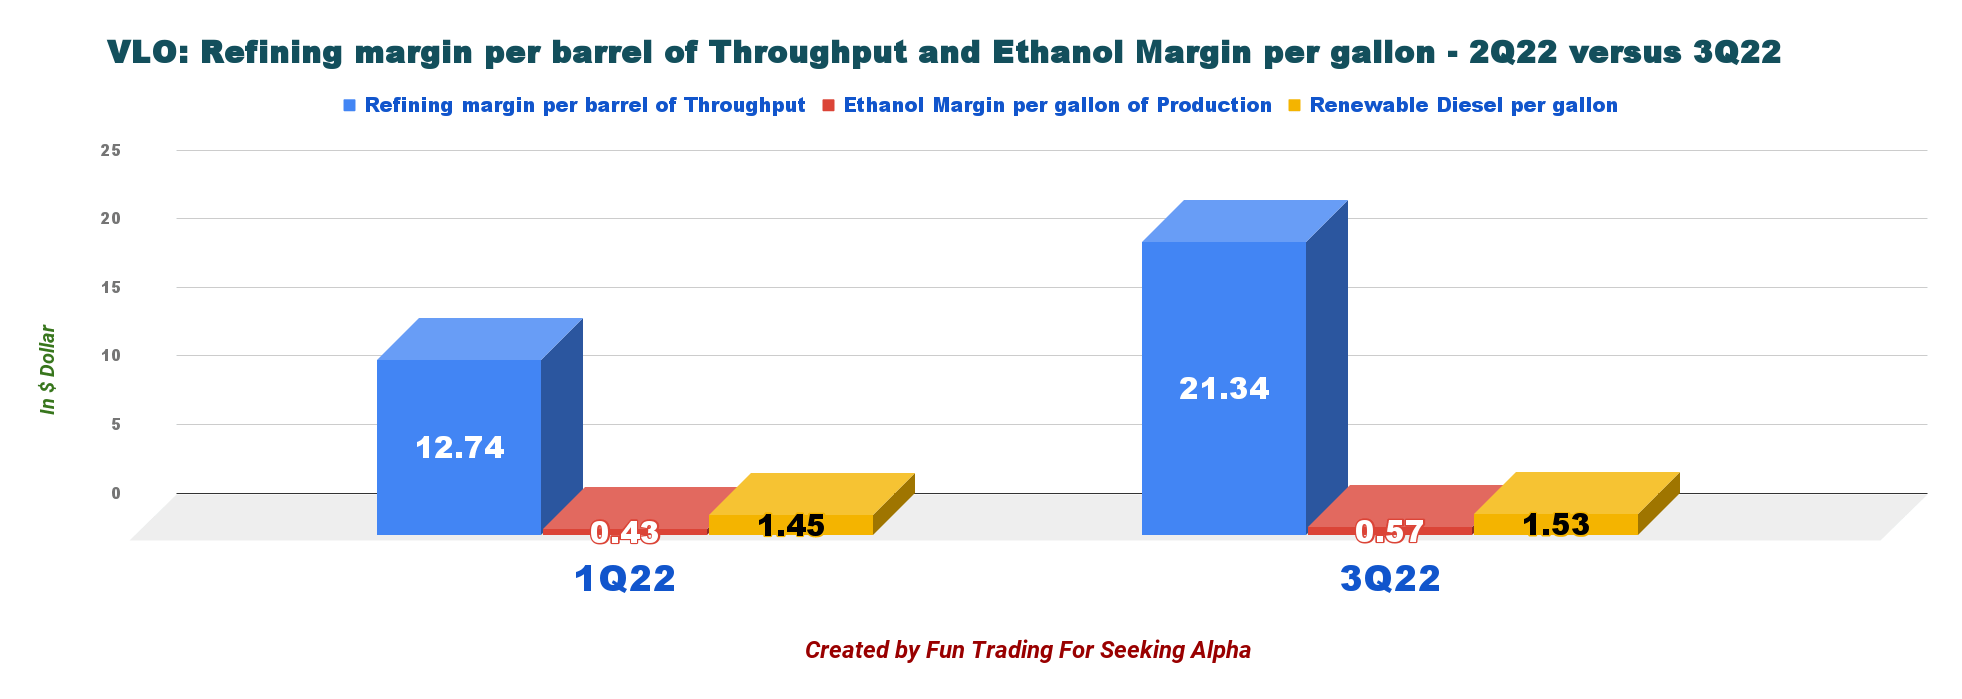
VLO Operating income per segment 4Q21 to 3Q22 (Fun Trading) The refining margin per barrel of throughput increased to $21.34 from $10.07 the preceding year, while the ethanol margin increased to $0.57 from $0.46. However, refining margins dropped significantly from 2Q22. VLO Quarterly Refining margin per gallon 3Q22 (Fun Trading) CEO Joe Gorder said in the conference call: Refining margins remain supported by strong product demand, low product inventories and continued energy cost advantages for US refineries compared to global competitors.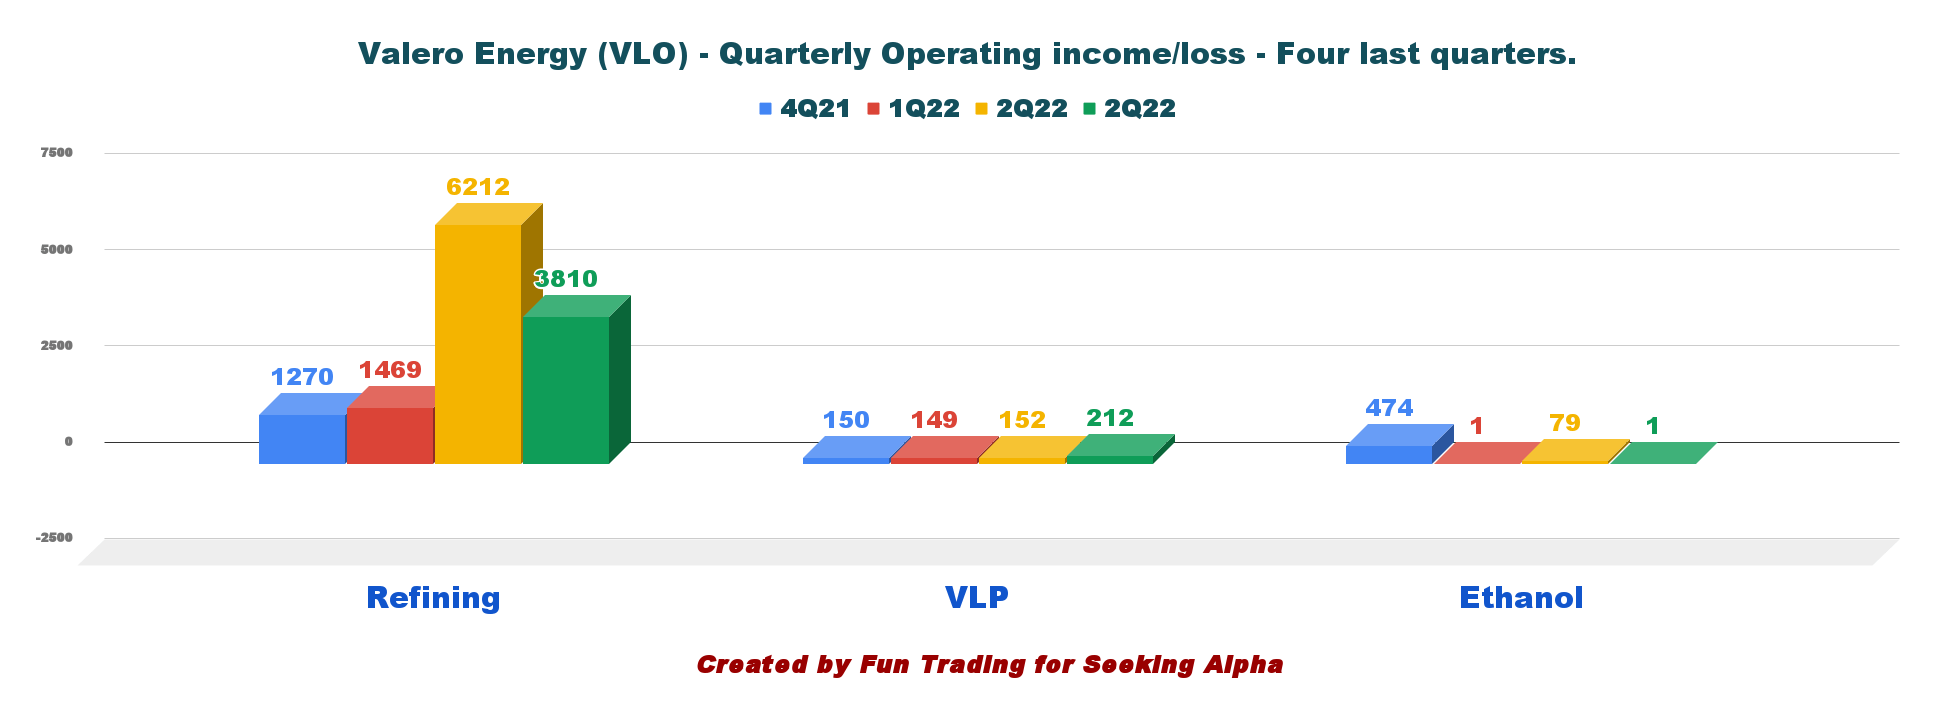
2- Investment Thesis
I have been a long-term VLO shareholder for many years and plan to keep a sizeable part of my long position. However, VLO has rebounded exceptionally well since October and has reached an over-valuation again, which has been one of the triggers for a substantial sale of my VLO position at over $141.
The third quarter showed lower margins than those experienced in the second quarter, but the stock continued to climb.
The Fed’s action on interest rates to fight rampant inflation will likely affect the economy and demand for fuel in H1 2023. Analysts are still debating whether the FED will hike interest rates by 75 points or 50 points on December 14. However, the final rate is now expected to be over 5%, which implies a more extended rate increase period.
The November rate hike was a large and unanimous 0.75 percentage point increase in rates from policy-makers. However, the Fed has noted that it is likely approaching the maximum level of interest rates that it wants to see. Setting rates too high for too long, may cause unnecessary pain and, would start to materially increase the cost of servicing the relatively large national debt.
The crucial issue at stake here is the extreme volatility of the refining sector, which requires a particular trading/investing strategy that I promote in my marketplace, “The gold and oil corner.”
I believe trading short-term LIFO and profit from those wild fluctuations attached to this cyclical industry is essential. I recommend using about 40%-60% of your short-term position while keeping a core long-term for a much higher target or enjoying steady dividends.
VLO pays a dividend yield of 2.82%, which is relatively high and safe.
VLO, MPC, PSX Dividend yield (Fun Trading)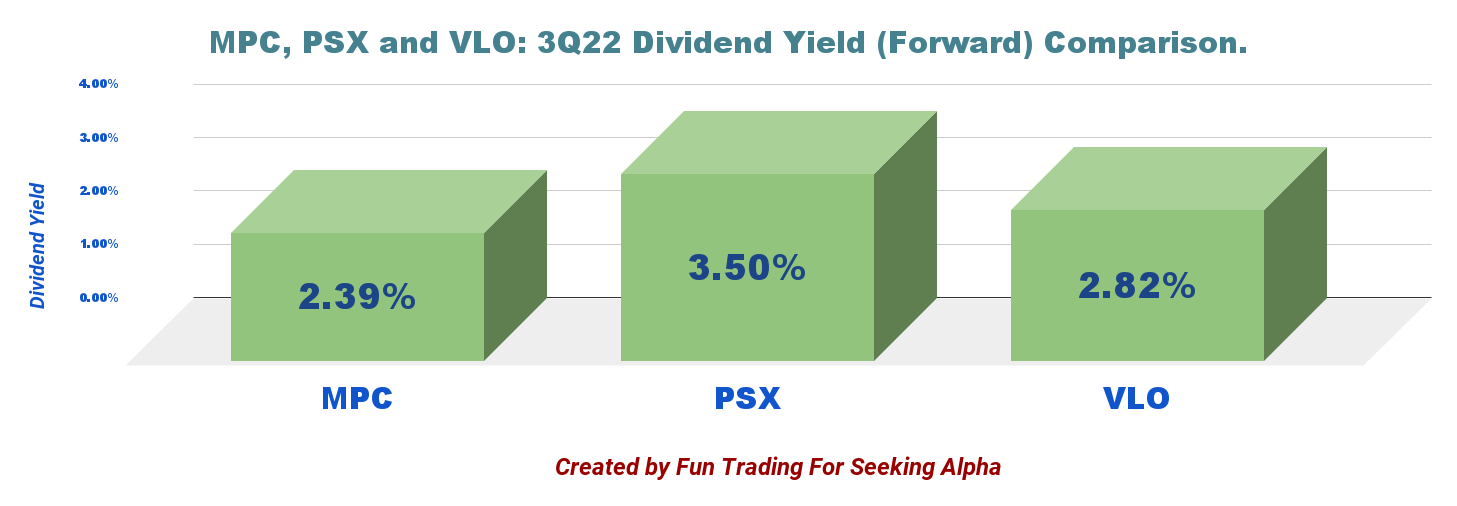
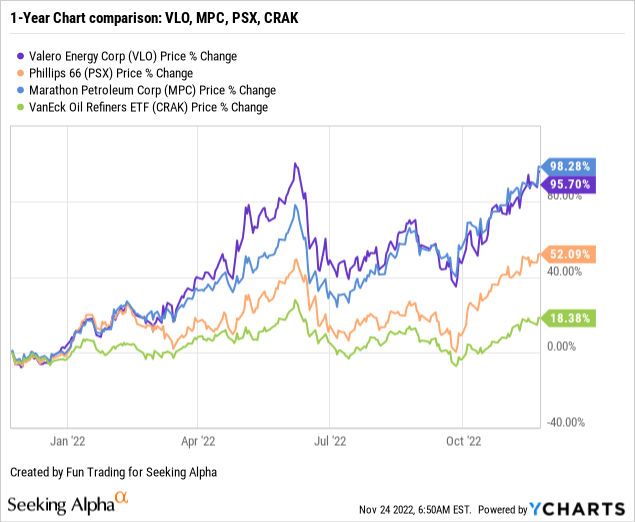
3 – Stock performance
VLO is now up 96% on a one-year basis, outperforming Phillips 66 (PSX) but very close to Marathon Petroleum (MPC). The stock price has reached the June record level again.
Valero Energy: Selected Financials – The Raw Numbers (Third Quarter Of 2022)
| Valero Energy | 3Q21 | 4Q21 | 1Q22 | 2Q22 | 3Q22 |
| Total Revenues in $ Billion | 29.52 | 35.90 | 38.54 | 51.64 | 44.45 |
| Net Income in $ Million | 463 | 1,009 | 905 | 4,693 | 2,817 |
| EBITDA $ Million | 1,366 | 2,029 | 1,970 | 6,854 | 4,498 |
| EPS diluted in $/share | 1.13 | 2.46 | 2.21 | 11.57 | 7.19 |
| Operating cash flow in $ Million | 1,449 | 2,454 | 588 | 5,845 | 2,045 |
| CapEx in $ Million | 463 | 398 | 384 | 417 | 463 |
| Free Cash Flow in $ Million | 986 | 2,056 | 204 | 5,428 | 1,582 |
| Total Cash $ Billion | 3.498 | 4.122 | 2.638 | 5.392 | 3.969 |
| Total L.T. Debt (incl. current) in $ Billion | 14.23 | 11.95 | 13.16 | 12.88 | 11.58 |
| Dividend per share in $ | 0.98 | 0.98 | 0.98 | 0.98 | 0.98 |
| Shares Outstanding (Diluted) in Million | 408 | 407 | 408 | 404 | 390 |
| Oil, N.G. & Ethanol Production | 3Q21 | 4Q21 | 1Q22 | 2Q22 | 3Q22 |
| Throughput volume in K Bop/d | 2,864 | 3,033 | 2,800 | 2,962 | 3,005 |
| Ethanol in K gallon p/d | 3,625 | 4,402 | 4,045 | 3,861 | 3,498 |
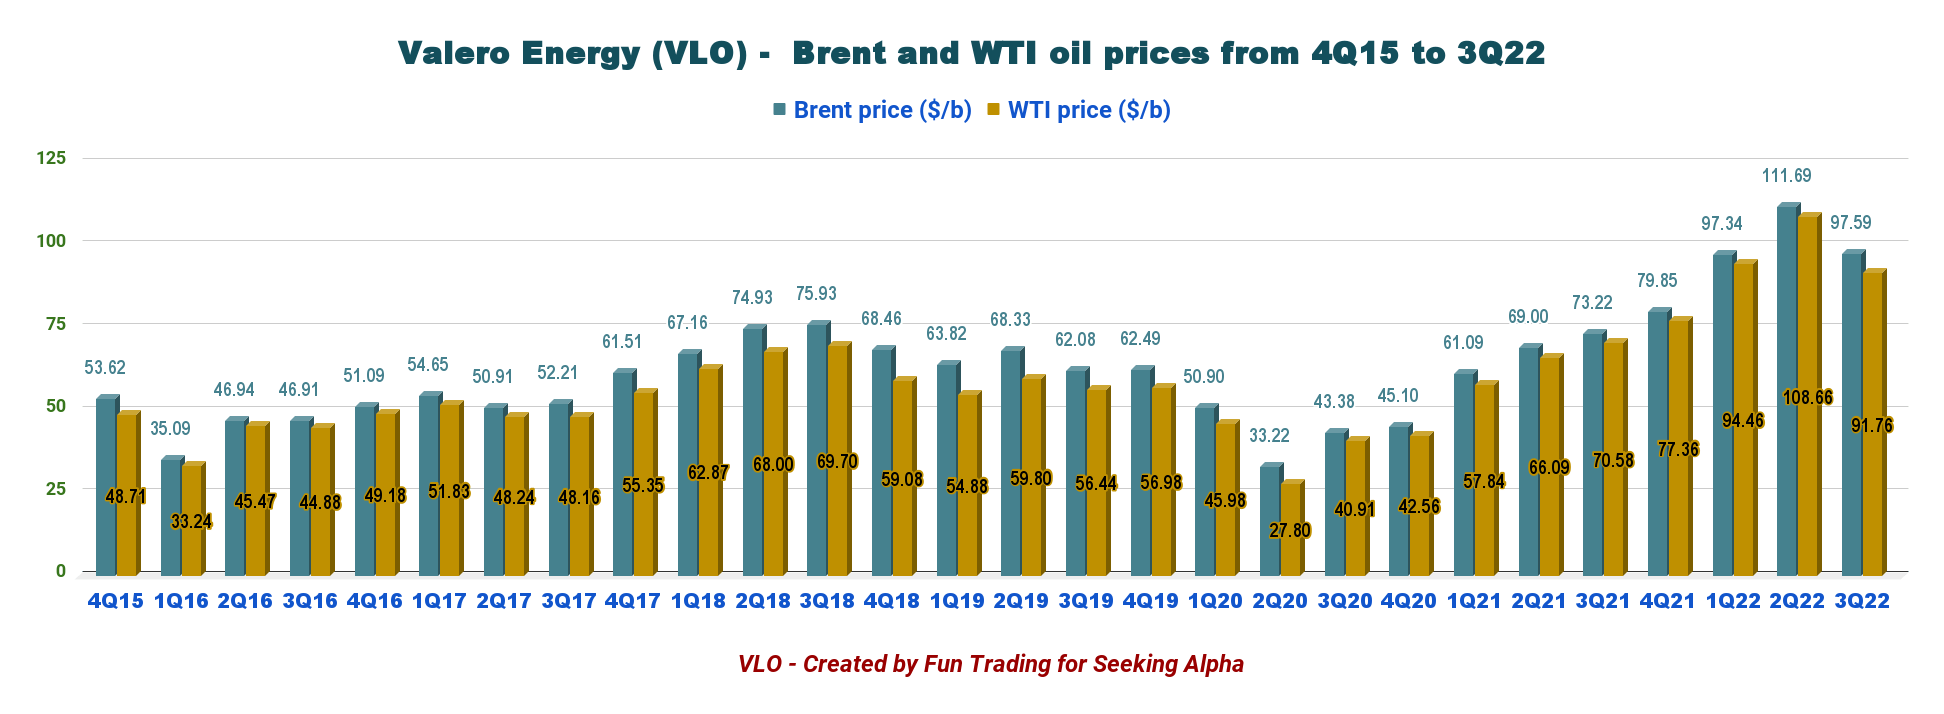
| Brent price ($/b) | 73.22 | 79.85 | 97.34 | 111.69 | 97.59 |
| WTI price ($/b) | 70.58 | 77.36 | 94.46 | 108.66 | 91.76 |
| Natural gas price ($/MM Btu) | 4.25 | 4.54 | 4.32 | 7.23 | 7.31 |
Source: VLO PR
Revenues, Earnings Details, Free Cash Flow, Throughput Volume, Ethanol Production, And Margins
1 – Revenues were a record of $51.64 billion in 2Q22
VLO Quarterly revenues history (Fun Trading)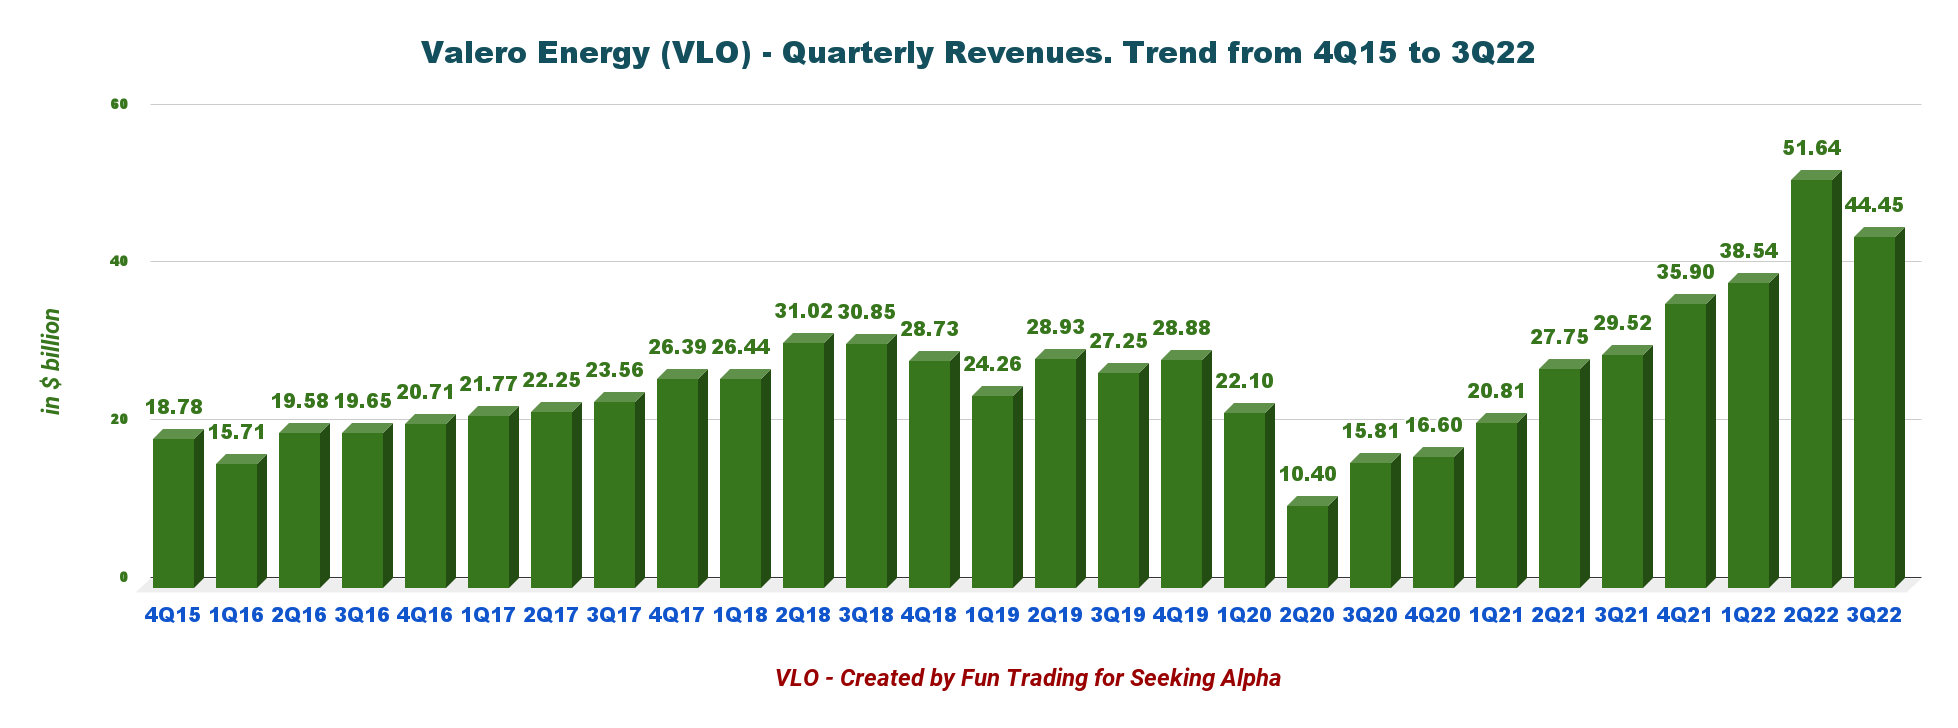
Valero Energy’s revenue for the third quarter was $44.45 billion. The company posted a quarterly income of $7.19 per diluted share compared to $1.13 last year. VLO reported adjusted net income attributable to Valero stockholders of $2.8 billion, or $7.14 per share.
The total cost of sales rose to $40,431 million from $28,602 million last year, primarily due to the higher cost of materials.
Review of the different segments:
- The refining segment: The operating Income was $3,816 million compared to $911 million in the year-ago quarter. Higher refinery throughput volumes supported the refining segment again this quarter.
- The Ethanol segment: The adjusted operating profit was $1 million compared to $4 million in the second quarter of 2021. Lower ethanol production volumes impair the segment. Production declined to 3,498 thousand gallons per day from 3,625 thousand gallons a year ago.
- The Renewable Diesel segment: The segment’s operating income dropped to $212 million compared to $109 million in the year-ago period. Renewable diesel sales volumes increased to 2,231 thousand gallons per day from 671 thousand gallons a year ago.
2 – Free cash flow in 3Q22 was $1,582 million.
VLO Quarterly Free cash flow history (Fun Trading)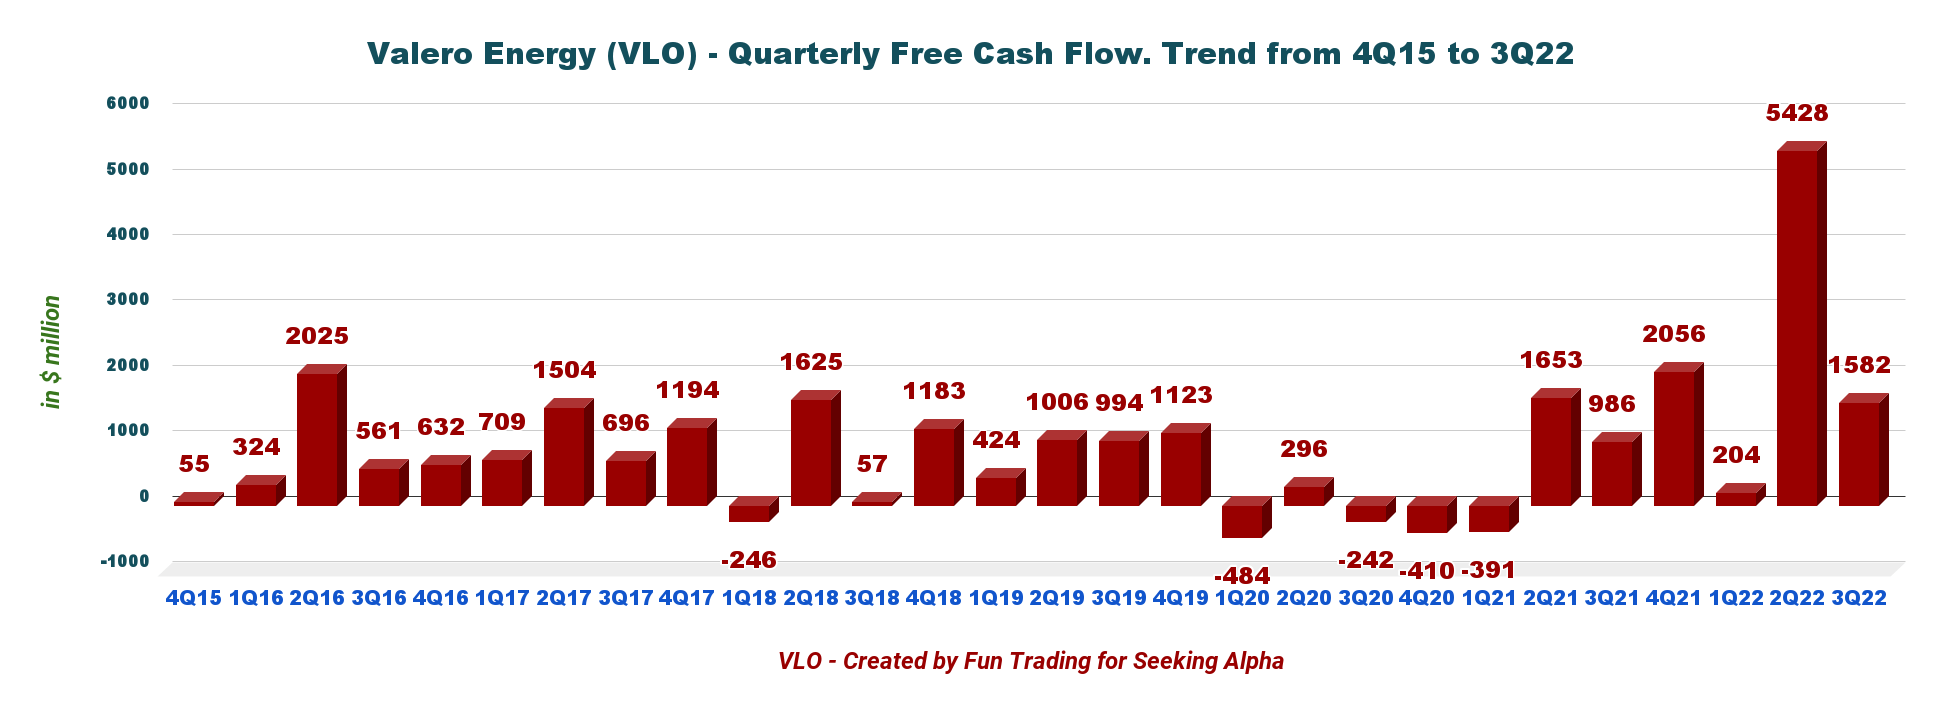
Note: The generic free cash flow is the Cash from operating activities minus CapEx.
VLO had a trailing 12-month ttm free cash flow of $9,160 million. Free cash flow for the third quarter is $1,542 million, significantly up sequentially.
The quarterly dividend is unchanged at $0.98 per share.
3 – Net debt was $7.61 billion as of September 30, 2022
VLO Quarterly Cash versus Debt history (Fun Trading)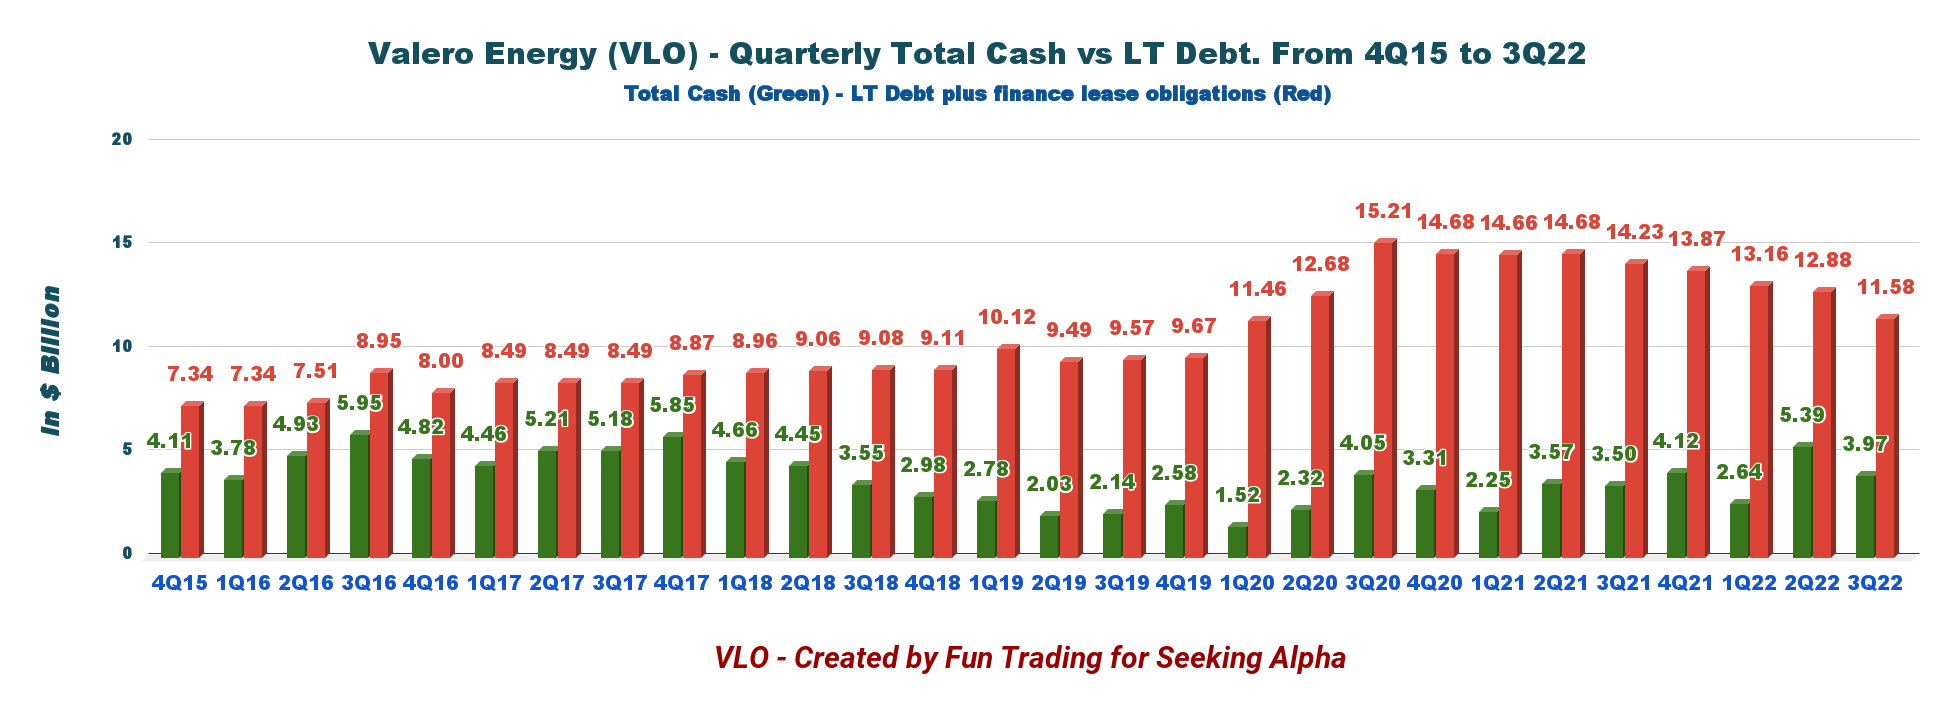
Valero Energy had total Cash of $3,969 million in 3Q22, up from $3,498 million last year. Total debt and finance lease obligations were $11,576 million compared to $14,233 million last year.
The debt-to-capitalization ratio, net of Cash and cash equivalents, was 24% as of September 30, 2022.
Valero reduced debt by $1.25 billion in September, bringing Valero’s aggregate debt reduction since the second half of 2021 to approximately $3.6 billion.
4 – Throughput and ethanol production in 3Q22
VLO Quarterly Throughput and Ethanol History (Fun Trading)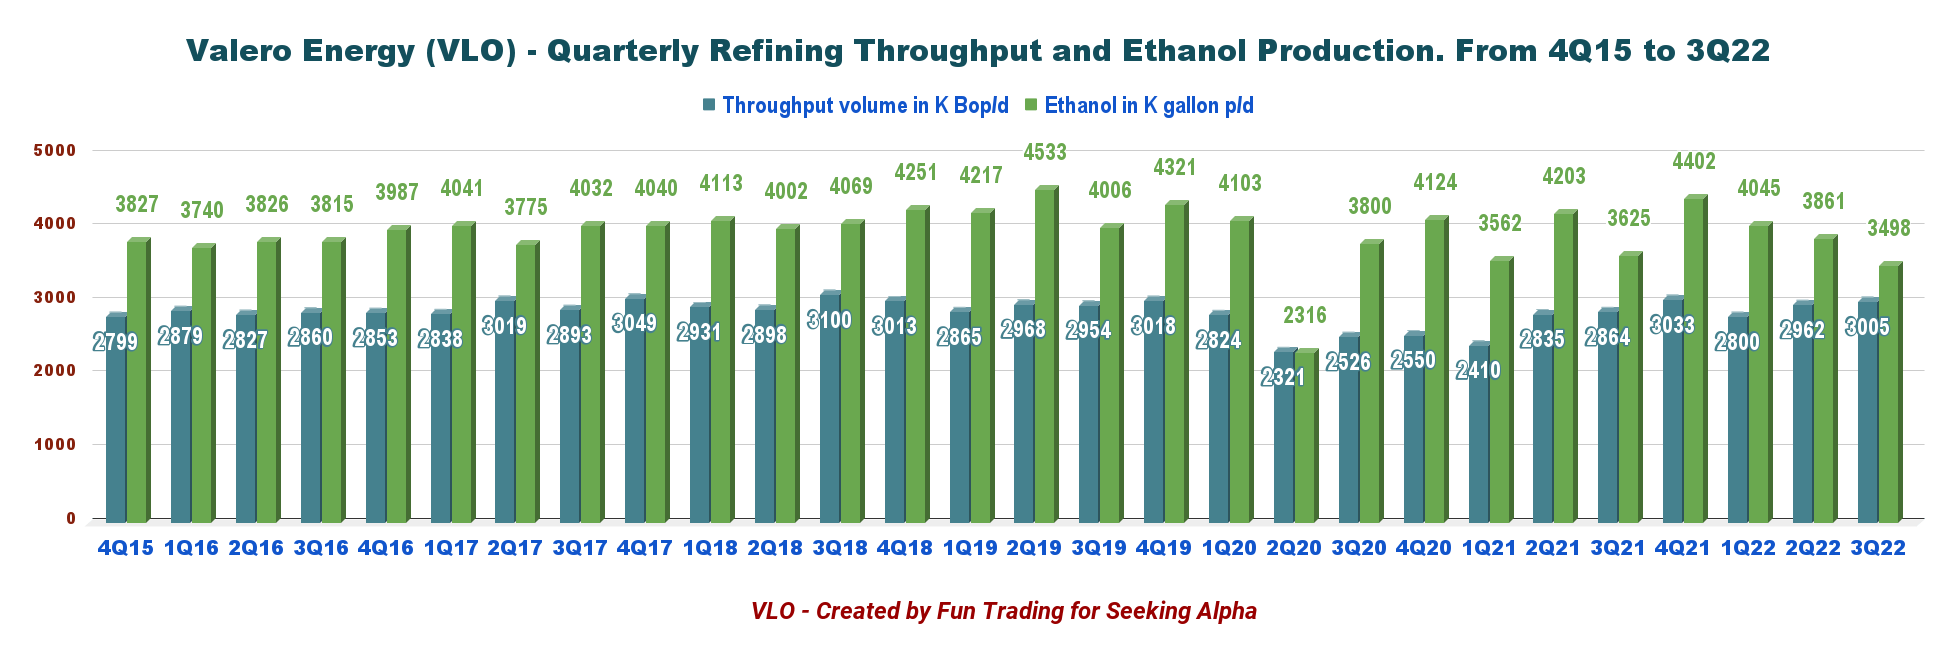
Refining throughput volumes were 3,005K barrels per day for the third quarter, up 4.9% from last year. Sweet crude oil is the most important segment.
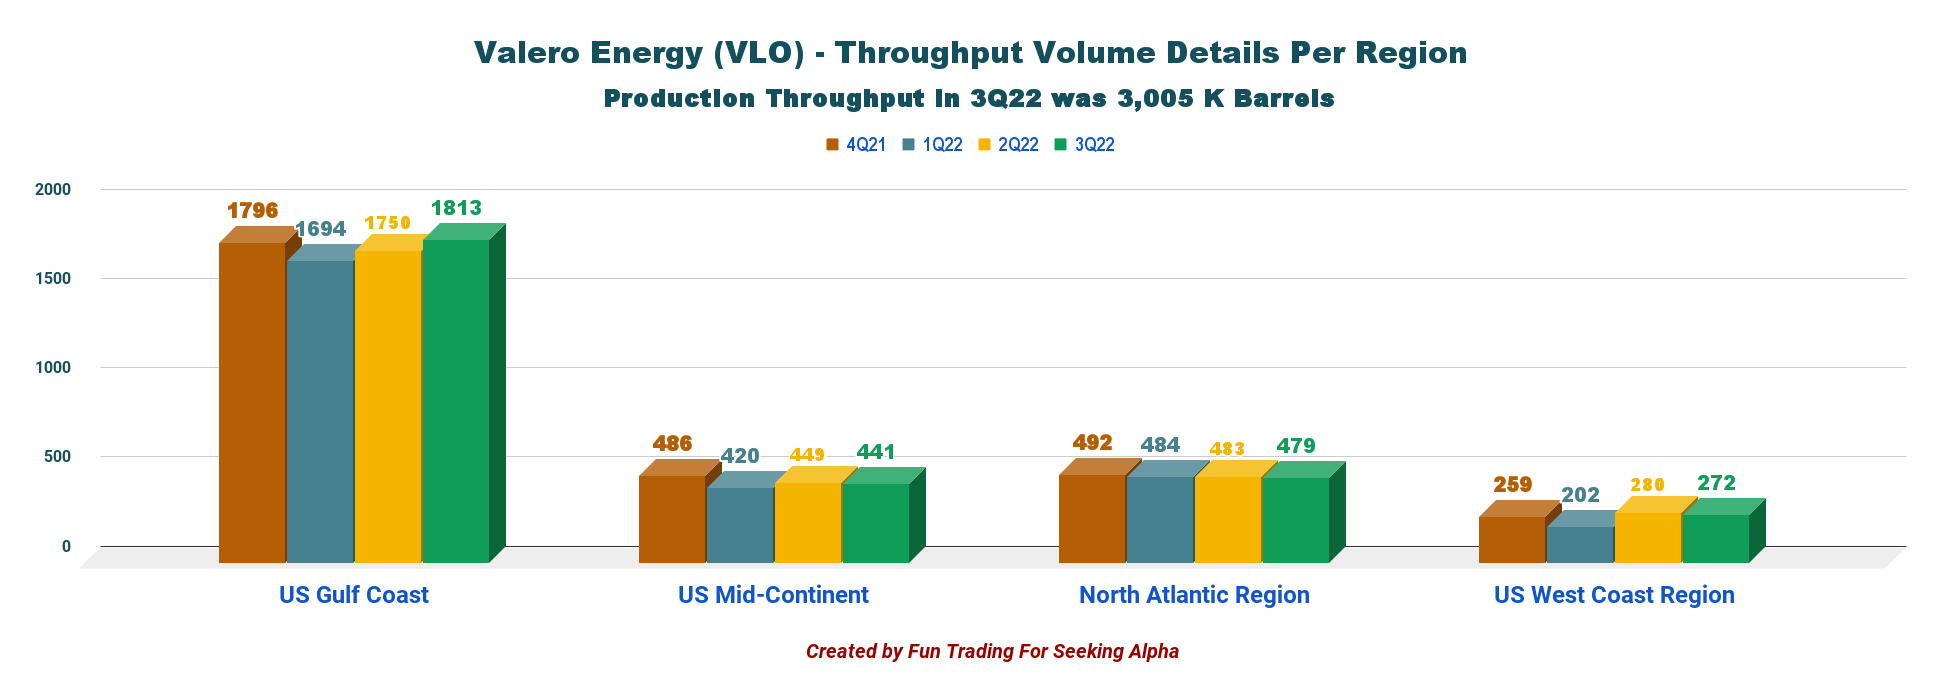
VLO Throughput per segment (Fun Trading) VLO Volume detail per region (Fun Trading) VLO Quarterly Brent and WTI prices history (Fun Trading)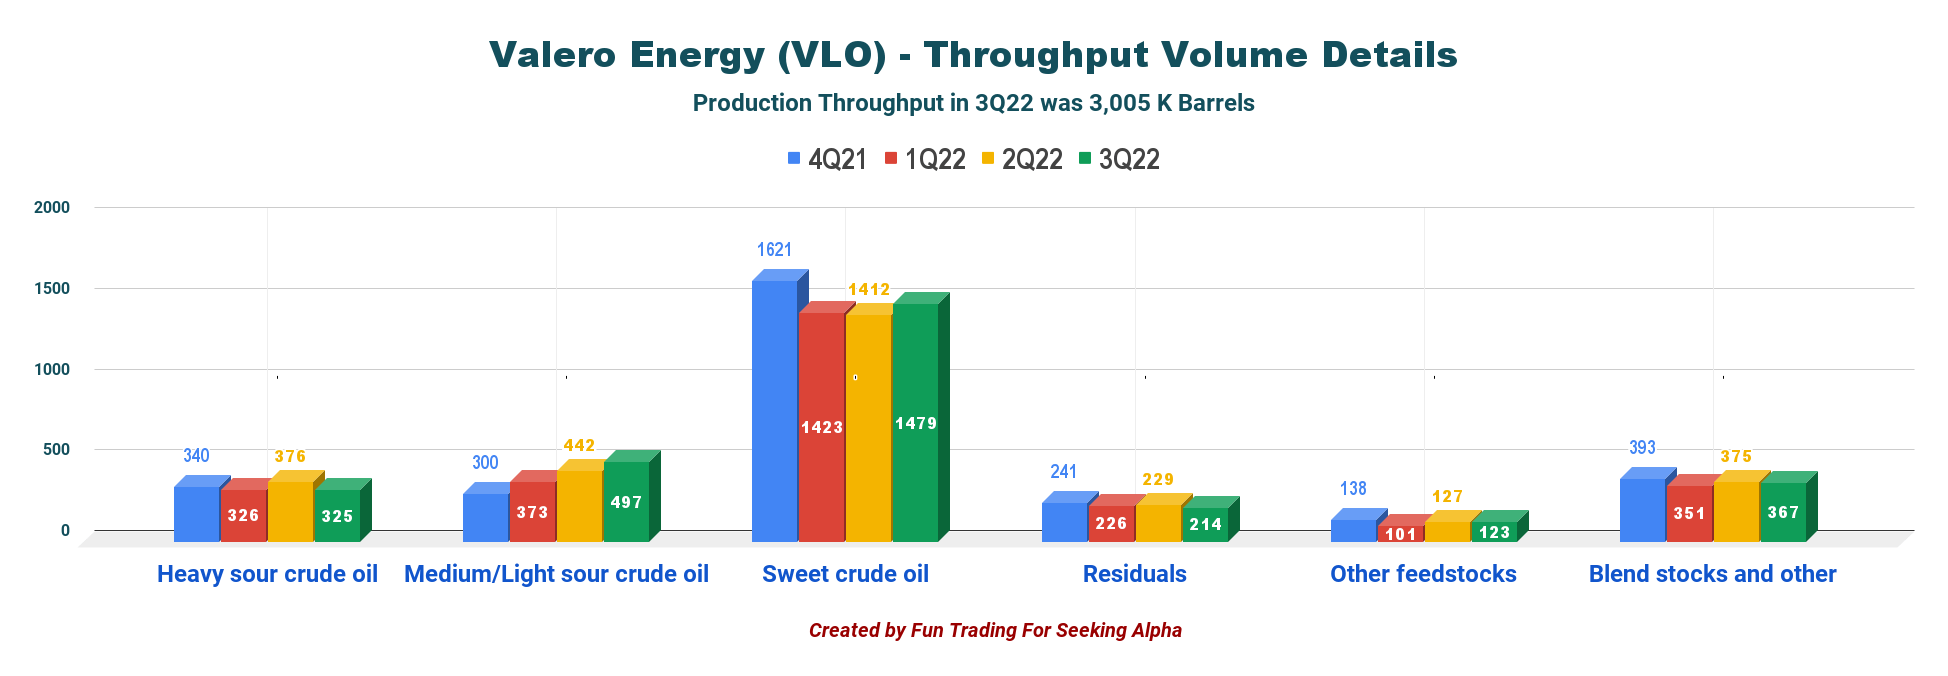
Technical Analysis (Short-Term) And Commentary
VLO TA Chart short-term (Fun Trading StockCharts)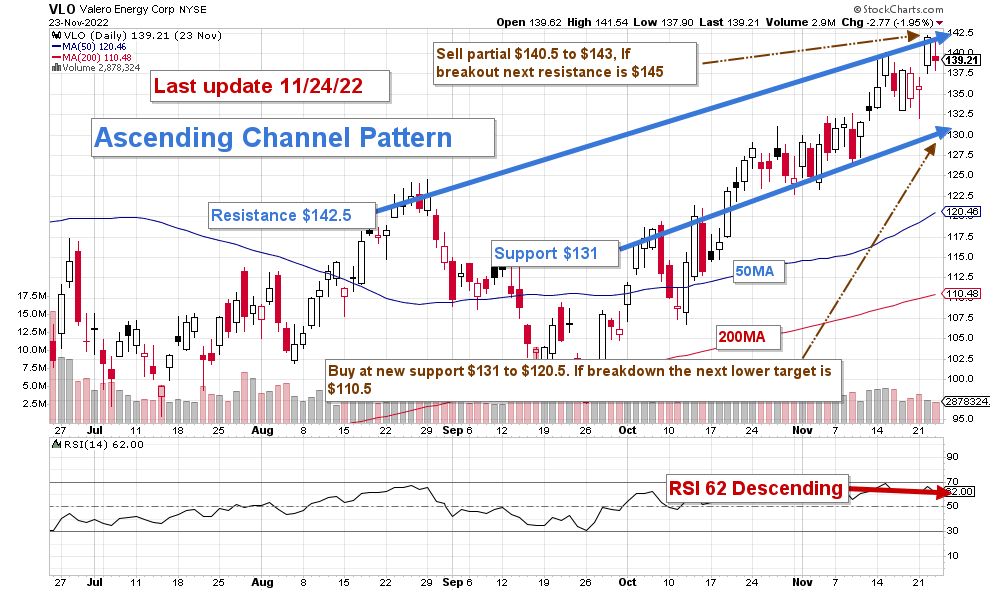
Note: The chart has been adjusted for the dividend.
VLO forms a descending triangle pattern with resistance at $142.5 and support at $131.
I regularly promote in my marketplace, “The gold and oil corner,” is to keep a core long-term position and use about 40%-60% to trade LIFO (see note below) while waiting for a higher final price target for your core position.
However, the stock price has reached a very high valuation now, and I believe it will be hard to get a substantial increase from where we stand now. I have been wrong before, and it is only my opinion.
Thus, the trading strategy is to sell about 40%-60% at or above $140.5 with possible higher resistance at $145 and wait for a retracement between $131 and $120.50 with possible lower support at $110.5.
The most probable scenario is that VLO loses its strong momentum and drops to the mid-120s. Thus, I recommend buying VLO for between $130 to $120.
Note: The LIFO method is prohibited under International Financial Reporting Standards (IFRS), though it is permitted in the United States by Generally Accepted Accounting Principles (GAAP). Therefore, only U.S. traders can apply this method. Those who cannot trade LIFO can use an alternative by setting two different accounts for the same stock, one for the long term and one for short-term trading.
Warning: The TA chart must be updated frequently to be relevant. It is what I am doing in my stock tracker. The chart above has a possible validity of about a week. Remember, the T.A. chart is a tool only to help you adopt the right strategy. It is not a way to foresee the future. No one and nothing can.
Author’s note: If you find value in this article and would like to encourage such continued efforts, please click the “Like” button below to vote of support. Thanks.
Be the first to comment