

morkeman
1 – Introduction
On July 14, 2022, VAALCO Energy (NYSE:EGY) and TransGlobe Energy Corporation (TGA) announced they had agreed to merge in an all-stock strategic business combination transaction valued at $307 million.
Under the terms of the Arrangement Agreement, VAALCO will acquire each TransGlobe share for 0.6727 of a VAALCO share of common stock, which represents a 24.9 percent premium per TransGlobe common share based on the companies’ respective 30-day volume weighted average share prices as of market close on July 13, 2022. The Transaction will result in VAALCO stockholders owning approximately 54.5 percent and TransGlobe shareholders owning approximately 45.5 percent of the Combined Company.
A look at the two companies and their attributed portion of the Newco, we can say that they have been evaluated as quasi-equivalent with only a tiny premium for EGY.
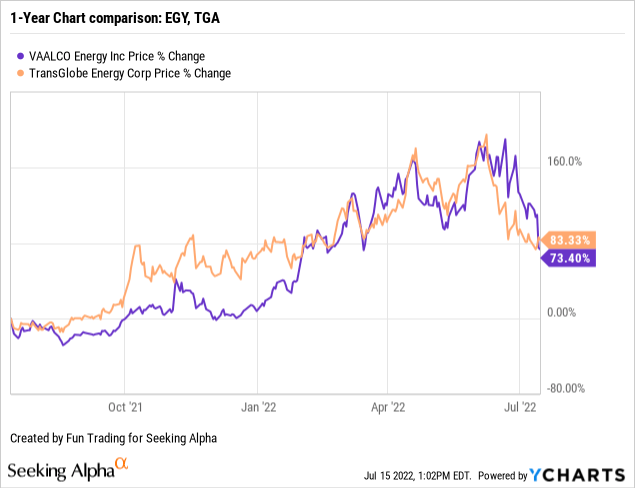
Also, if we glance at the stock performance, we can see that both companies have done fantastic on a one-year basis and, despite some recent retracement, are still up significantly. TGA is up 83%, while EGY is up 73% after falling hard after the merger was announced.
2 – The combined company’s assets (Newco)
EGY TGA Presentation (EGY-TGA Presentation)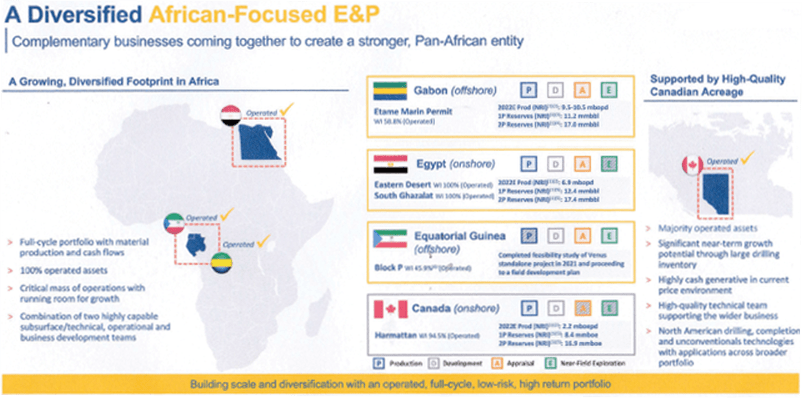
In the recent merger presentation, Newco lists four different assets:
- Offshore Gabon (WI 58.8%): Etame Marin Permit, with 17.0 MMBBL (“NRI”) in mineral proven and probable 2P. 2022 Production estimated is 9.75 K Bopd (mid-point).
- Onshore Egypt (WI 100%): The Eastern Desert and South Ghazalat with 17.4 MMBBL (“NRI”) in mineral proven and probable 2P. 2022 Production estimated is 6.9 K Bopd.
- Offshore Equatorial Guinea (WI 45.9%) (Project phase): Proceeding to a field development plan after completing the feasibility study of Venus.
- Onshore Canada (WI 94.5%): Harmattan with 16.9 MMBOE (“NRI”) in mineral proven and probable 2P. 2022 Production estimated is 2.4 K Boepd (67.4% liquids).
3 – VAALCO Energy and TransGlobe – Quarterly Balance Sheet History – The Raw numbers
|
VAALCO Energy |
1Q21 | 2Q21 | 3Q21 | 4Q21 | 1Q22 | TransGlobe | 1Q21 | 2Q21 | 3Q21 | 4Q21 | 1Q22 |
| Total Revenues and others in $ Million | 45.65 | 53.14 | 63.95 | 65.20 | 77.60 | Total Revenues and others in $ Million | 18.05 | 50.63 | 57.87 | 177.41 | 52.95 |
| Net Income in $ Million | 9.87 | 5.88 | 31.72 | 34.36 | 12.16 | Net Income in $ Million | -11.02 | 7.72 | 37.08 | 6.56 | 48.81 |
| EBITDA $ Million | 18.59 | 25.08 | 27.32 | 30.05 | 45.17 | EBITDA $ Million | -1.08 | 20.62 | 50.00 | 19.69 | 64.79 |
| EPS diluted in $/share | 0.17 | 0.10 | 0.53 | 0.58 | 0.21 | EPS diluted in $/share | -0.15 | 0.11 | 0.51 | 0.09 | 0.66 |
| Cash from Operation activities in $ Million | 1.74 | 11.42 | 33.56 | 3.40 | −0.76 | Cash from Operations activities in $ Million | -3.94 | 23.83 | 27.03 | -1.96 | -23.78 |
| CapEx in $ Million | 19.06 | 7.75 | 4.16 | 8.10 | 23.15 | CapEx in $ Million | 2.89 | 3.57 | 11.58 | 8.68 | 8.66 |
| Free Cash Flow in $ Million | −17.3 | 3.67 | 29.40 | −4.70 | −23.91 | Free Cash Flow in $ Million | -6.83 | 20.26 | 15.45 | -10.64 | -32.44 |
| Total Cash $ Million | 19.25 | 22.88 | 52.84 | 48.68 | 18.94 | Total Cash $ Million | 28.67 | 43.64 | 53.95 | 37.93 | 37.25 |
| Total LT Debt / Op. Lease liability in $ Million | 0.00 | 0.00 | 0.00 | 0.00 | 0.00 | Total LT Debt / Op. Lease liability in $ Million | 21.70 | 16.95 | 6.88 | 3.04 | 3.14 |
| Shares outstanding (diluted) in Million | 58.46 | 58.57 | 58.92 | 59.06 | 59.18 | Shares outstanding (diluted) in Million | 72.89 | 72.92 | 72.98 | 73.78 | 74.32 |
| Oil Production | 1Q21 | 2Q21 | 3Q21 | 4Q21 | 1Q22 | Oil Production | 1Q21 | 2Q21 | 3Q21 | 4Q21 | 1Q22 |
| Oil Production in Bopd average | 5,180 | 8,018 | 7,694 | 7,554 | 8,051 | Oil Production in Boepd average | 12,221 | 13,077 | 13,342 | 12,763 | 12,446 |
| Oil price realized $/ Bo | 61.31 | 69.61 | 73.02 | 77.31 | 109.65 | Oil price realized $/ Boe | 48.47 | 56.48 | 60.85 | 67.03 | 75.70 |
Source: SEC filing EGY/TGA
4 – A few comments from the table above – plus and minus.
-
VAALCO Energy production is oil, whereas TransGlobe is a combination of oil and natural gas. As you can see above, EGY realized a price of $109.65 per barrel of oil in 1Q22 against $75.70 per Boe for TGA. Hence, revenues are much higher for EGY than for TGA. This trend will increase for EGY with a higher production volume in the next few years.
-
Production at the Etame Marin is expected to increase significantly, and costs are about to go down with the new FPSO contract later this year. Furthermore, EGY could build a desulfuration station and increase oil production significantly or at least by about 2,000-2,500 Bopd.
-
EGY has more mineral reserves and better potential to increase it quickly without a huge CapEx. The Equatorial Guinea prospect is not considered a valuable asset in the deal. No mineral resources are indicated.
-
The debt issue is moot. EGY has no long-term debt, and TGA has only $3.14 million.
-
One crucial advantage painfully lacking in VAALCO Energy is that this merger provides diversification, which has been the main issue for VAALCO for many years, with only one producing asset in Gabon, West Africa. The combined company solves the assets concentration risk and diversifies the business model, including offshore and onshore expertise, but I wonder at what price?
Thus, it is difficult to see why VAALCO Energy owned less than 60% of the merger company? I think it was one of the reasons why EGY sold off when the news was announced. The stock price may drop even further if oil prices continue to decrease (Check my Technical analysis below).
Finally, in terms of synergies, I see only a minimal effect going forward due to the assets’ location and the company’s expertise. EGY is an offshore E&P producer, whereas TGA specializes in onshore assets.
Regarding stock appreciation, I believe EGY shareholders did not get a fair deal and should have claimed a more significant part of the Newco or combined company.
5 – Merger Timetable
EGY/TGA time table (EGY/TGA Presentation)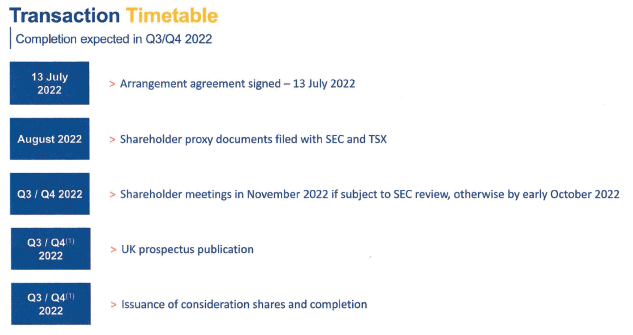
The merger will be completed before 4Q22 based on the deal indicated.
6 – Technical Analysis And Commentary
EGY TA Chart short-term (Fun Trading)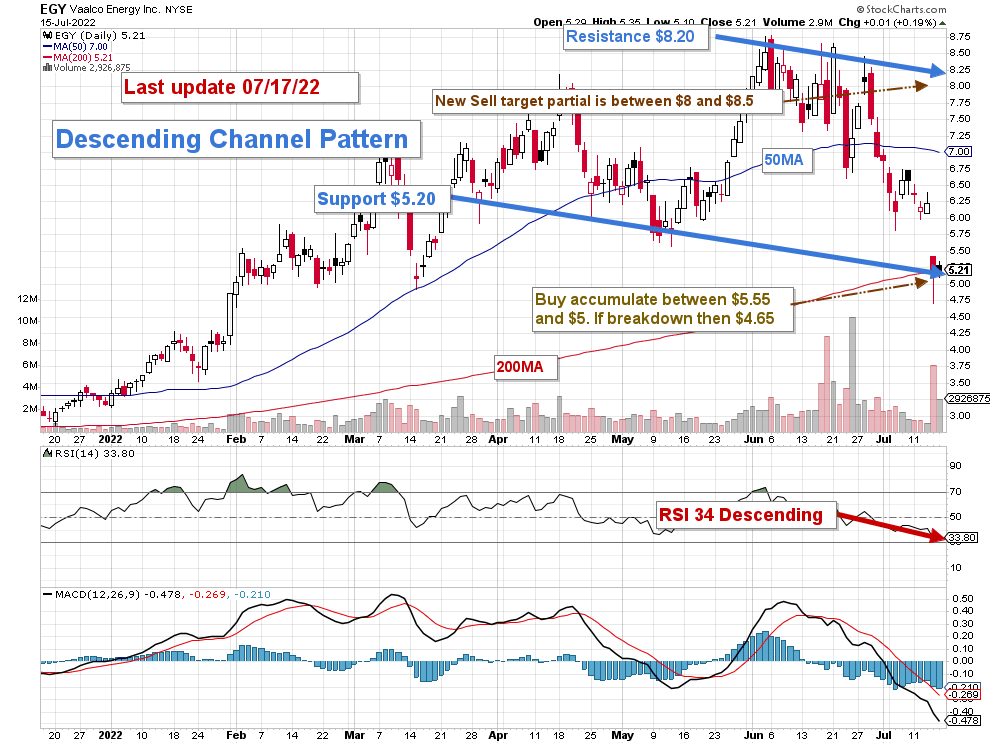
Note: The chart has been adjusted for dividends.
The channel formation can be of two types: bullish and bearish. Generally, a descending channel is a bearish trend reversal chart pattern. When the movement is downward, which is the case here, it is considered bearish. EGY forms a descending channel pattern with resistance at $8.20 and support at $5.20.
The short-term trading strategy is to trade LIFO about 55%-65% of your position. I have increased the short-term part because of the increasing volatility attached to the oil sector and the nature of the pattern.
I suggest selling at above $8 and waiting for a retracement below $5.20. In this case, I recommend starting to sell 25% at mid-support/resistance or around $7, which is the 50MA.
However, EGY could break down if oil prices lose momentum, which is a real possibility after the recent CPI numbers. EGY’s lower support is estimated at $4.25.
Watch oil prices like a hawk.
Note: The LIFO method is prohibited under International Financial Reporting Standards (IFRS), though it is permitted in the United States to Generally Accepted Accounting Principles (GAAP). Therefore, only US traders can apply this method. Those who cannot trade LIFO can use an alternative by setting two different accounts for the same stocks, one for the long term and one for short-term trading.
Warning: The TA chart must be updated frequently to be relevant. It is what I am doing in my stock tracker. The chart above has a possible validity of about a week. Remember, the TA chart is a tool only to help you adopt the right strategy. It is not a way to foresee the future. No one and nothing can.
Author’s note: If you find value in this article and would like to encourage such continued efforts, please click the “Like” button below as a vote of support. Thanks.

Join my “Gold and Oil Corner” today, and discuss ideas and strategies freely in my private chat room. Click here to subscribe now.
You will have access to 57+ stocks at your fingertips with my exclusive Fun Trading’s stock tracker. Do not be alone and enjoy an honest exchange with a veteran trader with more than thirty years of experience.
“It’s not only moving that creates new starting points. Sometimes all it takes is a subtle shift in perspective,” Kristin Armstrong.
Fun Trading has been writing since 2014, and you will have total access to his 1,988 articles and counting.
Be the first to comment