

quinntheislander/iStock via Getty Images
Drilling from the Top Down
In the process of generating a trade idea, one must refrain from looking at charts until all fundamental data has been analyzed and digested to “drill down” into specific sectors and a comprehensive equity universe has been derived from such analysis.
Starting out with (in our opinion) the main driver of equity directional investments and trades, the Manufacturing PMI we can arrive at the following view:
There has been a steady decline for over 6 months now, signaling a clear slowdown in the economic drivers of equity markets and a subsequent decline in the S&P500. Thus our overbearing view toward equities is Bearish.
Creating a World View:
TradingEconomics.com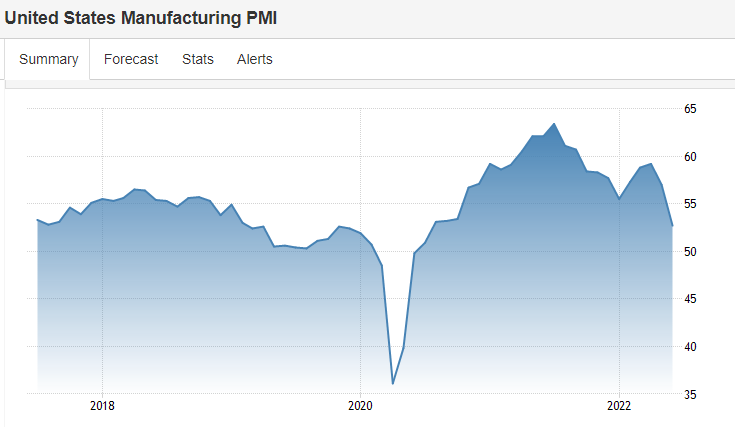
Even though the above conclusion is being made off a one-sample population of indicators, we can align this view and justify it with other points of reference laid out in previous reports published in our various social media avenues; supporting further that our medium-term view on equities is bearish.
Identifying Industry Breakouts:
Now that we have established a bearish view on equities for a trading timeframe, further analysis is called for to identify the industries upon which to create a sub-universe of equities to trade.
Apparel:
For the past 6 months, the Apparel industry has enjoyed the top-level expansion within the PMI report on business with positive overall commentary from the respondents section. However, for the month of June we see a different story from respondents and raw materials.
June ISM Manufacturing Report
This response clearly points to overall expectations of a decline in sales and orders along with an overstocked inventory in the industry, the first sign of a contraction in the last 6 months shining a light on an opportunity to express our bearish views on this sector.
Capacity Utilization:
A capacity utilization reading between 78-80% is at the upper end and calls for either higher production to increase capacity, or a forced slowdown of demand to let the industry catch its breath.
In the case of Apparel, we see a reading of 80.2% in the month of June calling for one of the two simplified solutions provided above. Judging from the slowdown in the consumer sector and all the negative leading indicators in the U.S. economy along with respondent expectations of a slowdown in sales; we conclude that the sector will see a slowdown in demand rather than an expansion in capacity.
Raw Material Drivers:
In the Apparel industry, Cotton prices are a clear comprehensive driver to margins and demand on part of businesses and consumers. Noting a (30%) decline in Cotton prices MoM from June to July we have a new data point to look at in generating a trade idea and subsequently honing down our stock universe within the sector:
The decline in Cotton prices can bring about a series of benefits and detriments to the industry operators, we have honed to look for:
– Detriment to businesses with slower inventory turnover holding overpriced inventory and not being quick enough to enjoy lower prices / higher margins.
– Benefit to higher gross margin businesses with quicker inventory turnover that can enjoy this raw material decline.
TradingEconomics.com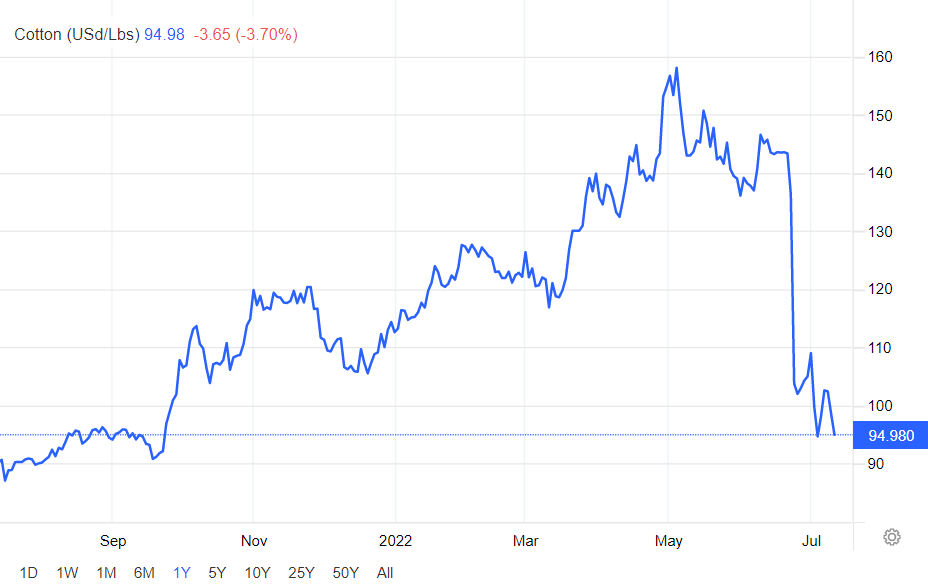
Apparel Stock Universe:
Having a bearish parameter on the Equity asset class, and a bearish parameter on the Apparel industry, along with fundamental parameters for quick/slow inventory turnover ratios and high/low gross margins to drive detriment/benefit from the contraction in cotton prices; we are ready to select a comprehensive portfolio of long and short Apparel stocks.
Based on the fundamental filtering, it is intuitive that larger capitalization stocks will enjoy quicker inventory turnover and higher margins due to economies of scale, while smaller capitalization stocks will see the anti-thesis to these benefits.
Further, an optimistic/pessimistic P/E multiple can be a clear indication of what participants are willing to pay for the quality of underlying future earnings following this developing environment and thesis.
Following these parameters and filters, it is comprehensive to hone into the following two businesses:
V.F. Corporation (NYSE:VFC) Long Bias
A large capitalization of $17Bn can provide hints into the above parameters that are desired.
Parameters:
– P/E 14.5x which stands higher than the industry average of 8x. This perceived higher multiple of earnings quality can be a supporting view of the Cotton price dynamics and participants leaning on the large cap quality allowing to benefit from such price changes.
– ROE 37% again standing above the industry average of 6%. This higher quality of business fundamentals can provide a further “bedrock” to attract investors looking to gain exposure to the sector.
– Gross Margins 54.50% standing above the industry average of 32.3%. This supports our parameter for enjoying sustained margins throughout the decline of Cotton Prices, increasing the bottom line as well.
– Net Margins 10.30% standing above the industry average of 3.1%. With the above Gross Margins being sustained and improved through Cotton Price declines, we can expect this superior Net Margin to increase EPS at the end of the quarter. Keeping an above industry P/E multiple can be a main driver and catalyst for profiting off the long position.
– Inventory Turnover 3.8-4.2x standing above the industry average of 2.4x. This again supports our parameter of being able to retain the benefits of lower cotton prices in new inventory and not holding overpriced inventory from previous months, a driver to higher margins and earnings.
Delta Apparel (DLA) Short Bias
A small-capitalization of $175m can provide hints into the above parameters that are desired.
Parameters:
– P/E 6.3x below the industry average of 8x. This supports a pessimistic view of the underlying earnings which can stem from the above thesis for margins and inventory.
– ROE 17.5% above the industry average of 6%. A positive against the industry, however still below our long counterpart in $VFC.
– Gross Margins 23.9% below the industry average of 32.3%. A below-average gross margin will likely be sustained in declining Cotton prices, subsequently decreasing the bottom line.
– Net Margins 6.11% above an industry average of 3.1%. A positive against the industry, however still below our long counterpart in $VFC.
– Inventory Turnover 1.8-2.2x standing below the industry average of 2.4x. This supports our parameters of not being able to change inventory quick enough to enjoy the lower Cotton Prices and hold overpriced inventory from previous months. This along with lower Gross and Net Margins will significantly lower EPS, with the stock already carrying a compressed P/E multiple, this can be a catalyst from profiting in a short.
Structuring the Trade
Having set a universe for long and short equity within our desired industry, a quantitative structure of the subsequent trade is necessary to “time” our entries and exit into the spread trade.
The above chart represents the spread ($VFC price minus $DLA price) for the past 5 years. The Median value in Black of $46.50 is our mean-reverting price target for this time series. First Standard Deviations in Green and Second Standard Deviations in Red. A negative Second Standard Deviation opens the question to mean reversion in order to “long this spread” or in other words Long $VFC and Short $DLA.
A P-value of 93% provides a high confidence interval of regression to the mean within the spread. This Cointegrating or Reversing behavior allows us to expect a profit from “longing” this spread.
A hedge ratio of 0.27 represents the optimal positioning in order to remain as neutral as possible. This ratio specifically recommends shorting ~3 $DLA for every 1 long in $VFC.
Mean Reversion & Hedge Ratio:
Expectations
Assuming a position totaling $2,000 in budget, a trader would be allowed to long 14 $VFC and short 52 $DLA for a total position of $2,077.
This spread holds a “target profit” at the median value of $46.50 of 157% from a theoretic current entry at $17.20. A “Max Profit” is derived from the possibility of exiting at the +1 Standard Deviation level of $57.25, lastly our “Max Risk” is a function of the annualized Standard Deviation of the spread series along with internal risk tolerance.
This would make a theoretical profit of $3,266 and a theoretical risk of loss of ($409.88) by taking on this view.
Is the Position Hedged vs Cotton Prices?
Taking a view of the delayed reaction in equity prices from the 30% decline in Cotton Prices, traders would benefit from understanding the historical behavior of our equity spread position in face of Cotton Price action:
The above study demonstrates a 5-year negative correlation of (60%) between the equity spread values and Cotton prices. It would follow logic then, that the decline – and continued decline – in Cotton prices would statistically represent another driver for profiting from “longing” the equity spread and hedging the business risk of such a decline in prices.
Be the first to comment