

USD/ZAR ANALYSIS
- ZAR gains interrupted by ratings warning
- Manufacturing PMI data in focus later today
- Potential for rectangle breakout on weekly
RAND FUNDAMENTAL BACKDROP
The Rand opened up stronger this week after optimism around the U.S. stimulus package prompted the repetitive and familiar shift to ‘risk-on’. Coupled with lesser restrictions on local lockdown measures, and a relaxed U.S. bond market aided the positive start for the ZAR.
President Cyril Ramaphosa addressed the nation over the weekend highlighting relaxed COVID-19 lockdown measures which should allow for increased stimuli regarding economic growth.
Emerging Market (EM) currencies across the globe have largely clawed back some of the lost gains witnessed last week but the South African Rand soon gave in to ratings agencies counsel.
This being said, South Africa has revised its budget deficit figure to an improved 14% of GDP, ratings agencies remained cautious around the future. They warned that rising government debt will likely endure with many other contributing factors garnering downside risk (SOE’s, upcoming elections etc.). With similar ‘watchful’ statements from ratings agencies, the Rand is currently 0.10% up on the day.
CURRENT SOUTH AFRICAN ISSUER RATINGS
Chart prepared by Warren Venketas, Refinitiv
ECONOMIC ANNOUNCEMENTS
U.S. Manufacturing PMI data will be in focus later today (see economic calendar below) which is likely to provide some short-term volatility for USD crosses. Should estimates vary significantly from forecasted figures, large price fluctuations may ensue. It should be noted that both Markit and ISM forecasts are above 50 which is indicative of an expanding economy.

Source: DailyFX economic calendar

Recommended by Warren Venketas
Trading Forex News: The Strategy
TECHNICAL ANALYSIS
USD/ZAR WEEKLY CHART
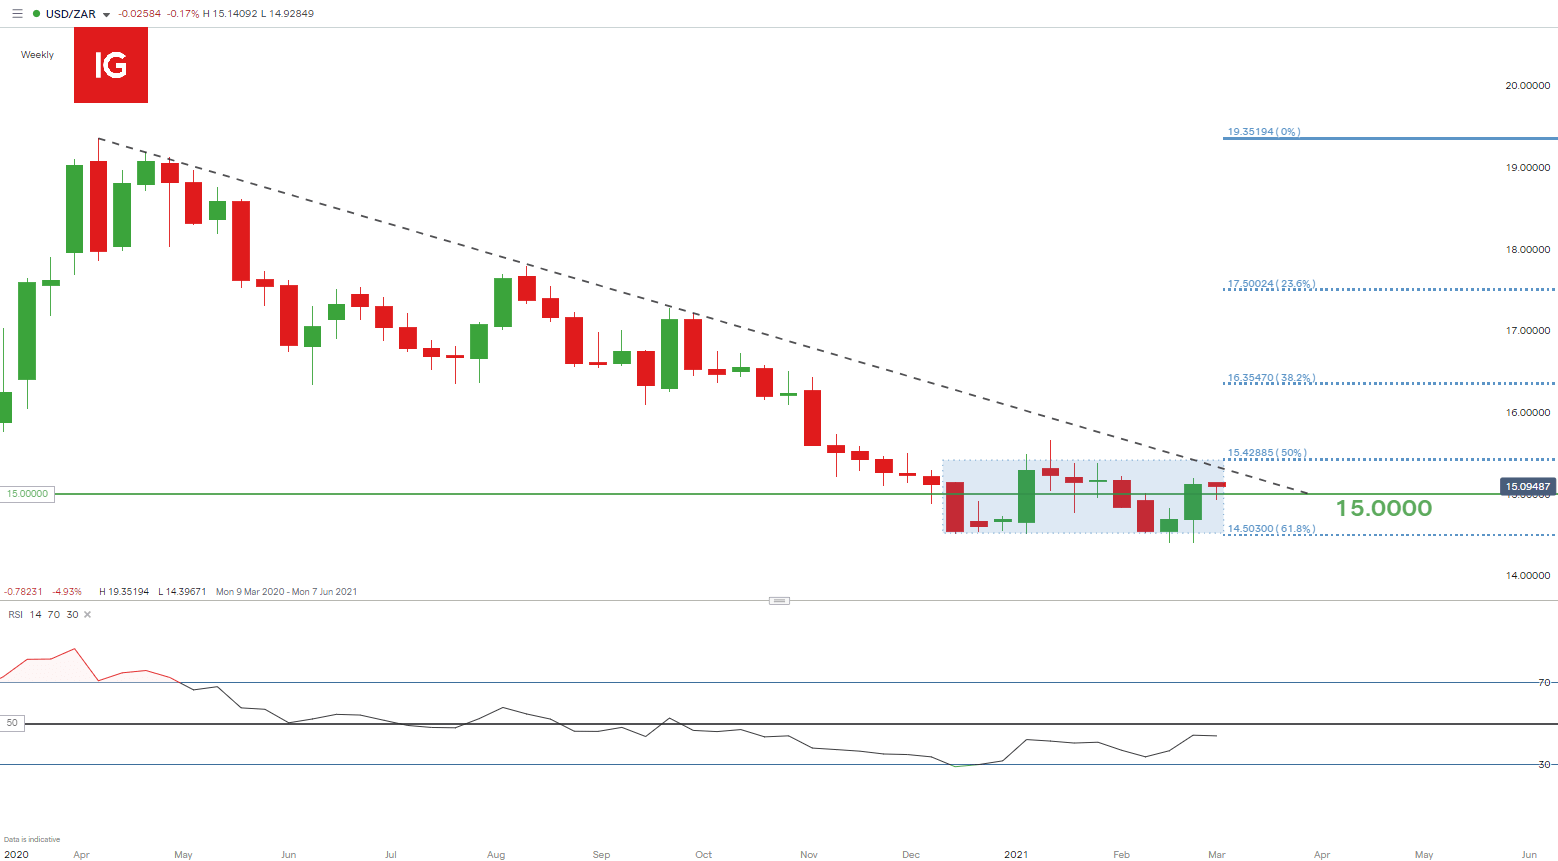
Chart prepared by Warren Venketas, IG
The weekly USD/ZAR chart above continues to trade within the 14.5030 (61.8%) and 15.4288 (50%) Fibonacci support and resistance zones respectively – Fibonacci retracement taken from 2018 low to 2020 high.
Discover the basic building blocks of Fibonacci and how it can be applied in Financial markets!
This zone restriction has created a rectangle pattern (blue) that suggests an impending breakout. Because the preceding trend is to the downside, this could lead to a bearish breakout should prices break below support (14.5030).
Trendline resistance (dashed black line) has held since April 2020 highs which allows for further upside before this key area of confluence is tested. A break above this could coincide with a topside breakout of the rectangle formation which may lead to a bullish break and trend reversal.
The Relative Strength Index (RSI) remains toward the bearish bias as it sits below the mid-point (50) however, a recent upward swing indicates a slowing in bearish momentum.
Starts in:
Live now:
Mar 02
( 18:03 GMT )

Keep up to date with price action setups!
Trading Price Action
USD/ZAR: KEY TECHNICAL POINTS TO CONSIDER
- Rectangle pattern
- Long-term trendline resistance
- RSI bearish momentum slowing
— Written by Warren Venketas for DailyFX.com
Contact and follow Warren on Twitter: @WVenketas
Be the first to comment