

USD/ZAR Latest:
- USD/ZAR lower after being rejected by 18.500.
- US Dollar weakness supports emerging market currencies.
- South African Rand resilient after the release of the medium-term budget.
Recommended by Tammy Da Costa
Get Your Free Top Trading Opportunities Forecast
The South African economy seems to be facing insurmountable challenges as electricity woes continue. With the emerging market suffering from persistent rolling blackouts (loadshedding) since 2008, the ongoing power cuts have posed a major threat to the commodity rich economy.
While both structural and political factors remain a hinderance for the developing nation, lower growth forecasts and an increase in government spending could be exacerbated by further USD strength.
After admitting that South Africa has underperformed against its counterparts, South African finance minister Enoch Godongwa presented his second medium-term budget speech to address these concerns.
The highlights of the speech include:
- Government expected to take over a ‘significant portion’ of Eskom’s R400Bn debt
- Special Covid-19 grants to be extended until 31 March 2024
- Government spending is expected to rise by 4% over the next two-years
- Treasury allocating 13BN in spending adjustments in the Adjustments Appropriation Bill
- R2.9Bn to be allocated to Transnet in 2022/23 to restore locomotives
- Additional funds will be allocated to strengthening audit and preventative systems to fight corruption
Recommended by Tammy Da Costa
Introduction to Forex News Trading
USD/ZAR Technical Analysis
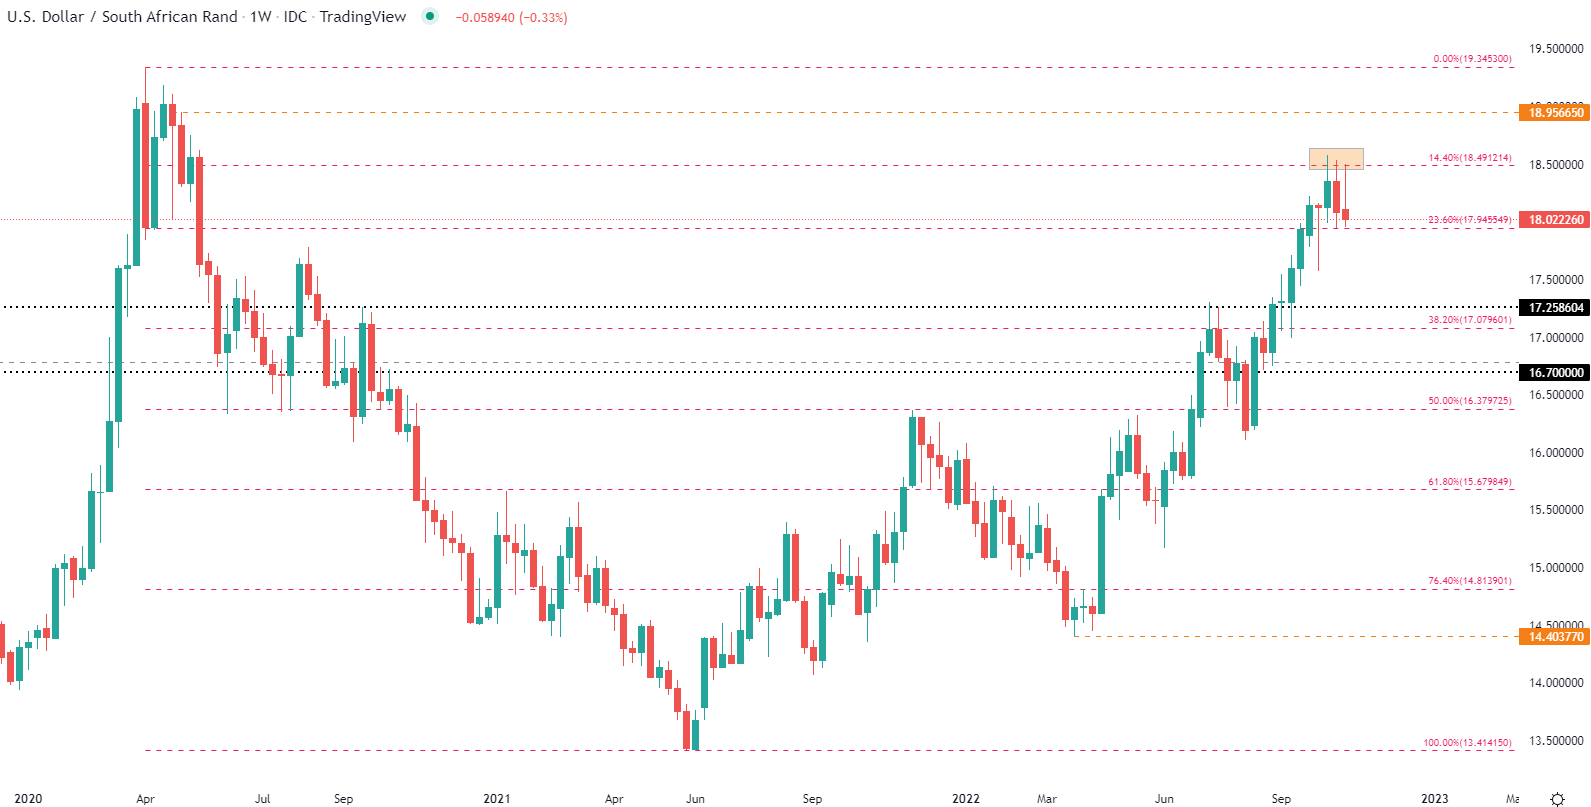
After four months of consecutive gains, USD/ZAR ran into a barrier of resistance just above 18.500. With risk-aversion still favoring the safe-haven Dollar, a pause in the uptrend and a slightly weaker greenback has driven price action back towards 18.00.
Following three weeks of invalidation at psychological resistance, the 14.4% Fibonacci retracement of the 2020 – 2021 move has assisted in limiting bullish momentum at a level of around 18.491.
USD/ZAR Weekly Chart
Chart prepared by Tammy Da Costa using TradingView
On the daily chart, the zone between 18.00 and 18.2219 remains critical while a break in either direction could fuel the short-term move.
USD/ZAR Daily Chart
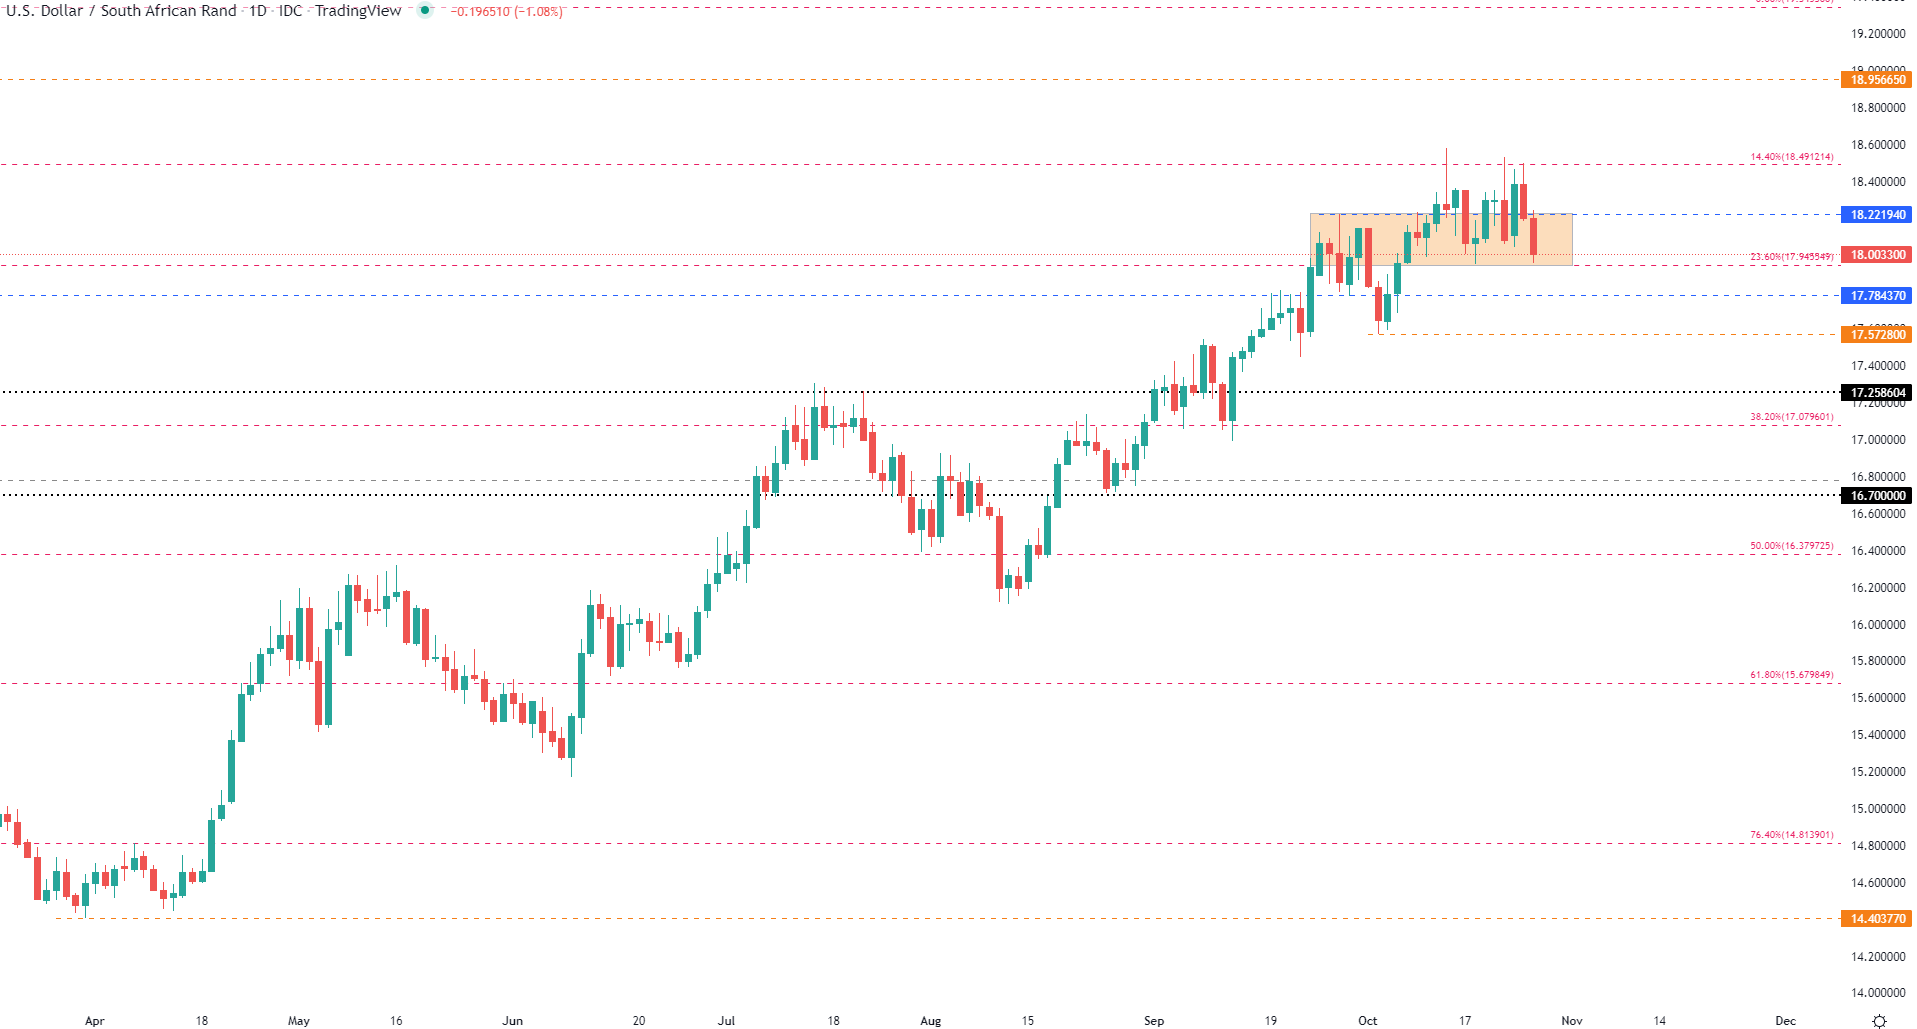
Chart prepared by Tammy Da Costa using TradingView
USD/ZAR Support Levels:
- S1: 17.945 (23.6% Fibonacci retracement of the 2020 – 21 move)
- S2: 17.784 (August 2020 high)
- S3: 17.572 (Monthly low)
USD/ZAR Resistance Levels:
- R1: 18.2219 (September high)
- R2: 18.500 (Psychological level)
- R3: 18.579 (Monthly high)
— Written by Tammy Da Costa, Analyst for DailyFX.com
Contact and follow Tammy on Twitter: @Tams707
Be the first to comment