

USD/ZAR Latest:
- EM (emerging market) currencies pullback as USD weakness subsides
- USD/ZAR recover after rebounding from 17.70
- Thursday’s US inflation data now at the forefront of risk sentiment
Recommended by Tammy Da Costa
Get Your Free USD Forecast
US mid-term elections are currently underway as voters of the United States head to the polls. As elevated inflation and ballooned balanced sheets remain a key concern for the Federal Reserve, EM (emerging market) currencies are at the mercy of US Dollar Strength.
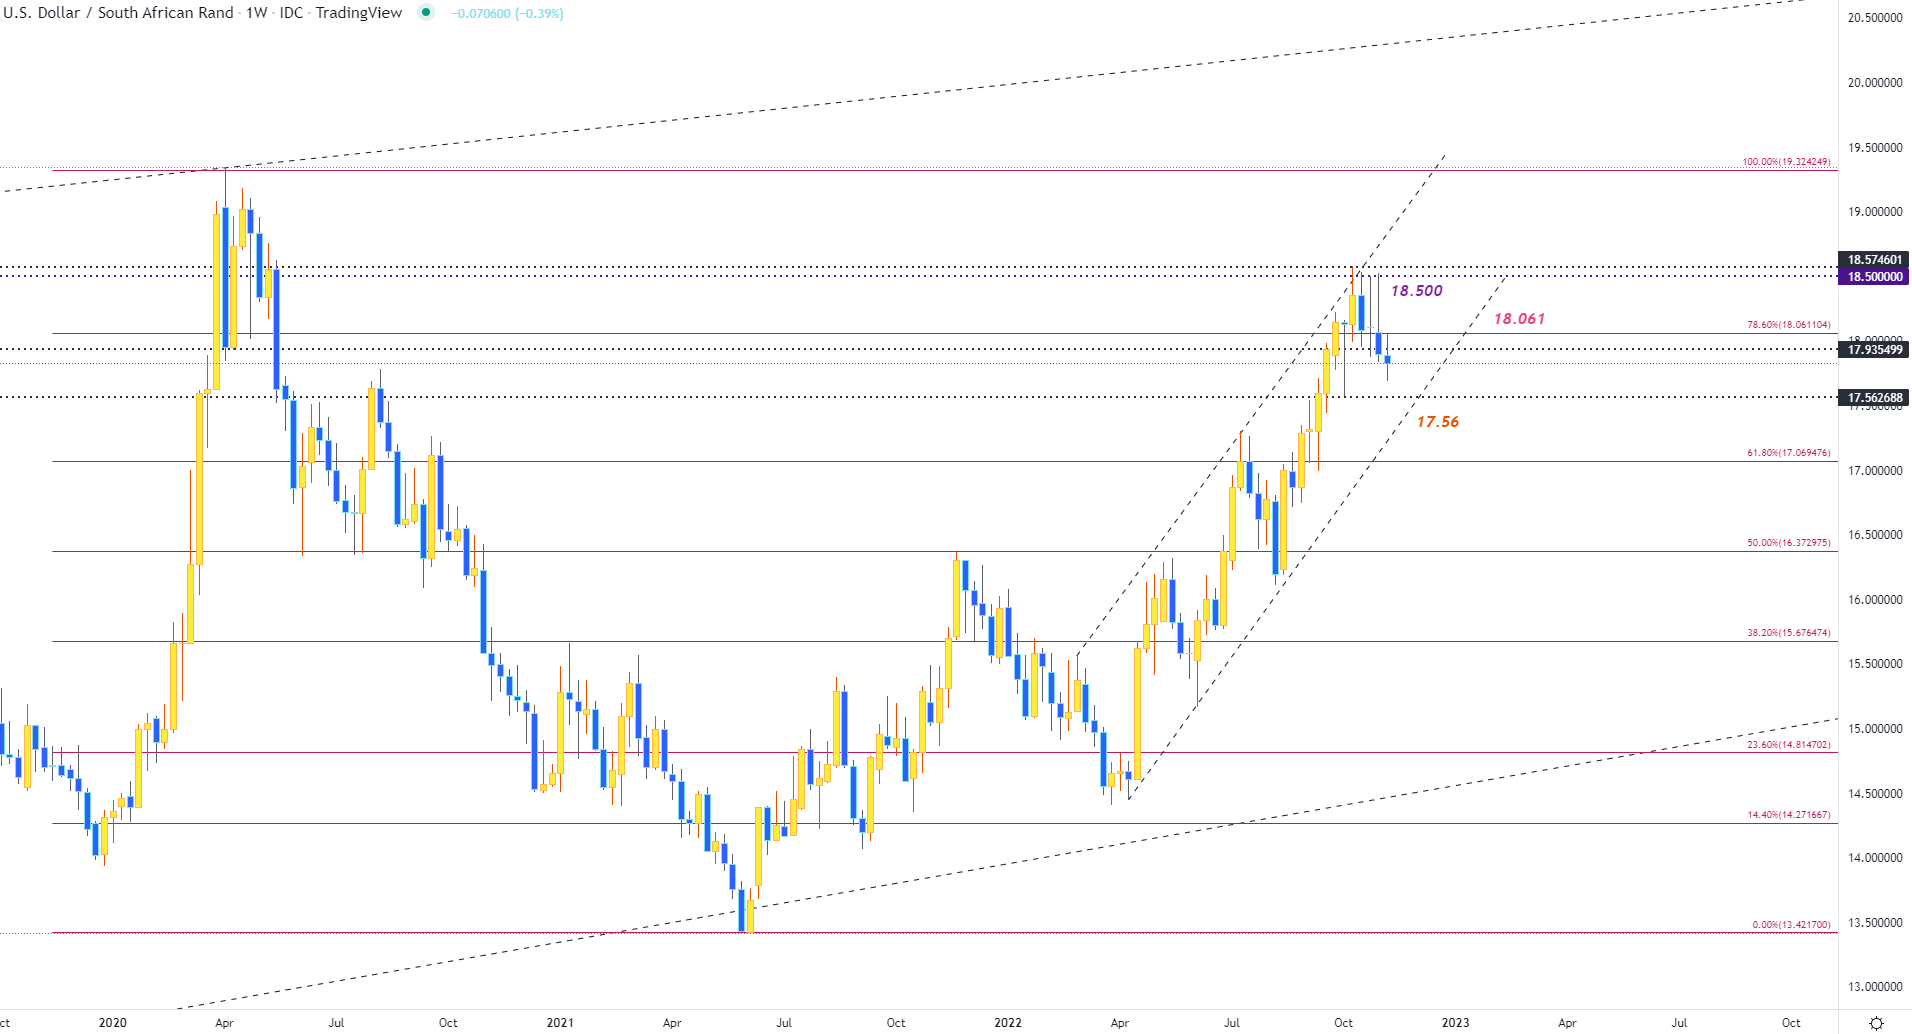
After rising to a high of 18.579 in October, a rejection of rising channel resistance drove USD/ZAR into a tight range. With the zone between 17.80 and 18.00 providing support throughout last month, the 18.500 psychological level has proven to be a major hurdle for bulls.
USD/ZAR Weekly Chart
Chart prepared by Tammy Da Costa using TradingView
Recommended by Tammy Da Costa
Forex for Beginners
Over the past four weeks, the 18.50 – 18.58 range has restricted the upside move, creating a firm barrier of resistance for USDZAR. While the above-mentioned support and resistance levels have remained an additional catalyst for price action, a weaker greenback, and a break of 17.80 drove the pair to a level last tested on October 5th at around 17.687.
USD/ZAR Daily Chart
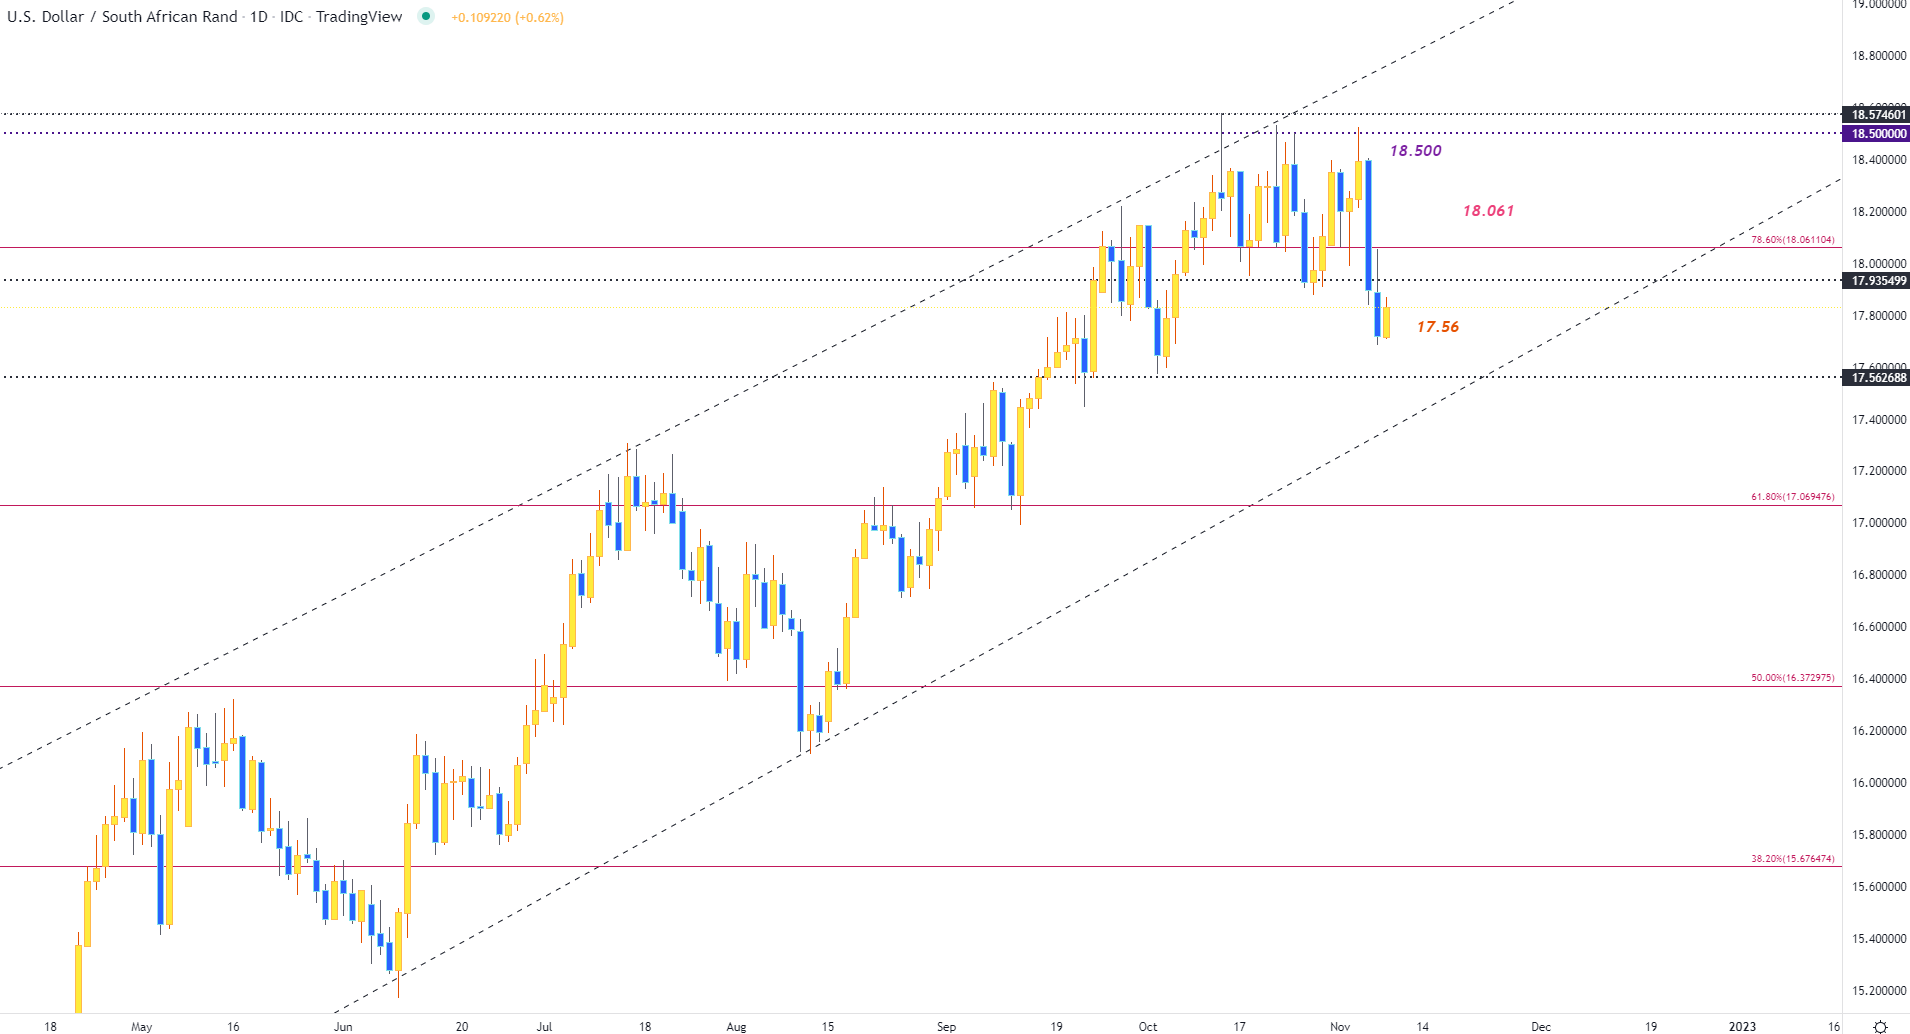
Chart prepared by Tammy Da Costa using TradingView
With Fibonacci levels of the 2020 – 2021 move still intact, a hold above the 78.6% Fib at 18.0611 and above 18.30 may allow for bullish continuation back towards 18.50. For the downside to gain traction, a break below 17.56 is necessary.
Trade Smarter – Sign up for the DailyFX Newsletter
Receive timely and compelling market commentary from the DailyFX team
Subscribe to Newsletter
— Written by Tammy Da Costa, Analyst for DailyFX.com
Contact and follow Tammy on Twitter: @Tams707
Be the first to comment