

US Dollar Recovery Approaching Make-or-Break Resistance Hurdles into 2Q
DXY Weekly Price Chart
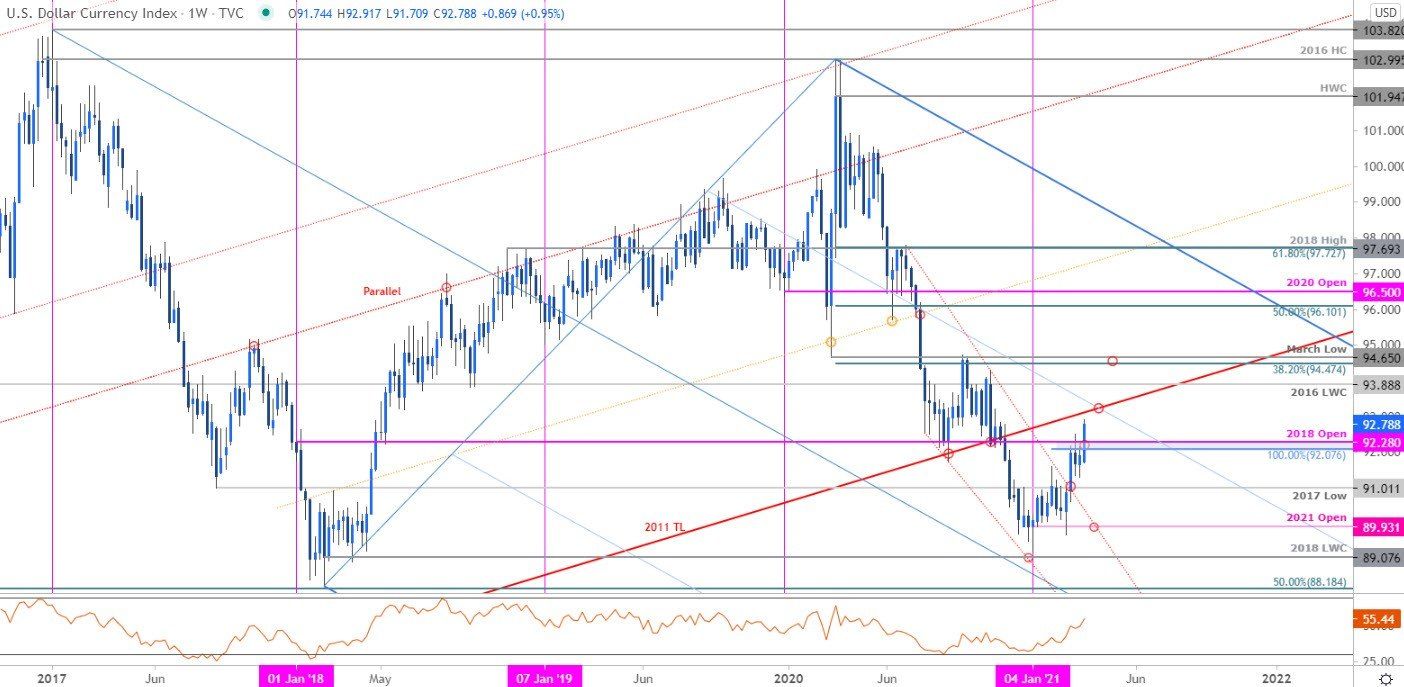
Chart prepared by Michael Boutros, created with TradingView
Into the start of 2021, a top focus was on the US Dollar breakdown after DXY broke below a multi-year support trendline extending off the 2011 low. Our ‘bottom line’ noted that, “the risk is weighted to the downside heading into the start of the year, but we’ll be on the lookout for a possible low in the second / third quarter closer to slope support.” The decline accelerated into the close of the year with the index plummeting another 2.7% before turning just ahead of the 2018 low-week close at 89.07 (low resisted at 89.20) in early January.
The low was much earlier than anticipated, but nonetheless registered at a technically significant level; and the focus heading into Q2 is on this immediate recovery. Initial resistance stands at the highlighted trendline confluence near ~93.25 – be on the lookout for possible inflection there with a breach / close above needed to keep the long-bias viable towards the 2016 low-week close at 93.88 and the 38.2% Fibonacci retracement / 2020 March low at 94.47/65 (an area of interest for possible topside exhaustion IF reached). Support rests with the 2017 swing low at 91.01 with broader bullish invalidation now set to the objective 2021 yearly open at 89.93. Bottom line: looking for topside exhaustion early in the quarter to give way to larger pullback- losses should be limited by 91 IF price is indeed heading higher.

Recommended by Michael Boutros
Get Your Free Top Trading Opportunities Forecast
Be the first to comment