

US Dollar vs. Mexican Peso (USD/MXN) Price, Analysis and Chart:
- Mexican Peso boosted by oil and risk sentiment.
- USD/MXN price range tightens towards a potential breakout.

Recommended by Nick Cawley
Find Out the #1 Mistake Traders Make
USD/MXN Finds Support From Oil and Sentiment For Now
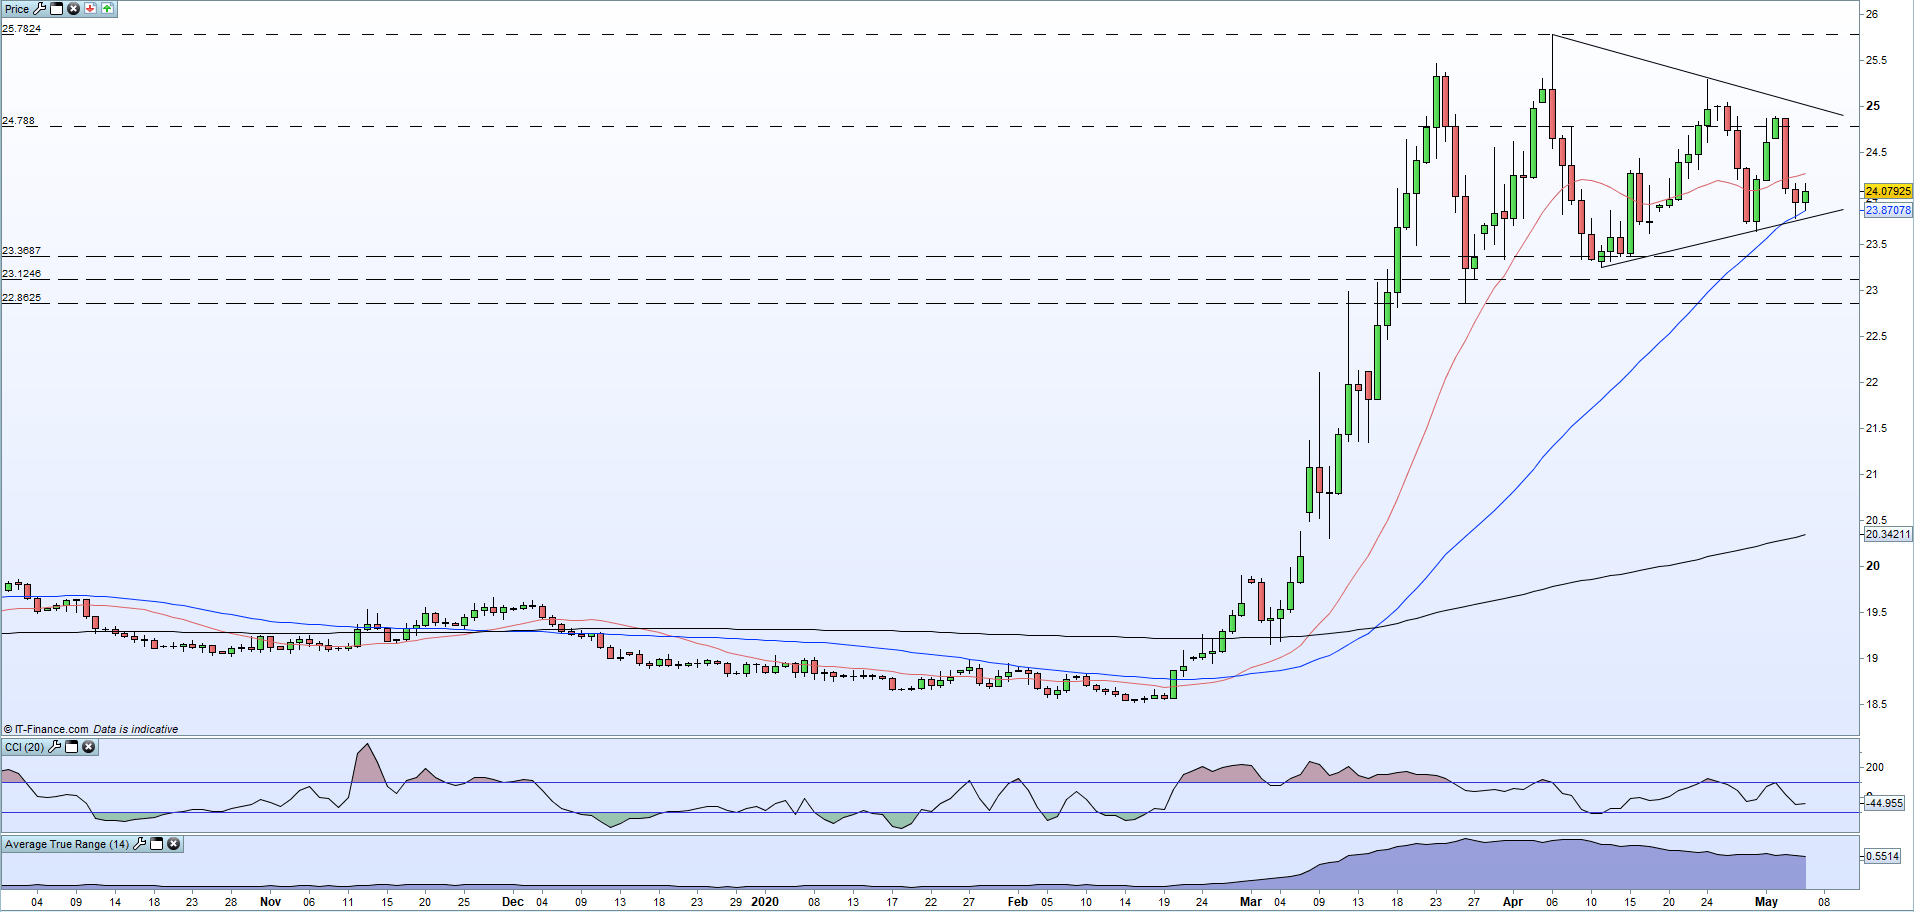
After trading at a multi-decade high of 25.78 one month ago, USD/MXN has gyrated lower over the month and currently trades one-and-three-quarter big figures lower around 24.06. This move has been predicated by the recent wild swings in the price of oil, currently pressing higher, and the frequent change in risk sentiment, currently MXN positive. The mid-April downgrade of Mexico to Baa1 from A3 by Moody’s left the country still in investment grade territory, while the downgrade of Pemex to Ba2 from Baa3 by the same ratings agency, saw the state-owned petroleum company fall into junk territory. While this weakened the Mexican Peso in the short-term, this loss was subsequently reversed, indicating that positive sentiment was returning.
The daily chart USD/MXN chart shows three lower highs and higher lows made over the last month suggesting that both bulls and bears are looking to control the next break. These lows and highs have formed a basic monthly symmetrical triangle with a break of either the support or resistance trendline likely as the two lines continue to converge. USD/MXN is near the supportive trendline and is now trading below the 20-day moving average, while the 50dma has provided support for the last two days. If this price action continues, a break is likely to be seen soon with the supportive trendline under the more immediate pressure. If support holds, and the 20-dma is closed above, a series of recent highs around 24.90 should cap further upside before the downtrend is threatened.
If you are interested in technical analysis, see our new and comprehensive Education Centre for a range of indicators and analytical articles. They are free and constantly updated.
USD/MXN Daily Price Chart (October 2019 – May 6, 2020)

Recommended by Nick Cawley
How are Retail Traders Positioned at the Moment?
Traders may be interested in two of our trading guides – Traits of Successful Traders and Top Trading Lessons – while technical analysts are likely to be interested in our latest Elliott Wave Guide.
What is your view on USD/MXN – bullish or bearish?? You can let us know via the form at the end of this piece or you can contact the author via Twitter @nickcawley1.
Be the first to comment