

USD/JPY Price and Chart Analysis
Recommended by Nick Cawley
Get Your Free JPY Forecast
The US dollar fell sharply Thursday after the latest inflation report beat market expectations and showed price pressures abating. Annual US inflation fell to 7.7% from a prior month’s 8.2%, stoking expectations that the Federal Reserve will slow the pace, and reduce the size, of further rate hikes. Fed chair Powell has already said that the central bank would slow rate hikes at some point, although he also added that rates may need to be at a restrictive level for some time. Yesterday’s inflation print will give Powell some wiggle room ahead of the December FOMC meeting. Heading into Thursday’s release the market was pricing around a 50/50 chance for either a 50bp or a 75bp rate increase. Currently, the market is pricing an 83% probability of a 50bp hike and a 17% chance of a 75bp increase.
US Inflation Falls to 7.7% from 8.2%. What’s Ahead for the Fed and the US Dollar
Trade Smarter – Sign up for the DailyFX Newsletter
Receive timely and compelling market commentary from the DailyFX team
Subscribe to Newsletter
Yesterday’s sharp turnaround in the dollar sent a wide range of risk markets sharply higher and saw the greenback sold off heavily in the market. The Nasdaq recorded a 7%+ gain, gold jumped through resistance and hit $1,760/oz+, while EUR/USD jumped from 0.9980 to around 1.0230 with sub-parity pricing now looking like a thing of the past. US Treasury yields fell sharply with the rate-sensitive 2-year down over 25 basis points on the session.
US 2-Year Price Chart – November 11, 2022
Thursday’s change in US rate expectations sent USD/JPY tumbling with the pair within a few pips of testing 140, a level last seen in late September. The combination of a strong dollar and a weak Yen has seen the pair rally by 40 big figures since late September last year. The Bank of Japan which has been sitting on the sidelines watching the move for most of this time, apart from a couple of recent interventions, will be happy to see USD/JPY fall. The immediate target is 139.40 to 140.00, while any move higher will likely struggle to find any traction.
Bank of Japan (BoJ) – Foreign Exchange Market Intervention
For all market-moving economic data and events, see the DailyFX Economic Calendar.
USD/JPY Daily Price Chart – November 11, 2022
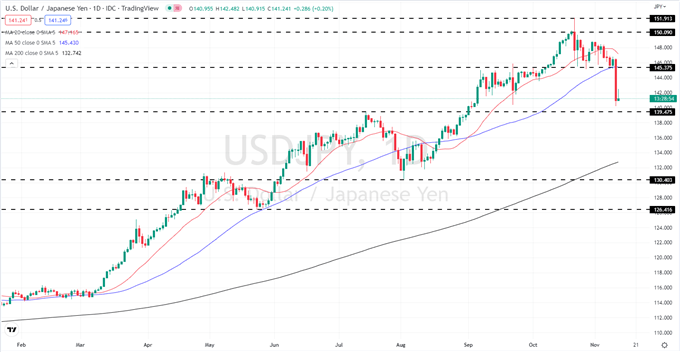
Charts created with TradingView
Retail Traders Cut Net-Shorts
Retail trader data show 43.57% of traders are net-long with the ratio of traders short to long at 1.29 to 1. The number of traders net-long is 5.50% higher than yesterday and 13.46% higher from last week, while the number of traders net-short is 24.74% lower than yesterday and 30.43% lower from last week.
We typically take a contrarian view to crowd sentiment, and the fact traders are net-short suggests USD/JPY prices may continue to rise. Yet traders are less net-short than yesterday and compared with last week. Recent changes in sentiment warn that the current USD/JPY price trend may soon reverse lower despite the fact traders remain net-short.
| Change in | Longs | Shorts | OI |
| Daily | 6% | -22% | -12% |
| Weekly | 12% | -29% | -16% |
What is your view on the USD/JPY – bullish or bearish?? You can let us know via the form at the end of this piece or you can contact the author via Twitter @nickcawley1.
Be the first to comment