

USD/CAD Price Outlook:
- USD/CAD staged a meteoric rise higher this week as the US Dollar reigned supreme
- Recent price action has stalled around the pair’s 4-year high of 1.4694
Canadian Dollar Forecast: USD/CAD Stalls Near 2016 High, Will it Reverse?
USD/CAD exploded higher this week as traders sought the relative safety of the Greenback and a debilitating drop in crude oil looks to weigh on the Canadian economy. As a result, the pair quickly shot above the 1.45 level and neared the 2016 high of 1.4694 – taking out a plethora of technical and psychological levels in the process. Now, however, price action has slowed, and the pair has posted two long upper wicks slightly beneath resistance.
USD/CAD Price Chart: Daily Time Frame (January 2016 – March 2020)
While the fundamental landscape remains effectively unforecastable, price has begun to suggest the USD/CAD ascent is slowing, likely in part because of the significant level that rests overhead. So, while our ability to confidently forecast directional moves has been undermined, the risk-reward profile of the pair at this stage is becoming increasingly attractive for bearish opportunities. That being said, it is important to grasp the immense uncertainty and volatility within the market right now and to understand the threats it poses when trading.

Recommended by Peter Hanks
Forex for Beginners
With that in mind, we can begin to explore possible trading set ups for the days ahead. To be sure, USD/CAD could continue higher if liquidity concerns reignite, crude oil falls further or general risk aversion returns. However, Thursday’s close may suggest volatility is cooling somewhat, despite trading at record-setting levels. Therefore, USD/CAD weakness is far from inevitable, but the initial move that saw the pair rocket higher is losing momentum and a continuation above resistance at 1.4694 may become less likely as a consequence.
USD/CAD Price Chart: Daily Time Frame (January 2019 – March 2020)
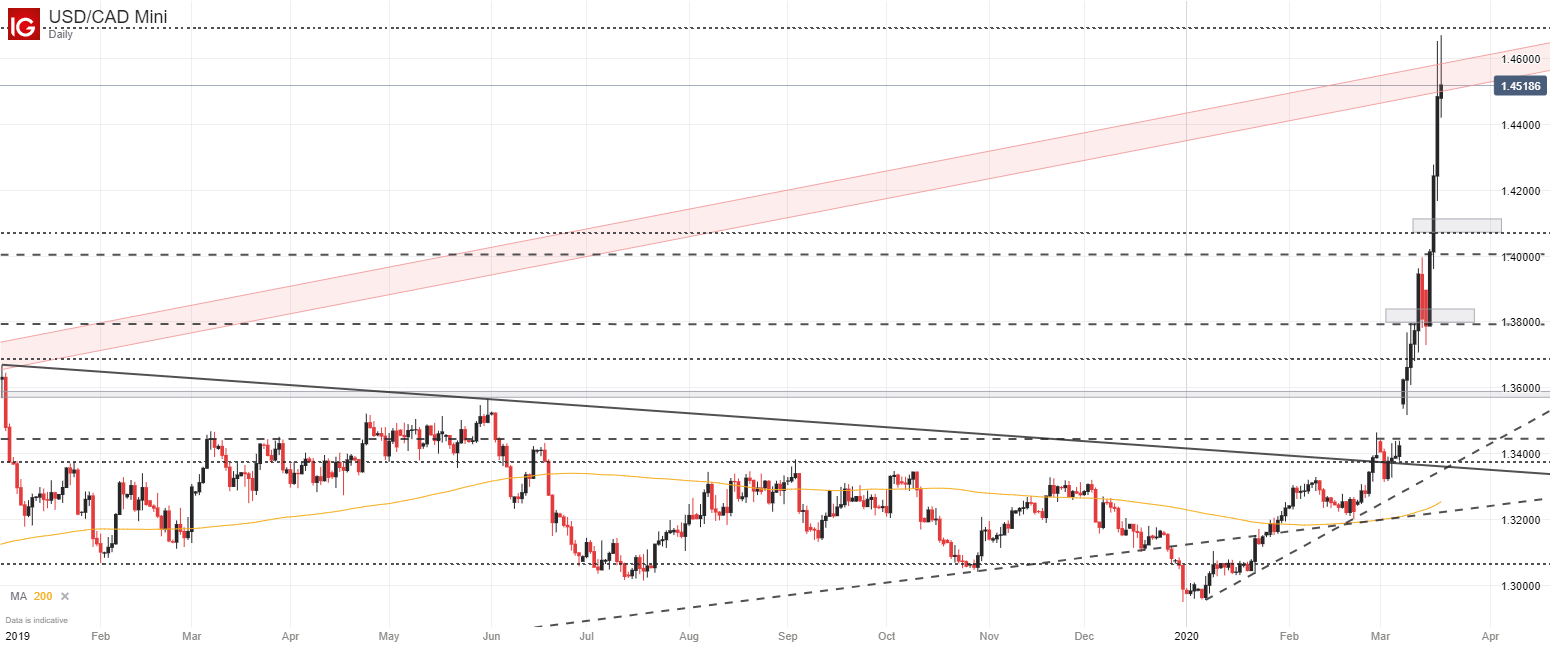
Hence, the area above 1.4694 can be looked to as an area of invalidation while looking for potential areas of interest beneath. Initial areas of support are hard to identify due to the gravity of the move, but possible assistance may reside around the Fibonacci level at 1.4134 and 1.40.

Recommended by Peter Hanks
Traits of Successful Traders
Lower still, minor buoyancy might be offered at the May 2017 high around 1.38. Either way, USD/CAD may look to consolidate in the days to come and the current landscape could offer an attractive risk-reward set up should more normal trading conditions return, and USD/CAD weakness materialize.
–Written by Peter Hanks, Junior Analyst for DailyFX.com
Contact and follow Peter on Twitter @PeterHanksFX
Be the first to comment