

Canadian Dollar Talking Points
The recent rebound in USD/CAD appears to be stalling ahead of the 50-Day SMA (1.2652) as the Bank of Canada (BoC) signals a looming shift in monetary policy, and the exchange rate may consolidate over the remainder of the month if former support now acts as resistance.
USD/CAD Rate Rebound Fizzles Ahead of 50-Day SMA on Less Dovish BoC
USD/CAD trades in a narrow range as it struggles to extend the series of higher highs and lows from earlier this week, and the advance from the monthly low (1.2365) may turn out to be a correction in the broader trend rather than a change inbehavior like the price action seen earlier this year.
The negative slope in the 50-Day (1.26525) and 200-Day (1.3044) SMA suggests the outlook for USD/CAD remains tilted to the downside as the Federal Reserve stays on track to “increase our holdings of Treasury securities by at least $80 billion per month and of agency mortgage-backed securities by at least $40 billion per month,” but it seems as though the BoC is preparing to shift gears as Deputy Governor Toni Gravelle reiterates that “as we continue to gain confidence in the strength of the recovery, we will gradually adjust the pace of our QE (quantitative easing) purchases.”
Deputy Governor Gravelle points out that “first-quarter growth appears to be better than we expected in January” while speaking at an event held by the CFA Society, with the official going onto say that “when we start gradually dialing back the amount of incremental QE stimulus that we are adding, we will eventually get down to a pace of QE purchases that maintains—but no longer increases—the amount of stimulus being provided.”
The comments suggest the BoC will slowly switch gears as Deputy Governor Gravelle insists that future adjustments to the QE program will be “gradual and in measured steps,” and it remains to be seen if Governor Tiff Macklem and Co. will alter the forward guidance at its next interest rate decision on April 21 as the central bank is slated to deliver the quarterly Monetary Policy Report (MPR).
Until then, key market trends may remain in place as USD/CAD as the US Dollar still reflects an inverse relationship with investor confidence, and the tilt in retail sentiment also looks poised to persist as traders have been net-long the pair since May 2020.
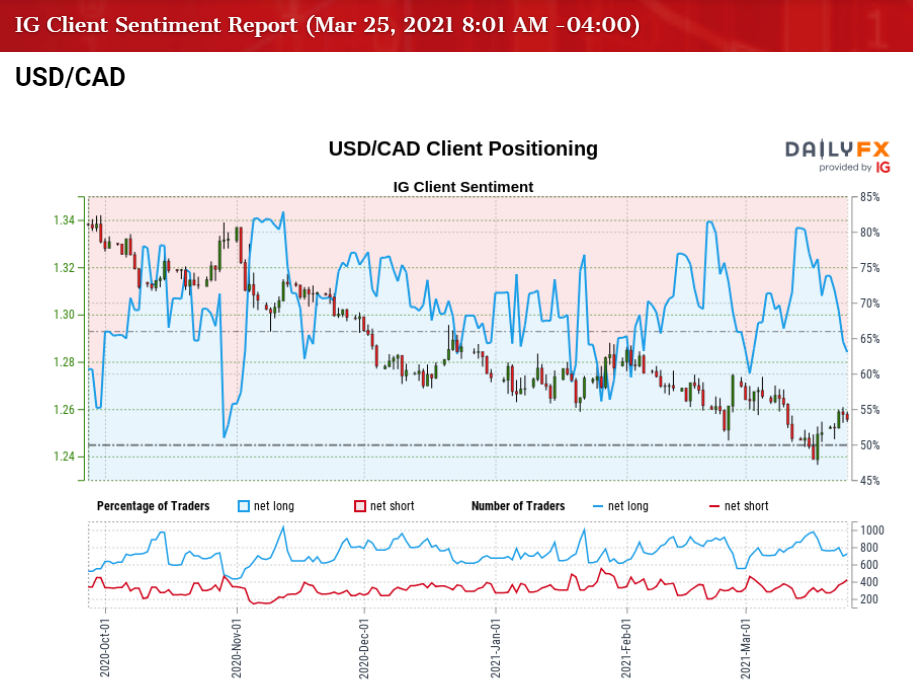
The IG Client Sentiment report shows 59.70% of traders are currently net-long USD/CAD, with the ratio of traders long to short standing at 1.48 to 1.
The number of traders net-long is 2.13% higher than yesterday and 22.58% lower from last week, while the number of traders net-short is 19.70% higher than yesterday and 67.01% higher from last week. The decline in net-long position comes as USD/CAD struggles to extend the series of higher highs and lows from earlier this week, while the jump in net-short position has alleviated the crowing behavior as 76.17% of traders were net-long the pair last week.
With that said, the advance from the monthly low (1.2365) may turn out to be a correction in the broader trend rather than a change in behavior as USD/CAD appears to be reversing course ahead of the 50-Day SMA (1.2652), and the exchange rate may consolidate over the remainder of the month if former support now acts as resistance.

Recommended by David Song
Learn More About the IG Client Sentiment Report
USD/CAD Rate Daily Chart
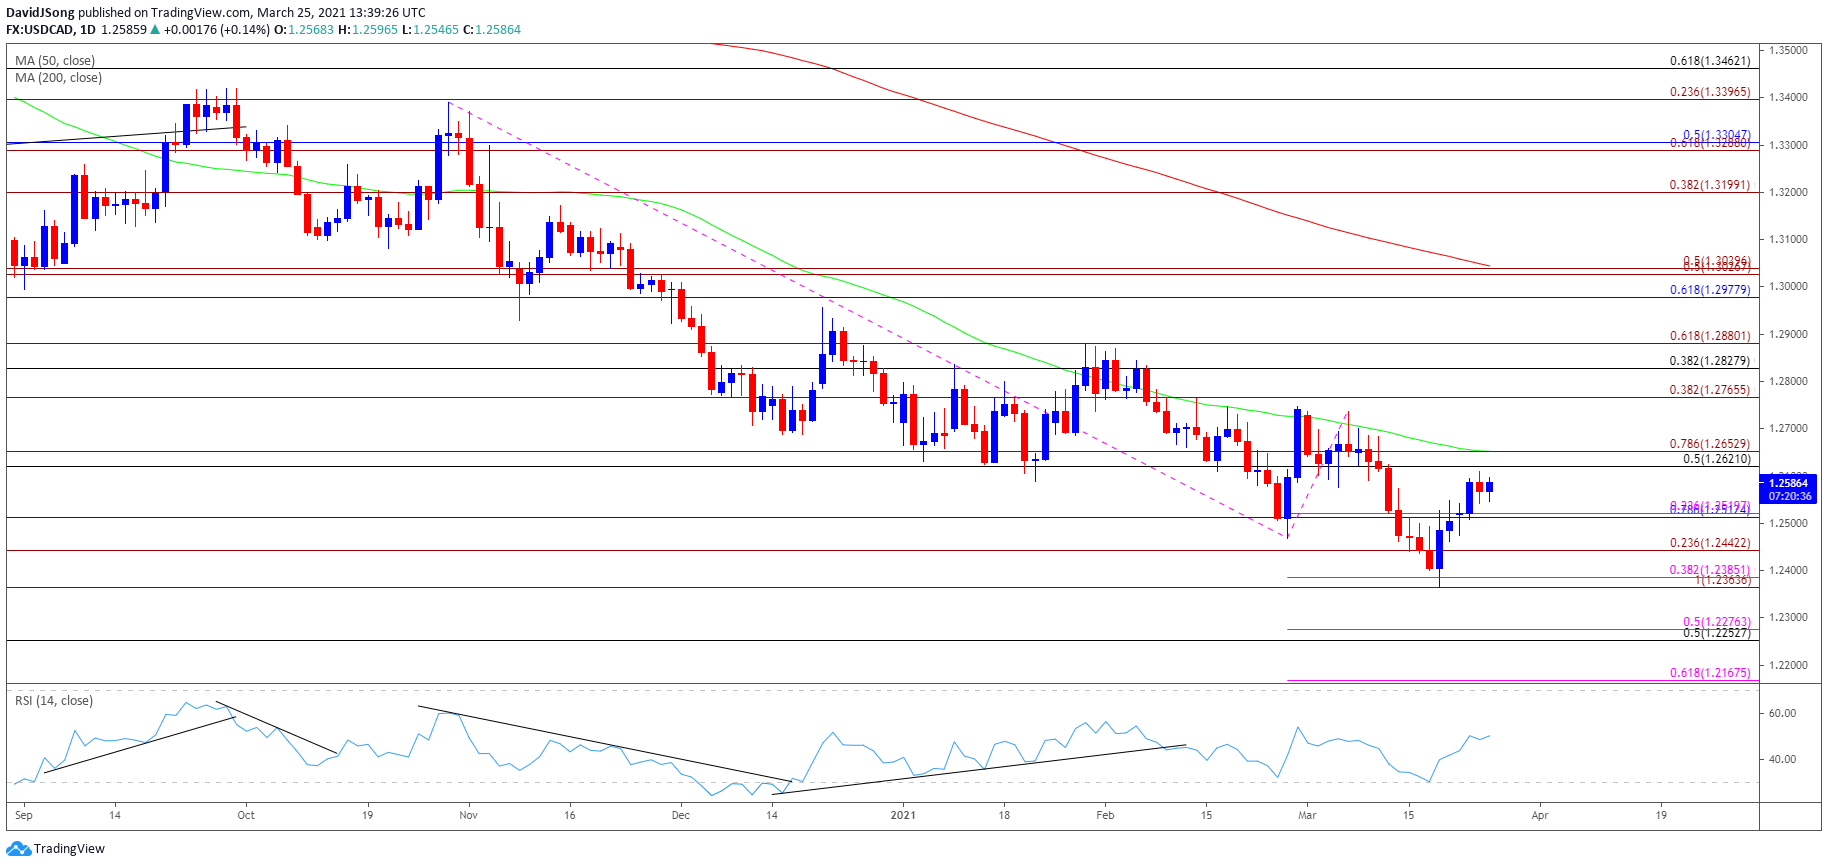
Source: Trading View
- Keep in mind, USD/CAD cleared the January 2020 low (1.2957) following the US election, with the exchange rate trading to fresh yearly lows in November and December as the Relative Strength Index (RSI) established a downward trend during the same period.
- USD/CAD started off 2021 by taking out last year’s low (1.2688) even though the RSI broke out of the bearish formation, with lack of momentum to hold above the 1.2770 (38.2% expansion) region pushing the exchange rate briefly below the Fibonacci overlap around 1.2620 (50% retracement) to 1.2650 (78.6% expansion).
- A break/close below the Fibonacci overlap around 1.2620 (50% retracement) to 1.2650 (78.6% expansion) materialized in February, which pushed USD/CAD to fresh yearly lows, with a similar scenario taking shape in March following the break/close below the 1.2510 (78.6% retracement) region.
- Lack of momentum to break/close below the 1.2360 (100% expansion) to 1.2390 (38.2% expansion) area has pushed USD/CAD back towards the former support zone around 1.2620 (50% retracement) to 1.2650 (78.6% expansion), which largely lines up with the 50-Day SMA (1.2652), but the rebound from the monthly low (1.2365) may end up being short lived if the former support zone now acts as resistance.
- Need a move back below the Fibonacci overlap around 1.2250 (50% retracement) to 1.2280 (50% expansion) to bring the 1.2440 (23.6% expansion) region on the radar, with the next area of interest coming in around 1.2360 (100% expansion) to 1.2390 (38.2% expansion), which lines up with the monthly low (1.2365).

Recommended by David Song
Traits of Successful Traders
— Written by David Song, Currency Strategist
Follow me on Twitter at @DavidJSong
Be the first to comment