

CANADIAN DOLLAR KEY POINTS:
- Canada’s inflation data will grab the spotlight on Wednesday
- June’s consumer price index is seen rising 0.9% on a seasonally adjusted basis. The monthly reading is expected to lift the annual rate to 8.4%, the highest level since 1982
- Another CPI report will likely cause the Bank of Canada to maintain a hawkish stance, which could support the Canadian dollar, provided market sentiment continues to stabilize
Most Read: EUR/USD, USD/CAD, S&P 500, Gold, Silver & Oil Outlook
Statistics Canada will release the June inflation report on Wednesday. The consumer price index is seen rising 0.9% on a seasonally adjusted basis, boosted by soaring energy costs, bringing the annual rate from 7.7% to 8.4%, the highest level since 1982. Another hot CPI print is likely to prompt the Bank of Canada (BoC) to maintain a hawkish stance, increasing the likelihood of forceful tightening at upcoming monetary policy meetings.
Last week, BoC surprised markets by raising interest rates by 100 basis points to 2.5%, arguing that broadening inflationary pressures and excess demand warranted front-loading hikes. With GDP growth downshifting, the bank is increasingly inclined to go big now, rather than having to lift rates sharply later when deteriorating economic conditions may make those moves less palatable. This means policymakers could deliver another 100 bp adjustment in September, especially if the CPI outlook deteriorates further.
BoC’s aggressive tightening cycle can be viewed as a positive catalyst for the Canadian dollar, but for the bullish scenario to play out, market sentiment needs to stabilize. If U.S. recession fears continue to run rampant, high-beta and growth-linked currencies will continue to suffer against the U.S. dollar amid increased demand for safe-haven assets. Generally speaking, the greenback (USD) trades as a risk-off proxy in times of heightened uncertainty and market turbulence.
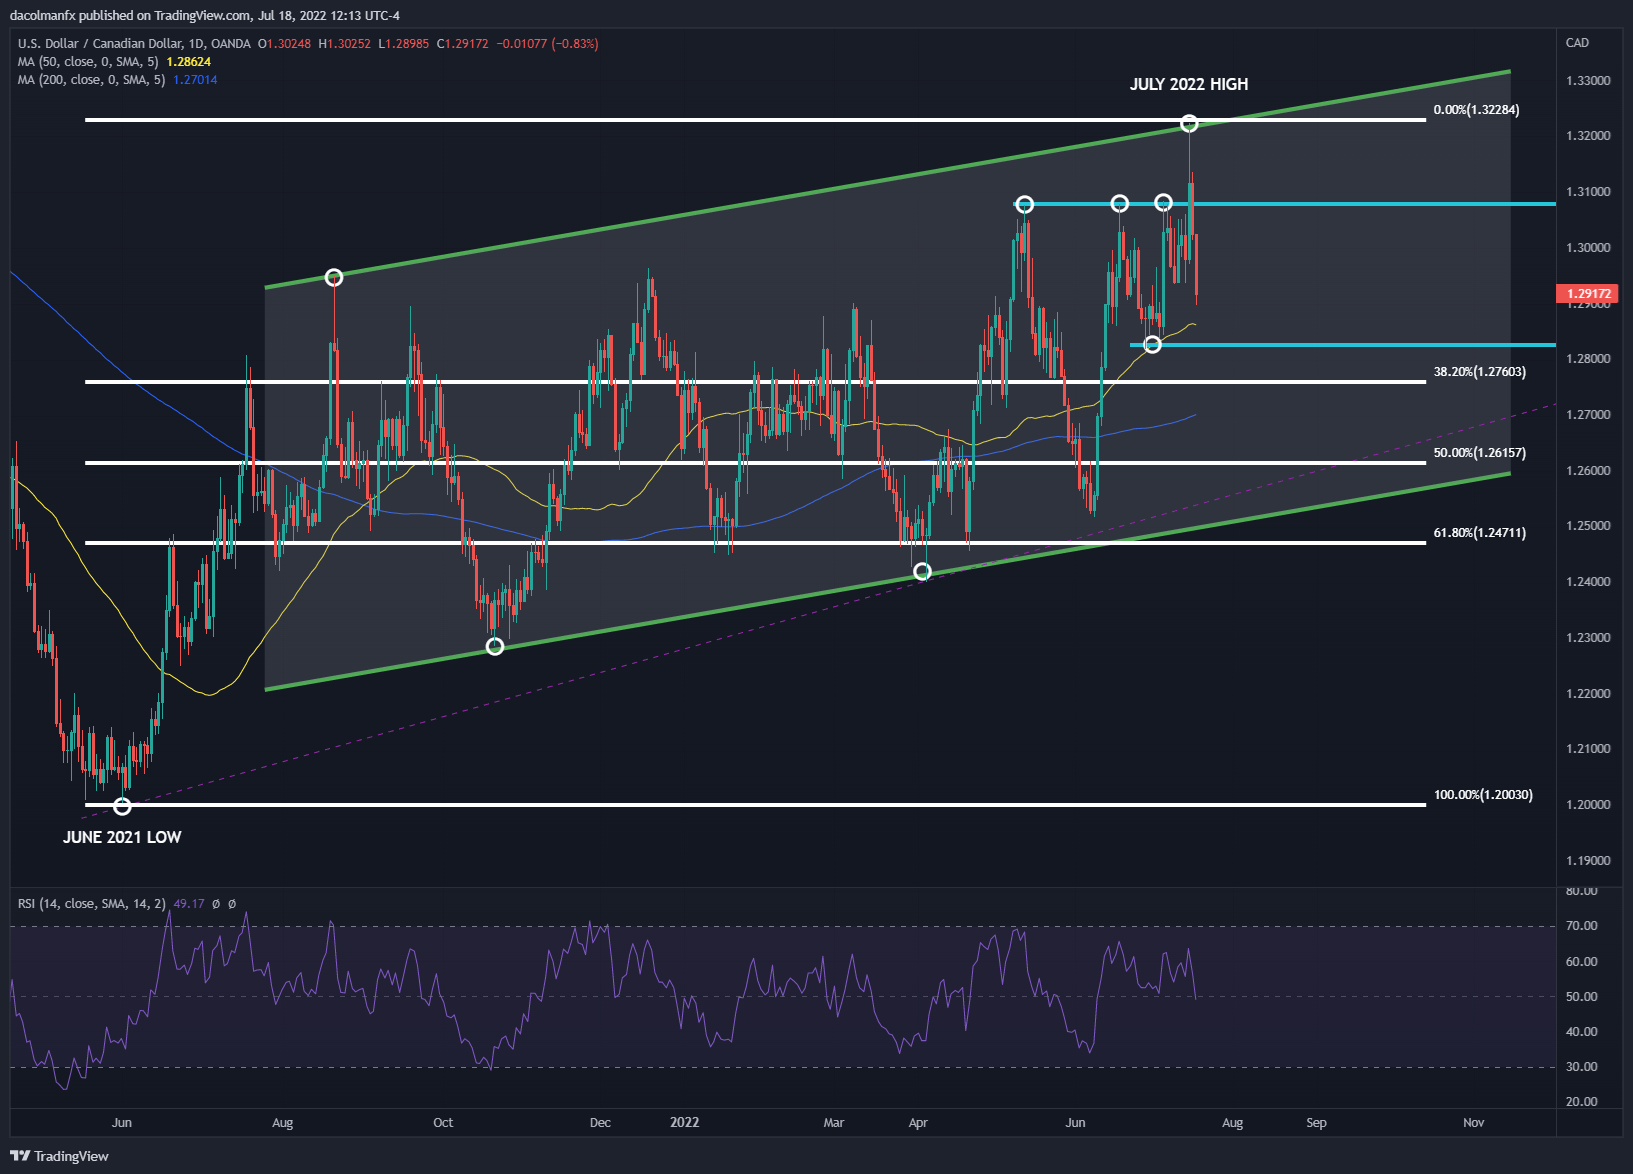
USD/CAD TECHNICAL ANALYSIS
USD/CAD soared to its highest mark since November 2020 last week, rising to ~1.3225, a key resistance area created by the upper boundary of a long-term rising channel. Prices quickly pivoted lower after testing that ceiling, with sellers resurfacing to spark a significant pull-back. If downside pressure accelerates in the coming sessions, bears could launch an attack on technical support at 1.2825. On further weakness, the focus shifts down to 1.2760, the 38.2% Fibonacci retracement of the June 2021/July 2022 advance.
On the flip side, if the recent correction comes to an end and the exchange rate resumes its ascent, the first key resistance to keep in mind appears around 1.3080, an area that has halted advances multiple times this year. The reaction here will be key, but if buyers manage to push USD/CAD decisively above this barrier, the pair could be on its way to retesting the channel topside trendline and its 2022 highs.
Be the first to comment