


oversnap
In our follow-up article on Eaton Vance Tax-Managed Diversified Equity Income Fund (NYSE:ETY), we would like to see whether it fulfills its duty to be both diversified and protected by a written options strategy. We have experienced unprecedented volatility and risks in both social life, stock markets, rising energy and essential commodities prices leading to high single-digit inflation in the U.S., the biggest war in Europe since 1945, etc.
When we combine all of these factors in one big pot, then we have something very complex, unpredictable, and pretty much not seen on the stock market for a very long period of time. However, this can also act as an important stress test to see whether our closed-end fund (“CEF”) can outperform funds that are tracking the performance of broader markets. On the other hand, maybe a written options strategy just works during a more “humane economic environment” (smaller recession, low double-digit crash in the stock market, etc.) and is not suitable for black-swan events like the global pandemic we have faced over the last couple of years.
Portfolio Construction
Seeking Alpha
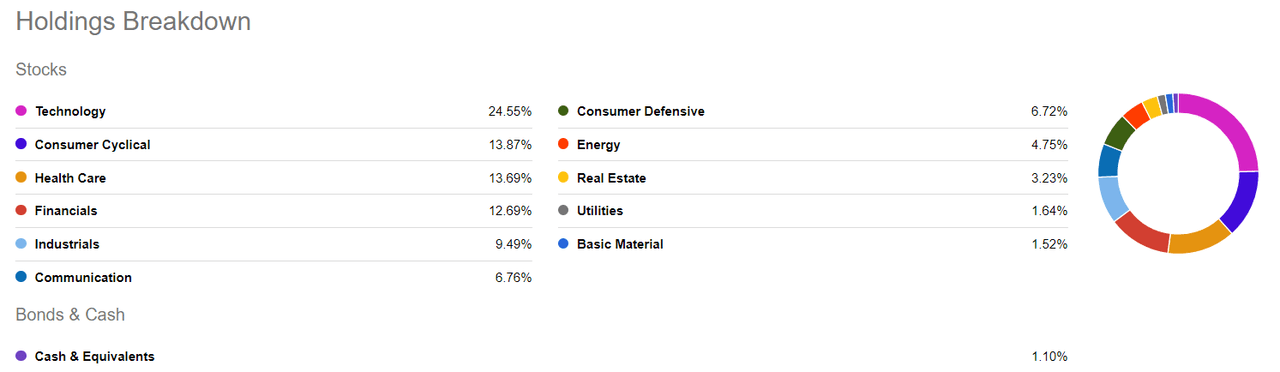
According to the figure above, this CEF has the largest exposure to technology, consumer cyclical, and health care industries, while the lowest exposure is towards basic material utilities and real estate. The consumer cyclical industry, in our view, should face difficulties in case we enter recession due to all the present negative factors like higher inflation or Chinese COVID-related lockdowns leading to supply chain disruptions. Nonetheless, we would prefer to see a higher exposure toward consumer defense and energy industries which make up together around 12.5% of total holdings.
In our view, consumer defensive stocks like, for instance, Lockheed Martin (LMT) should perform better relative to those involved in the most negatively impacted industries due to a recession or a potential future energy/food crisis – for example, airline companies like United Airlines (UAL).
Eaton Vance
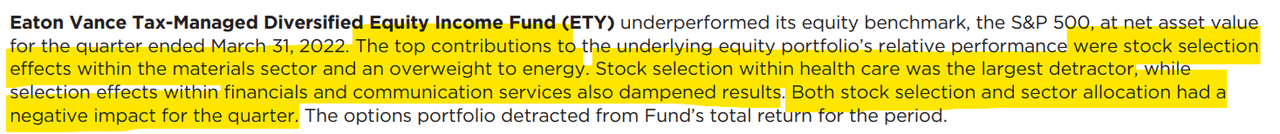
In addition, the portfolio management team has stated that being overweight in the energy and materials industry has been the biggest contributor to the outperformance of turbulent Q1 2022, while exposure to the healthcare industry has been the largest detractor. Surprisingly, healthcare should be at least a neutral contributor to overall market performance, as it is a very defensive industry by its nature.
YCharts
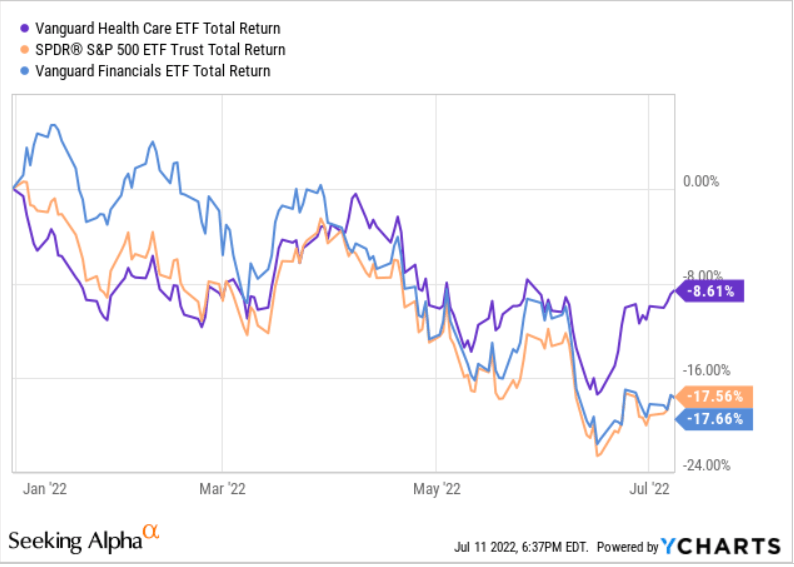
According to the figure above, Vanguard Healthcare ETF (VHT) has outperformed SPY by roughly 9 percentage points YTD, while Vanguard Financials ETF (VFH) has performed in line with SPY YTD. Nonetheless, at the end of Q1 2022, all of these previously mentioned ETFs performed relatively in line over the first three months of the year, which were labeled by COVID-19 pandemic, the unexpected Russian invasion of Ukraine, and the highest inflation in the U.S. and Eurozone over the last couple of decades.
This raises an alert over the stock selection abilities of the portfolio management team, given that it has performed poorly in the financial services and healthcare industries, which should perform relatively well in the rising interest rates and global pandemic environment. We would like to see now whether portfolio construction has any similarities to the broader ETF that is trying to replicate the performance of the S&P 500 index – SPDR S&P 500 Trust ETF (SPY).
Seeking Alpha
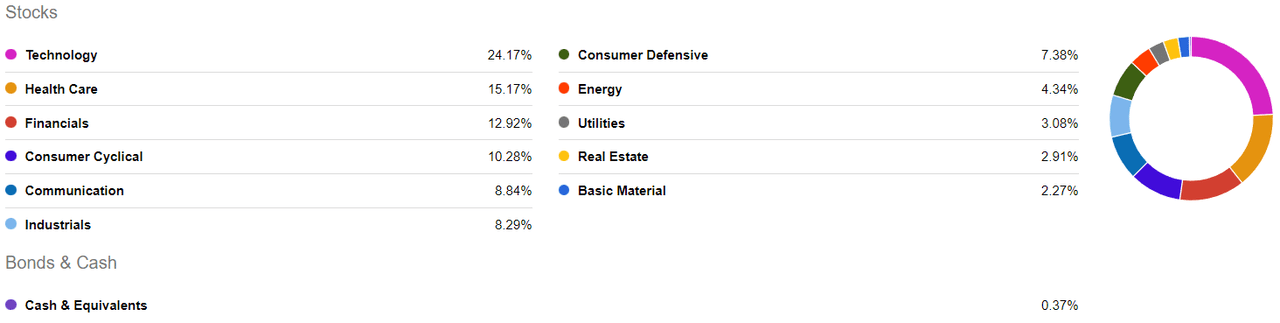
If we take a look into the industry exposure of SPY, then we can see that SPY has a higher degree of healthcare exposure compared to ETY (15.2% vs 13.9%) while a lower degree in consumer cyclical (13.9% vs 10.3%). Technology exposure is pretty much in line between both funds, while there is a slightly higher aggregate exposure of SPY towards the bottom three industries (utilities, real estate, and basic materials) compared to ETY (8.3% vs 6.4%). Another very interesting industry we would like to take a look at is consumer defensive given the highly tense macroeconomic environment worldwide, where we can spot that SPY has only approximately 0.5 percentage points higher exposure compared to ETY.
Seeking Alpha
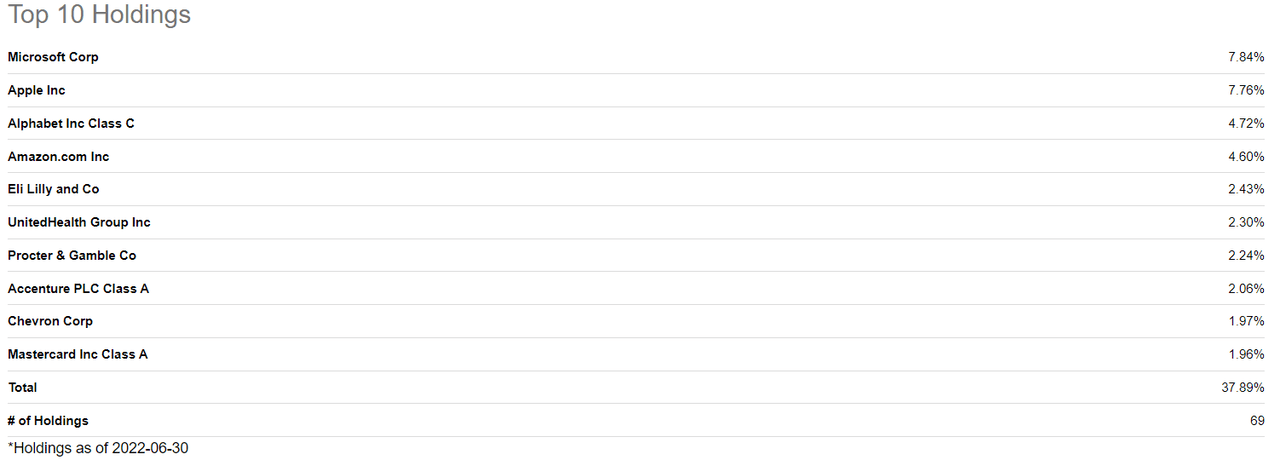
The top 4 holdings are the most common names on Wall Street when it comes down to large-cap tech investing. We are very optimistic about the future business and stock price performance of Microsoft (MSFT), Amazon (AMZN), Alphabet (GOOG, GOOGL), and Apple (AAPL) over the long term. In our view, all of these companies will play a crucial part in the future digitization of our daily lives – like the evolution of Web 3.0, Virtual Reality in Metaverse, IoT connectivity through 5G, etc. However, given the almost doomsday geopolitical and macroeconomic scenarios, we have been facing lately worldwide, we would prefer to see a slightly lower individual weight exposure of the top 4 holdings (less than 2.5%).
In almost every article, we emphasize the importance of the long-term outlook and setting up our portfolios according to those principles. However, in times of unprecedented market volatility, macroeconomic difficulties, and geopolitical challenges, we believe that diversification is the key. We might not know what kind of future lies ahead or any kind of new unexpected challenges (like a potential Chinese invasion of Taiwan), but we would prefer to have a level ground once things start to return back to normal.
For example, let’s say this CEF would have a high individual exposure to high-growth tech stocks or crypto-related stocks, which could destroy the market value of the portfolio by 70% before the business climate begins to return back to normal. Then our CEF portfolio managers would need to make around 233% return just to break even, which could take them at least 5 – 10 years. However, if this CEF would be well-diversified and protected by a written options strategy as it is, a sharp downfall could be minimized maybe to only 20%. In that case, only a gain of 25% would be needed to break even, which can be done within a year, when there is a strong bullish trend on Wall Street.
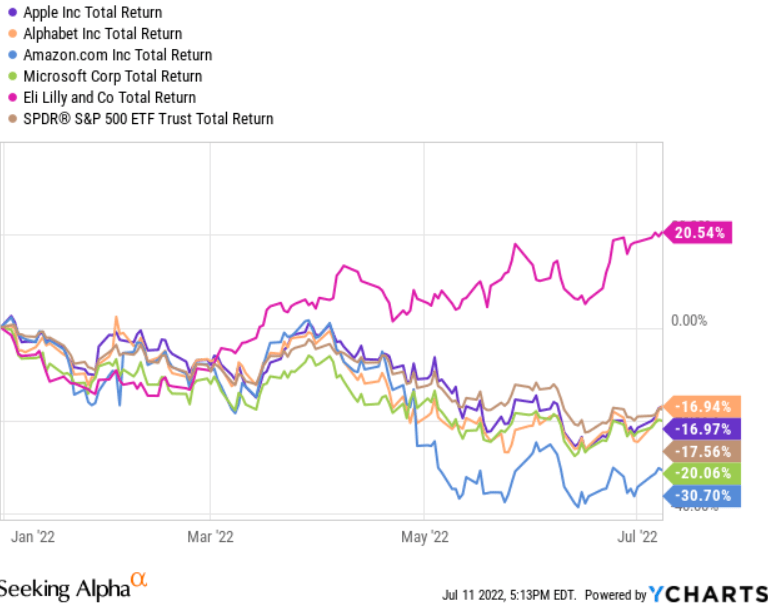
Now, let’s take a look at how the top 5 holdings of this CEF, which make up % of total holdings, have performed relative to broader S&P 500 stock market indexes.
YCharts
According to the figure above, Alphabet and Apple have performed slightly better than SPY, while MSFT has slightly underperformed YTD. On the other hand, Eli Lilly (LLY) has greatly outperformed all of them including SPY, while AMZN has been the weakest performer in the top 5 holdings group. LLY can be seen as a basic example of how important it is to have a diversified portfolio. In our view, such individual defensive stocks in the healthcare industry can minimize the losses our portfolio contributes to larger tech stocks, which in general follow major moves in broader stock market indexes and are largely impacted by broader sentiment on Wall Street.
If we compare the top 10 holdings with those of SPY, then we can see that only 5 out of 10 holdings are exactly the same (AMZN, GOOG, MSFT, APPL, UnitedHealth Group Inc. (UNH)). We can summarize that there are some similarities between both ETY and SPY portfolio constructions. However, there should be some discrepancies between the relative performance of both funds over the long term. Nonetheless, ETY uses a similar degree of broader diversification as SPY, only with a different type of individual stock selection and industry exposure combined with a written option strategy to protect against downfalls.
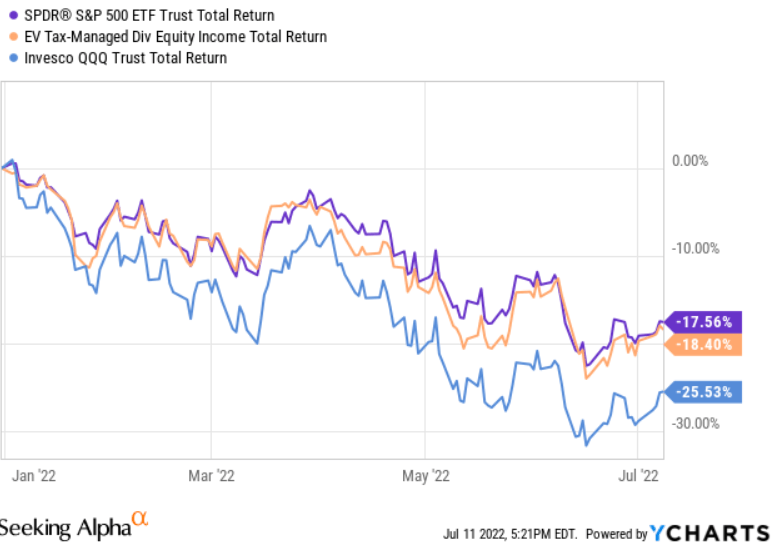
Now, let’s test whether this CEF basically tries to replicate the performance of the broader Nasdaq 100 index (QQQ), which could indicate high exposure toward growth-related stocks.
YCharts
According to the figure above, ETY has outperformed QQQ by approximately 7.1 percentage points, while it has fallen behind SPY by slightly more than 0.8 percentage points. This definitely indicates that ETY better replicates the performance of a broader stock market index like SPY compared to being highly tilted towards the higher number of growth tech stocks, which can be found in the Nasdaq-100 index.
This can also be seen on the top 10 holdings list, as other holdings on the list are more or less “traditional business” companies like Mastercard (MA), Chevron (CVX), or Procter & Gamble (PG). We are also very positive about the long-term business and stock market performance of large-cap companies in traditional industries like energy, consumer discretionary, or financial services.
In our view, the present challenging economic environment of the developed countries labeled by high inflation, lack of adequate workforce, and persistent supply chain disruptions, will most likely force small businesses to shut down or at least be acquired by larger competitors. In addition, large-caps in the most impacted industries have a better resiliency to endure a tougher macroeconomic environment for a lot longer compared to smaller counterparts.
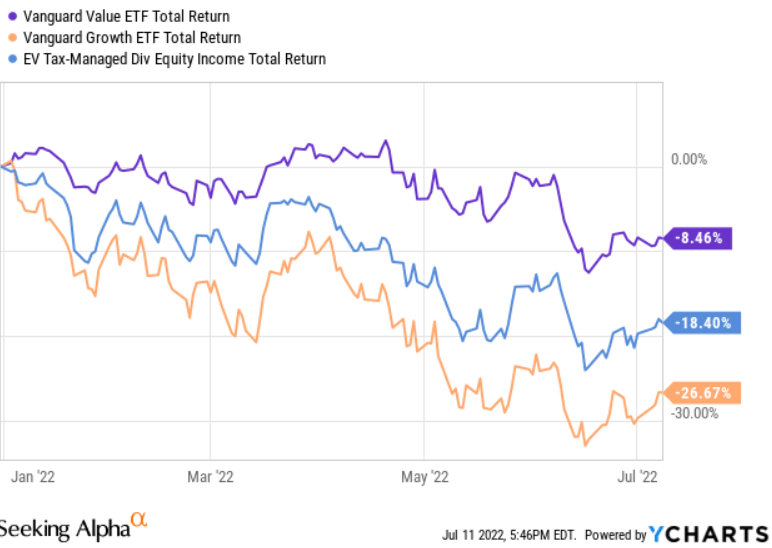
To sum it up, we are highly optimistic about the future long-term performance of the top 10 holdings of this CEF. However, an interesting question arises, how this CEF has been tracking the performance of broader value-related or growth-related ETFs.
YCharts
According to the figure above, Vanguard Value Index Fund ETF (VTV) has outperformed ETY by approximately 10 percentage points YTD, while Vanguard Growth Index Fund ETF (VUG), has fallen behind ETY by approximately 8.2 percentage points. This clearly points out that this CEF has performed more in line with growth-related indexes compared to value ones. Now, maybe it is time to dig into whether the relative outperformance compared to growth indexes like QQQ and VUG was a result of the general stock market performance of the portfolio holdings, or maybe written options strategy has played a crucial part.
Historical Market Performance
Morningstar
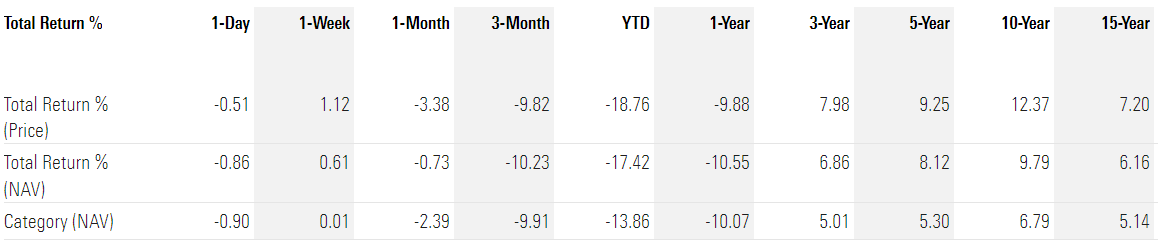
According to the figure above, ETY has outperformed its category group, which is computed by Morningstar company over a time period of 3 to 15 years. The biggest gap of approximately 550 bps in the field of total return % (NAV) can be seen in the 10-year time period. Surprisingly, over the last 3 months and years to date, ETY has underperformed its category group, which raises an alert in our overall approach towards investing in ETY.
Given that it uses a written options strategy, we were expecting this CEF to be resilient against any major stock market downfalls, or at least to perform relatively well against its peers. However, plenty of times companies in the investment industry use a marketing approach to label something to be diversified or ESG, but in the end, it all ends up only on paper. That is why it is really important to dig deeper into overall portfolio construction and relative market performance, whether we are willing to pay a higher expense fee and take on a different risk profile in our investment portfolio by acquiring a CEF like ETY compared to only buying funds that are trying to replicate a broader stock market performance.
Written Options Strategy
Eaton Vance
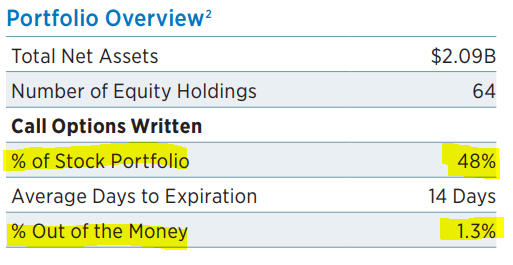
According to the figure above, 48% of the stock portfolio is covered by written call options which usually have 14 days to expire. In our view, that is a very active approach to managing risk bi-monthly, and one might start to question whether we are willing to pay for related short-term operational costs and commissions. Maybe it is just us that would like to see a quarterly expiration date to lower related trading costs, but in that case, the portfolio management team would have less power to mitigate any short-term related market exposures.
Unfortunately, we do not have a more detailed insight into how the written options strategy impacts the overall market performance of ETY in the short run, and will have to wait for annual reports to be published later at the end of the fiscal year in October.
Eaton Vance
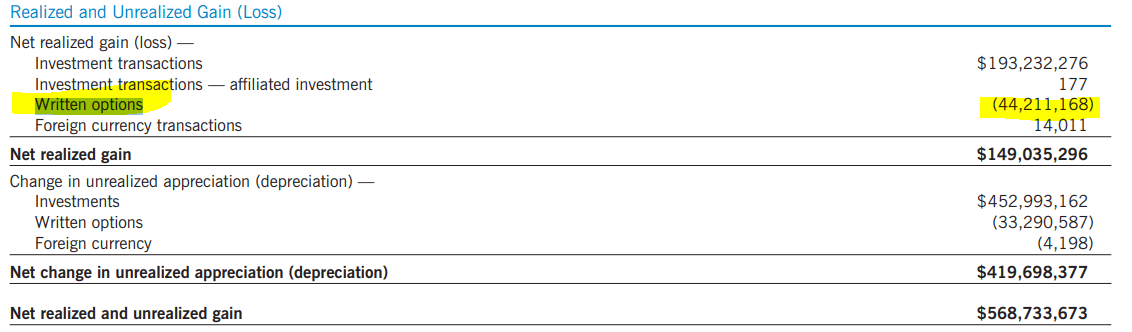
Based on reported data in 2021, written options have contributed to a loss of $44.2 million or 23% of total investment transactions. However, if we take a look at the change in unrealized appreciation of investments (this number makes up slightly less than 10%).
In our previous article analyzing ETY last year, this number was a loss of $106.7 million coming from written options strategy, while investment transactions and unrealized appreciation of investment were $41.6 million and $143.9 million, respectively. Our readers should keep in mind that the written options strategy takes a considerable amount of annual net realized and unrealized gain for hedging purposes. It is all fine with us, but maybe the current turbulent business environment creates a perfect test of whether we are better off investing in this CEF for hedging and diversification purposes. Or maybe we would rather be buying a CEF or ETF that is trying to replicate the performance of the border market.
Dividends
Fidelity
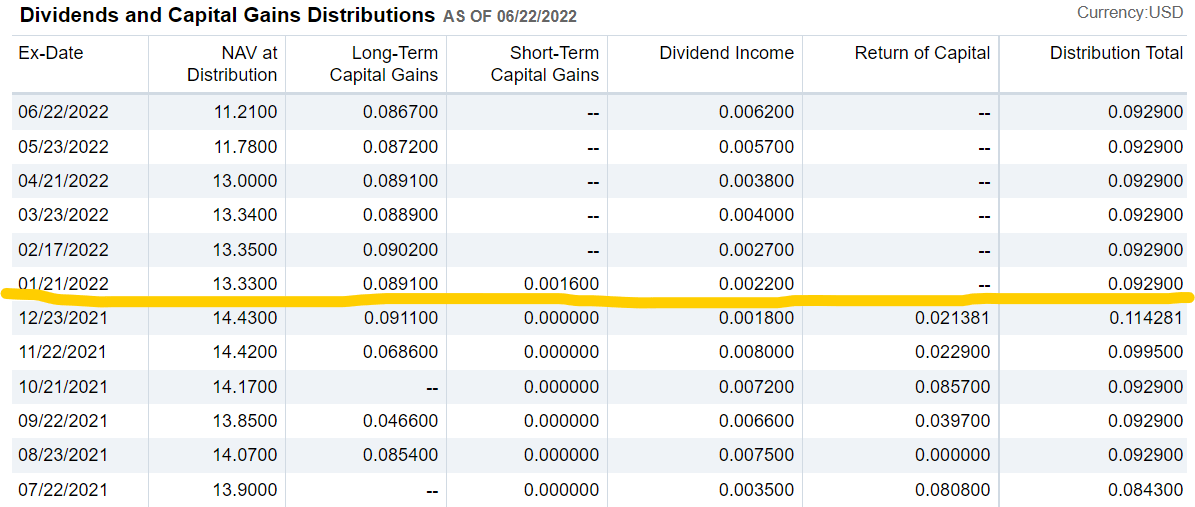
When it comes down to distributions, this CEF has stopped returning capital back to shareholders so far from the beginning of 2022. The monthly distributions also come primarily from long-term capital gains, combined with a smaller amount of dividend income so far in 2022. We find this very positive, and also a monthly distribution amount of $0.0929 per share has been steady so far in H1 2022.
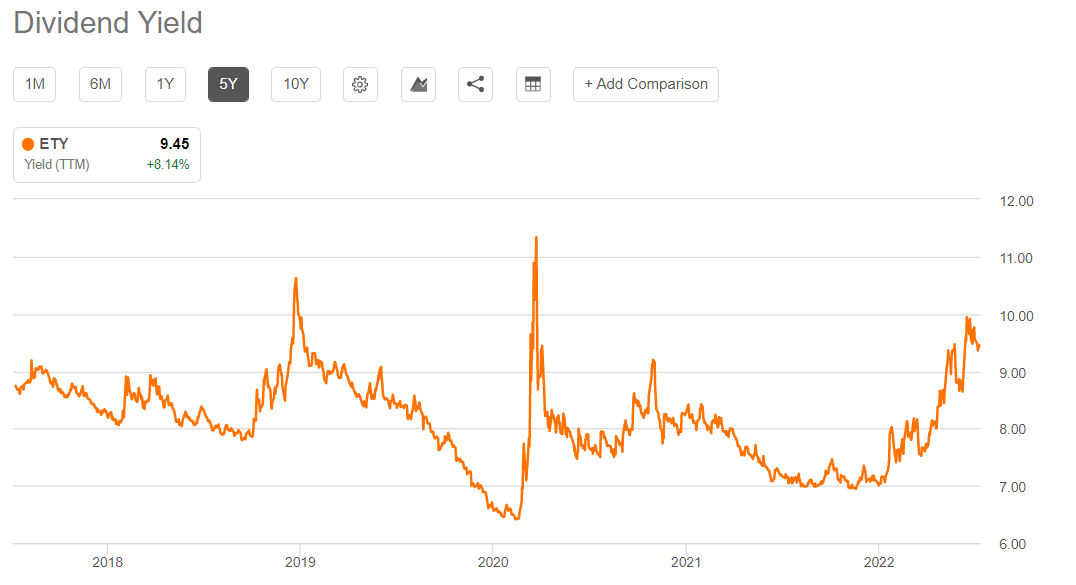
Seeking Alpha
According to the figure above, ETY provides a forward distribution yield of 8.14% as of 07/12/2022 and has been already close to 10% a couple of weeks ago. It has a very high distribution yield, which also comes with risk. Our readers, should always check U.S.-10 Year Treasury yield (currently around 3.0%) and in the case, it rises above 5% due hawkish monetary policy of the FED to lower inflation in the U.S., then maybe they should just hedge their portfolio by buying U.S. government bonds.
This is really an important thing to consider as plenty of institutional investors might decide to sell their active positions in funds and equities and just use U.S. government bonds as safe haven before things return back to normal. We have been living in a period of low-interest rates for over a decade, but now maybe is the time to again reassess our approach to risk and relative valuations between certain income-bearing securities or funds.
Conclusion
We would like to maintain a NEUTRAL rating, primarily because of the challenging global economic and geopolitical environment, with so many possible black swan events or further deterioration of key market risks – pandemic, the war in Ukraine, inflation. We do recommend our readers follow this CEF closely over the next couple of quarters, primarily to see whether it can protect their portfolio in times of unprecedented uncertainty or volatility, or is a solely written option strategy, just maybe a marketing tool created by Eaton Vance asset management firm just to increase fund inflows.
Overall, we are satisfied with the general performance of this CEF so far in 2022 and also with the construction of the portfolio holdings. However, we do believe it should be constructed a little bit more defensive as a higher consumer cyclical exposure might not be the wisest thing to have at the moment.
Editor’s Note: This article discusses one or more securities that do not trade on a major U.S. exchange. Please be aware of the risks associated with these stocks.
Be the first to comment