

CANADIAN DOLLAR FORECAST: USD/CAD PRICE TESTS TECHNICAL SUPPORT POST-FED, EUR/CAD JUMPS AFTER ECB
The Canadian Dollar looks like it may start to come under pressure following an impressive recovery in CAD price action over the last few weeks. Despite the 5% rally notched by the Canadian Dollar Currency Index (CXY) since its March 18 low, the Loonie still trades about 7% below its year-to-date high. Canadian Dollar weakness since January has mirrored the crude oil price crash considering the energy sector contributes roughly 10% to Canada GDP.

Recommended by Rich Dvorak
Forex for Beginners
CANADIAN DOLLAR REBOUNDED AS CRUDE OIL PRICES BOTTOMED; WILL CORONAVIRUS RECESSION RISK RESURFACE & PUSH THE LOONIE LOWER?
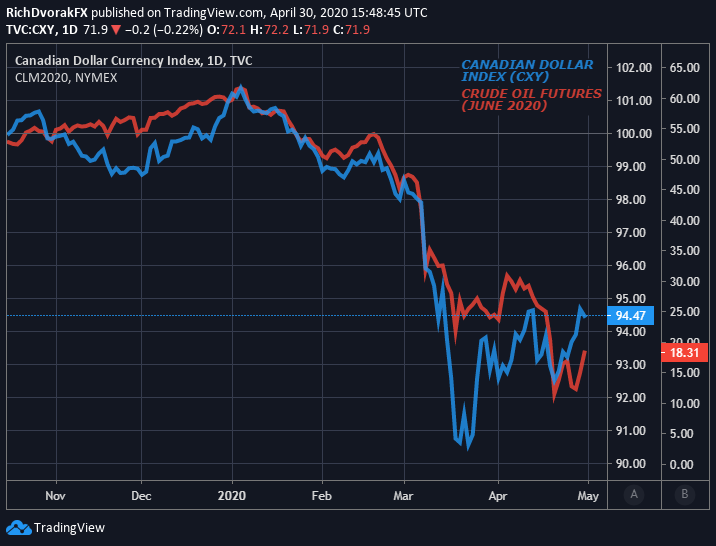
Chart created by @RichDvorakFX with TradingVie
Crude oil prices also tend to have a material impact on inflation. Seeing that the Bank of Canada governing mandate is inflation targeting, sharp swings in crude oil can weigh considerably on BOC monetary policy decisions. On that note, aiming to offset economic turmoil that stems from the coronavirus pandemic and likely unavoidable recession, the BOC slashed target interest rates this year along with several other central banks.
Learn More – CAD & Oil: Canadian Dollar and Oil Price Correlation
Downward pressure on the Loonie and Canadian economy subsided following dovish action from the BOC and OPEC+ deal that is anticipated to put a floor in crude oil. While crude oil demand woes persist and market complacency builds, however, the recent Canadian Dollar rebound may soon experience another breakdown. That said, USD/CAD and EUR/CAD price action are both responding to major technical support levels and suggests the Canadian Dollar could be on the cusp of a reversal.
USD/CAD PRICE CHART: DAILY TIME FRAME (31 DECEMBER 2019 TO 30 APRIL 2020)

USD/CAD is hovering above a support zone underpinned by the 1.3800 handle. Spot USD/CAD price action has so far held its April 13 intraday low and provides a sign of encouragement for Canadian Dollar bears. Although, if USD/CAD prices attempt to extend a rebound, the 1.4000 level, which is underpinned by the 9-day and 34-day exponential moving averages, could present headwinds.
| Change in | Longs | Shorts | OI |
| Daily | 19% | -28% | -9% |
| Weekly | 2% | 7% | 4% |
EUR/CAD PRICE CHART: DAILY TIME FRAME (25 JANUARY TO 30 APRIL 2020)
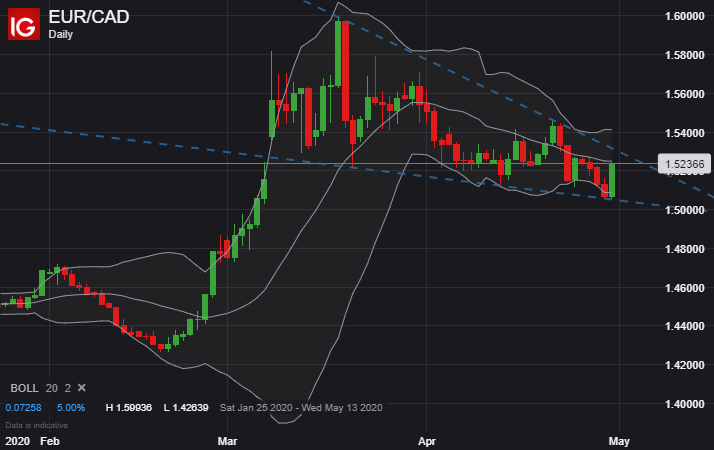
EUR/CAD is also climbing as the Euro rips higher off technical support near the 1.5050 price level. Spot EUR/CAD jumped after running into its bottom Bollinger Band and reiterated the bullish rising wedge chart pattern. Additionally, it looks like EUR/CAD is on pace to print a bullish engulfing candlestick, which, if confirmed, provides another indication that the Canadian Dollar has started to reverse back lower.
Keep Reading – US Dollar Chart Setups Post-FOMC: DXY Index, EUR/USD, & AUD/USD
— Written by Rich Dvorak, Analyst for DailyFX.com
Connect with @RichDvorakFX on Twitter for real-time market insight
Be the first to comment