

Canadian Dollar Talking Points
USD/CAD takes out the October high (1.3383) ahead of Canada’s Gross Domestic Product (GDP) report, and the exchange rate may continue to retrace the decline from last year as a bull flag formation unfolds.
USD/CAD Clears October High Ahead of BoC Meeting as Bull Flag Unfolds
The Canadian Dollar depreciates against all of its major counterparts as the coronavirus outbreak transpires during the protest to TC Energy Corp’s gas pipeline, with Canada Transport Minister Marc Garneau warning that the impact from the demonstration may last for “many, many weeks.”
In turn, the update to the GDP report may produce additional headwinds for the Canadian Dollar as the economy is anticipated to grow 0.3% during the last three months of 2019 after expanding 1.3% in the third quarter. A marked slowdown in the growth rate may put pressure on the Bank of Canada (BoC) to reverse the rate hikes from 2018 as “data for Canada indicate that growth in the near term will be weaker.”
It remains to be seen if the BoC will deliver a rate cut at the next meeting on March 4 as the central bank insists that “some of the slowdown in growth in late 2019 was related to special factors.” In turn, Governor Stephen Polozmay continue to endorse a wait-and-see approach ahead of his departure in June as “the Bank now forecasts real GDP will grow by 1.6 percent this year and 2 percent in 2021, following 1.6 percent growth in 2019.”
Until then, the recent advance in USD/CAD may gather pace as a bull flag formation unfolds, and the exchange rate may continue to retrace the decline from 2019 especially if the BoC shows a greater willingness to implement lower interest rates in 2020.

Recommended by David Song
Forex for Beginners
Sign up and join DailyFX Currency Strategist David Song LIVE for an opportunity to discuss potential trade setups.
USD/CAD Rate Daily Chart
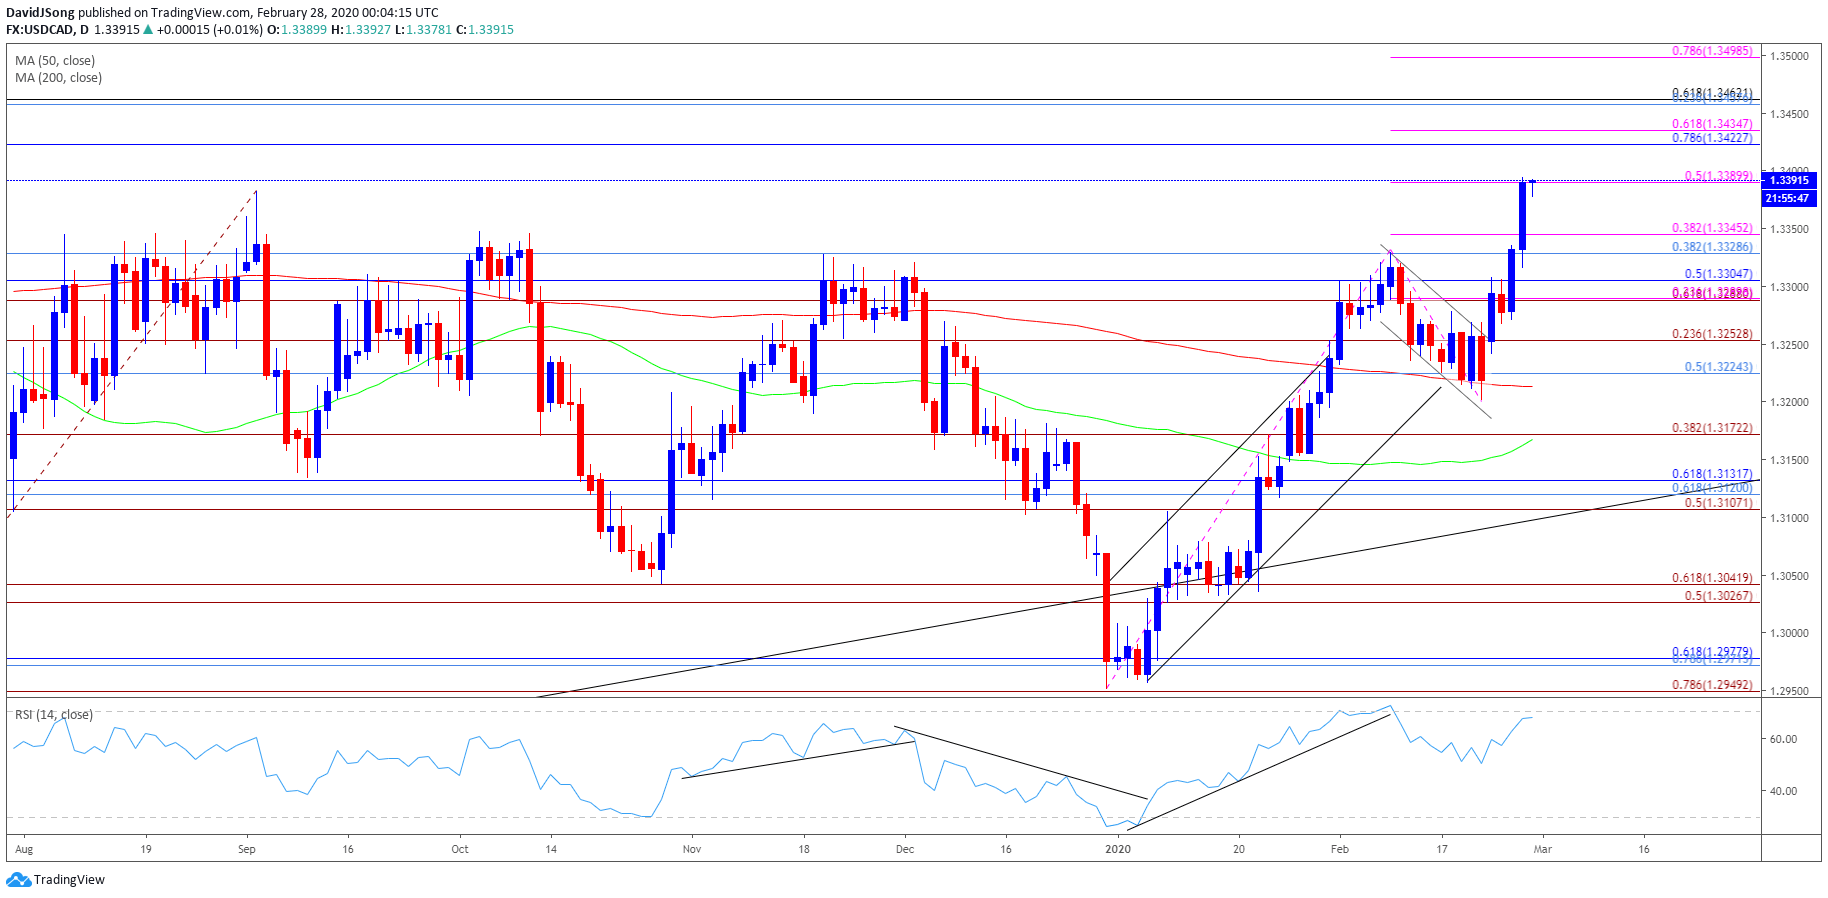
Source: Trading View
- Keep in mind, the near-term strength in USD/CAD emerged following the failed attempt to break/close belowthe Fibonacci overlap around 1.2950 (78.6% expansion) to 1.2980 (61.8% retracement), with the yearly opening range highlighting a similar dynamic as the exchange rate failed to test the 2019 low (1.2952) during the first full week of January.
- There appears to be shift in USD/CAD behavior as the exchange rate breaks out of the range from the fourth quarter of 2019 and clears the October high (1.3383).
- In turn, USD/CAD may work its way towards the June high (1.3565) as the bull flag formation unfolds, but need a close above 1.3390 (50% expansion) to open up the Fibonacci overlap around 1.3420 (78.6% retracement) to 1.3430 (61.8% expansion).
- Next area of interest comes in around 1.3460 (61.8% retracement) followed by the 1.3500 (78.6% expansion) handle.
- Will keep a close eye on the Relative Strength Index (RSI) as it comes up against overbought territory, but lack of momentum to push above 70 may signal a potential divergence with price as the oscillator fails to make new highs in 2020.

Recommended by David Song
Traits of Successful Traders
— Written by David Song, Currency Strategist
Follow me on Twitter at @DavidJSong
Be the first to comment