

wildpixel
Ugliest-ever trade deficit. But US exports grew to $2 trillion, 10% was crude oil & petroleum products. Pharma & industrial machinery exports were #3 and #4.
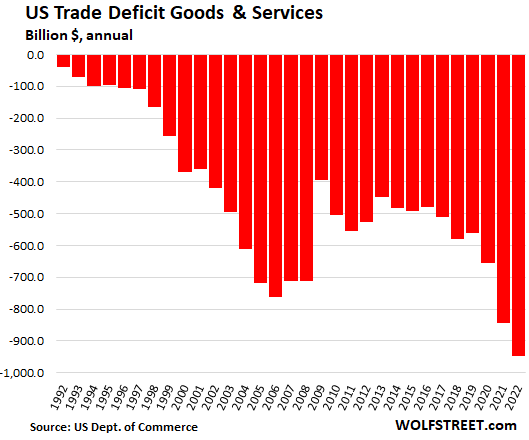
The US trade deficit in goods and services in 2022 ballooned by 12% to an all-time magnificent breath-taking record of $948 billion, according to data by the Commerce Department.
A trade deficit is not a sign of a vibrant economy. Instead, it’s a negative for GDP, a negative for US jobs, and a negative for the overall economy. It exists because Corporate America went in search of cheap labor and products to fatten up its profit margins.
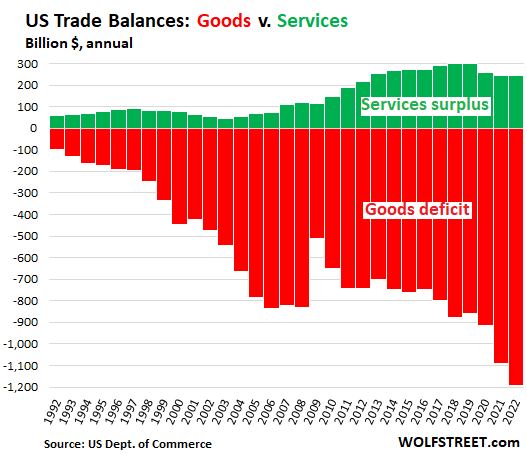
Services trade surplus declines fourth year in a row.
The US trade surplus in services dipped further in 2022, from the already beaten down levels of 2021, to $244 billion, the lowest since 2012, and the fourth year in a row of declines.
Imports of services jumped by 24% to a record $680 billion. Exports of services jumped by 16% to $924 billion.
Spending for international travel is part of the trade in services. When Americans travel overseas and spend their money overseas, it counts as imports of services. Conversely, it counts as exports of services when foreign tourists, foreign students, etc. spend their foreign-earned money in the US. Think of it in terms of money-flows: when tourist spend their money in the US, money flows from overseas to the US, as it does with other exports.
International travel has been thrown out of whack during the pandemic. By 2022, most of the travel restrictions were lifted or at least loosened, and travel in both directions has rebounded. We’ll get to the details in a moment.
The services surplus of $244 billion (green) was dwarfed by the trade deficit in goods, which worsened by 12%, to $1.19 trillion, by far the worst ever (red). We’ll get to the ugly details of goods in a moment.
Services exports by major category:
The top four categories account for 73% of services exports. Travel (#3) jumped by 91% year-over-year, as travel restrictions were lifted. This is spending by foreign travelers in the US, and includes travel for personal, health-related, and educational purposes; business travel; and for seasonal/short-term work.
The #4 category, Charges for the Use of Intellectual Property, accounts for software, movies, music, licensing agreements, etc.
| In billion $ | 2020 | 2021 | 2022 | YoY % |
| Total Services, exports | 726 | 795 | 924 | 16% |
| Other Business Services | 195 | 217 | 244 | 12% |
| Financial Services | 151 | 172 | 166 | -3% |
| Travel, foreign travelers in the US | 72 | 70 | 134 | 91% |
| Charges for the Use of Intellectual Property | 116 | 125 | 127 | 2% |
| Transport | 57 | 66 | 90 | 37% |
| Telecommunications, Computer, and Information Services | 56 | 60 | 69 | 16% |
| Government Goods and Services | 22 | 23 | 30 | 28% |
| Personal, Cultural, and Recreational Services | 21 | 24 | 26 | 11% |
| Insurance Services | 20 | 23 | 21 | -6% |
| Maintenance and Repair Services | 13 | 13 | 14 | 14% |
Services imports by major category:
Travel as imports of services – Americans spending money overseas – doubled year-over-year and tripled from 2020 as travel restrictions were lifted and “revenge travel” set in.
| In billion $ | 2020 | 2021 | 2022 | YoY % |
| Total Services, imports | 467 | 550 | 680 | 24% |
| Transport | 73 | 105 | 154 | 47% |
| Other Business Services | 113 | 130 | 138 | 7% |
| Travel (Americans overseas) | 34 | 57 | 113 | 99% |
| Insurance Services | 58 | 59 | 57 | -4% |
| Financial Services | 45 | 50 | 54 | 8% |
| Charges for the Use of Intellectual Property | 48 | 43 | 52 | 20% |
| Telecommunications, Computer, and Information Services | 40 | 43 | 47 | 10% |
| Personal, Cultural, and Recreational Services | 24 | 28 | 29 | 3% |
| Government Goods and Services | 25 | 25 | 25 | 1% |
| Maintenance and Repair Services | 6 | 8 | 8 | 6% |
Trade deficit in goods blows out.
The trade deficit in goods worsened by 9% to a mind-bending record of $1.19 trillion.
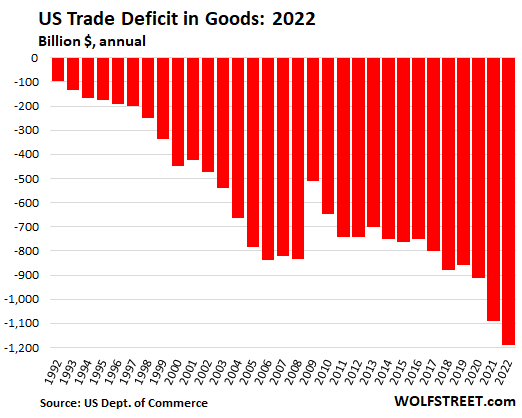
Exports of goods jumped by $324 billion, or by 18%, to $2.09 trillion.
Crude oil and petroleum products reign. Of the total exports of goods, $208 billion, or 10%, were crude oil (up 69% from a year ago) and petroleum products, such as gasoline (up 42%). Price increases were in part responsible for this huge surge.
Pharma products were #3, at $90 billion.
The largest agricultural category by value is soybeans (up 25% year-over-year), at $36 billion, in 18th place, accounting for 1.7% by value of US exports.
Here are the 54 largest categories with an export value of at least $10 billion. Have a good look. There’s some fascinating stuff in it:
| Exports by category, in billion $ | 2021 | 2022 | % YoY | |
| 1 | Crude oil | 69 | 117 | 69% |
| 2 | Other petroleum products | 64 | 91 | 42% |
| 3 | Pharmaceutical preparations | 83 | 90 | 8% |
| 4 | Other industrial machinery | 68 | 74 | 8% |
| 5 | Semiconductors | 66 | 66 | 0% |
| 6 | Natural gas | 40 | 63 | 57% |
| 7 | Fuel oil | 32 | 60 | 88% |
| 8 | Passenger cars, new and used | 54 | 57 | 5% |
| 9 | Other automotive parts and accessories | 47 | 54 | 15% |
| 10 | Plastic materials | 44 | 50 | 14% |
| 11 | Electric apparatus | 43 | 49 | 14% |
| 12 | Civilian aircraft engines | 38 | 45 | 19% |
| 13 | Medical equipment | 40 | 43 | 8% |
| 14 | Other chemicals | 39 | 42 | 7% |
| 15 | Nonmonetary gold | 31 | 40 | 30% |
| 16 | Organic chemicals | 34 | 40 | 17% |
| 17 | Natural gas liquids | 31 | 38 | 22% |
| 18 | Soybeans | 29 | 36 | 25% |
| 19 | Telecommunications equipment | 33 | 35 | 6% |
| 20 | Other industrial supplies | 30 | 32 | 9% |
| 21 | Cell phones and other household goods | 30 | 32 | 5% |
| 22 | Computer accessories | 29 | 32 | 8% |
| 23 | Civilian aircraft | 24 | 29 | 20% |
| 24 | Measuring, testing, control instruments | 24 | 28 | 15% |
| 25 | Industrial engines | 23 | 27 | 15% |
| 26 | Meat, poultry, etc. | 25 | 27 | 6% |
| 27 | Finished metal shapes | 22 | 25 | 14% |
| 28 | Trucks, buses, and special purpose vehicles | 21 | 24 | 14% |
| 29 | Gem diamonds | 17 | 21 | 24% |
| 30 | Civilian aircraft parts | 18 | 20 | 12% |
| 31 | Engines and engine parts | 19 | 20 | 8% |
| 32 | Corn | 20 | 20 | 0% |
| 33 | Precious metals, other | 25 | 19 | -25% |
| 34 | Computers | 18 | 18 | 4% |
| 35 | Other foods | 18 | 18 | 1% |
| 36 | Fertilizers, pesticides, and insecticides | 10 | 15 | 55% |
| 37 | Newsprint | 13 | 15 | 10% |
| 38 | Toiletries and cosmetics | 13 | 14 | 8% |
| 39 | Laboratory testing instruments | 13 | 14 | 3% |
| 40 | Generators, accessories | 12 | 14 | 10% |
| 41 | Metallurgical grade coal | 7 | 13 | 80% |
| 42 | Inorganic chemicals | 11 | 13 | 22% |
| 43 | Materials handling equipment | 12 | 13 | 9% |
| 44 | Animal feeds | 11 | 12 | 14% |
| 45 | Toys, games, and sporting goods | 11 | 12 | 13% |
| 46 | Excavating machinery | 11 | 12 | 14% |
| 47 | Iron and steel mill products | 10 | 12 | 21% |
| 48 | Jewelry | 9 | 12 | 28% |
| 49 | Coal and fuels, other | 7 | 12 | 59% |
| 50 | Artwork and other collectibles | 9 | 11 | 27% |
| 51 | Pulpwood and woodpulp | 10 | 11 | 13% |
| 52 | Photo, service industry machinery | 9 | 10 | 14% |
| 53 | Steelmaking materials | 10 | 10 | -1% |
| 54 | Aluminum and alumina | 8 | 10 | 22% |
Imports of goods spiked by $425 billion, or by 15%, to $3.28 trillion. This caused some heartache when those global supply chains got tangled up, triggering all kinds of shortages, but the search of cheap labor and products rule the day.
Of the total imports of goods, crude oil was #1 by value at $198 billion, up 49% year-over-year thanks to the price increases. Pharma products were #2, at $190 billion. Passenger cars were #3.
Note the imports of tech equipment, categories #5 through #10.
| Imports by Category, in billion $ | 2021 | 2022 | YoY | |
| 1 | Crude oil | 133 | 198 | 49% |
| 2 | Pharmaceutical preparations | 171 | 190 | 11% |
| 3 | Passenger cars | 143 | 162 | 13% |
| 4 | Other automotive parts and accessories | 116 | 135 | 16% |
| 5 | Cell phones and other household goods | 121 | 132 | 9% |
| 6 | Computers | 100 | 103 | 3% |
| 7 | Electric apparatus | 69 | 89 | 29% |
| 8 | Telecommunications equipment | 66 | 79 | 19% |
| 9 | Semiconductors | 70 | 78 | 12% |
| 10 | Computer accessories | 70 | 78 | 12% |
| 11 | Other industrial machinery | 66 | 76 | 16% |
| 12 | Other textile apparel and household goods | 55 | 64 | 15% |
| 13 | Toys, games, and sporting goods | 57 | 60 | 5% |
| 14 | Medical equipment | 59 | 57 | -4% |
| 15 | Cotton apparel and household goods | 46 | 54 | 16% |
| 16 | Other petroleum products | 40 | 53 | 31% |
| 17 | Trucks, buses, and special purpose vehicles | 43 | 52 | 21% |
| 18 | Furniture, household goods, etc. | 48 | 51 | 6% |
| 19 | Industrial supplies, other | 43 | 49 | 14% |
| 20 | Finished metal shapes | 35 | 48 | 38% |
| 21 | Household appliances | 41 | 42 | 2% |
| 22 | Organic chemicals | 34 | 39 | 14% |
| 23 | Generators, accessories | 30 | 37 | 22% |
| 24 | Fuel oil | 28 | 36 | 30% |
| 25 | Engines and engine parts | 30 | 32 | 8% |
| 26 | Industrial engines | 28 | 31 | 11% |
| 27 | Iron and steel mill products | 26 | 30 | 14% |
| 28 | Fish and shellfish | 28 | 30 | 6% |
| 29 | Photo, service industry machinery | 27 | 30 | 8% |
| 30 | Other foods | 23 | 27 | 17% |
| 31 | Fruits, frozen juices | 24 | 27 | 15% |
| 32 | Materials handling equipment | 22 | 27 | 21% |
| 33 | Plastic materials | 24 | 27 | 10% |
| 34 | Measuring, testing, control instruments | 23 | 25 | 11% |
| 35 | Footwear | 20 | 25 | 28% |
| 36 | Bauxite and aluminum | 18 | 24 | 35% |
| 37 | Other chemicals | 19 | 24 | 24% |
| 38 | Gem diamonds | 20 | 23 | 17% |
| 39 | Fertilizers, pesticides, and insecticides | 16 | 22 | 38% |
| 40 | Other precious metals | 29 | 22 | -24% |
| 41 | Televisions and video equipment | 25 | 21 | -13% |
| 42 | Other consumer nondurables | 19 | 21 | 16% |
| 43 | Civilian aircraft engines | 17 | 21 | 25% |
| 44 | Excavating machinery | 15 | 21 | 37% |
| 45 | Jewelry | 21 | 20 | -1% |
| 46 | Shingles, wallboard | 17 | 19 | 11% |
| 47 | Vegetables | 17 | 19 | 11% |
| 48 | Agricultural machinery, equipment | 15 | 19 | 25% |
| 49 | Camping apparel and gear | 14 | 19 | 37% |
| 50 | Bakery products | 15 | 18 | 21% |
| 51 | Natural gas | 10 | 18 | 71% |
| 52 | Automotive tires and tubes | 14 | 17 | 21% |
| 53 | Toiletries and cosmetics | 15 | 17 | 14% |
| 54 | Meat products | 15 | 17 | 8% |
| 55 | Iron and steel, advanced | 13 | 16 | 25% |
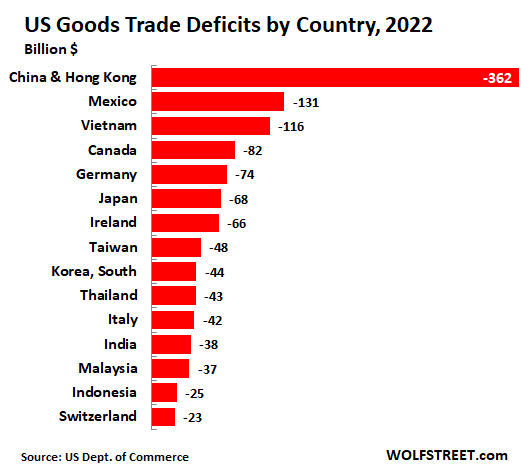
The Goods Trade Deficit, by Country.
Below are the 15 countries with which the US has the largest goods trade deficits. The opaque nature of international trade, such as trans-shipments through third countries, trade invoicing via third countries, etc., produces special effects, such as Ireland, which actually doesn’t export much to the US, but in which many huge US companies have entities – often just mailbox entities – through which winds the paper trail of their imports for all kinds of reasons. Vietnam has become a major transshipment center for China’s exports to the US to dodge US tariffs.
Driver behind gigantic imports of goods: Corporate America.
We cannot blame those countries. The driver of those imports and the gigantic trade deficit is the search of cheap labor and cheap products by Corporate America. The motivation: boosting profit margins. And under the doctrine of globalization, US policies have encouraged rather than discouraged Corporate America to globalize production for over 30 years. So here we are.
Editor’s Note: The summary bullets for this article were chosen by Seeking Alpha editors.
Be the first to comment