

US DOLLAR FORECAST – USD/CAD. AUD/USD
- The U.S. dollar has rebounded recently, as traders have scaled back overly dovish interest-rate cut expectations
- Current market dynamics may have room to consolidate in the near term
- This article focuses on the technical outlook for USD/CAD and AUD/USD
Recommended by Diego Colman
Get Your Free USD Forecast
Most Read: US Dollar Shines Bright on Strong Data; Setups on Gold, EUR/USD, USD/JPY
The US dollar has staged a solid rebound recently as traders have scaled back bets on how much the Fed will slash borrowing costs in 2024. A couple of weeks ago, markets were largely convinced that the U.S. central bank would deliver more than 160 basis points of easing this year, but those expectations have since moderated sharply.
The odds that the FOMC will start its rate-cutting cycle in March have also diminished, boosting greenback’s bullish reversal along the way.
Given that the Fed’s monetary policy outlook, as assessed by Wall Street, remains overly dovish and inconsistent with the strength of the economy, wagers on deep rate cuts could continue to unwind, paving the way for recent moves to extend. This could possibly result in additional gains for the U.S. dollar in the near term.
With this in mind, this article will explore the technical outlook for USD/CAD and AUD/USD, analyzing important price thresholds that should be on every trader’s radar in the coming days and weeks.
Interested in learning how retail positioning can shape the short-term trajectory of USD/CAD? Our sentiment guide has all the answers. Download your free guide now!
| Change in | Longs | Shorts | OI |
| Daily | 6% | 3% | 4% |
| Weekly | -18% | 53% | 8% |
USD/CAD TECHNICAL ANALYSIS
USD/CAD has rallied vigorously since 2023, clearing critical technical thresholds in the process, including its 200-day simple moving average.
After its recent climb, the pair has reached the gates of a key resistance near 1.3540, where a short-term downtrend line aligns with the 50% Fib retracement of the Nov/Dec slump. Bears must defend this area at all costs; failure to do so could result in a move towards 1.3570, followed by 1.3625.
In the event a bearish reversal off current levels, initial support appears at 1.3480. Although prices may find stability in this zone during a pullback, a decisive breakdown could prompt a swift retrenchment towards 1.3385.
USD/CAD TECHNICAL CHART
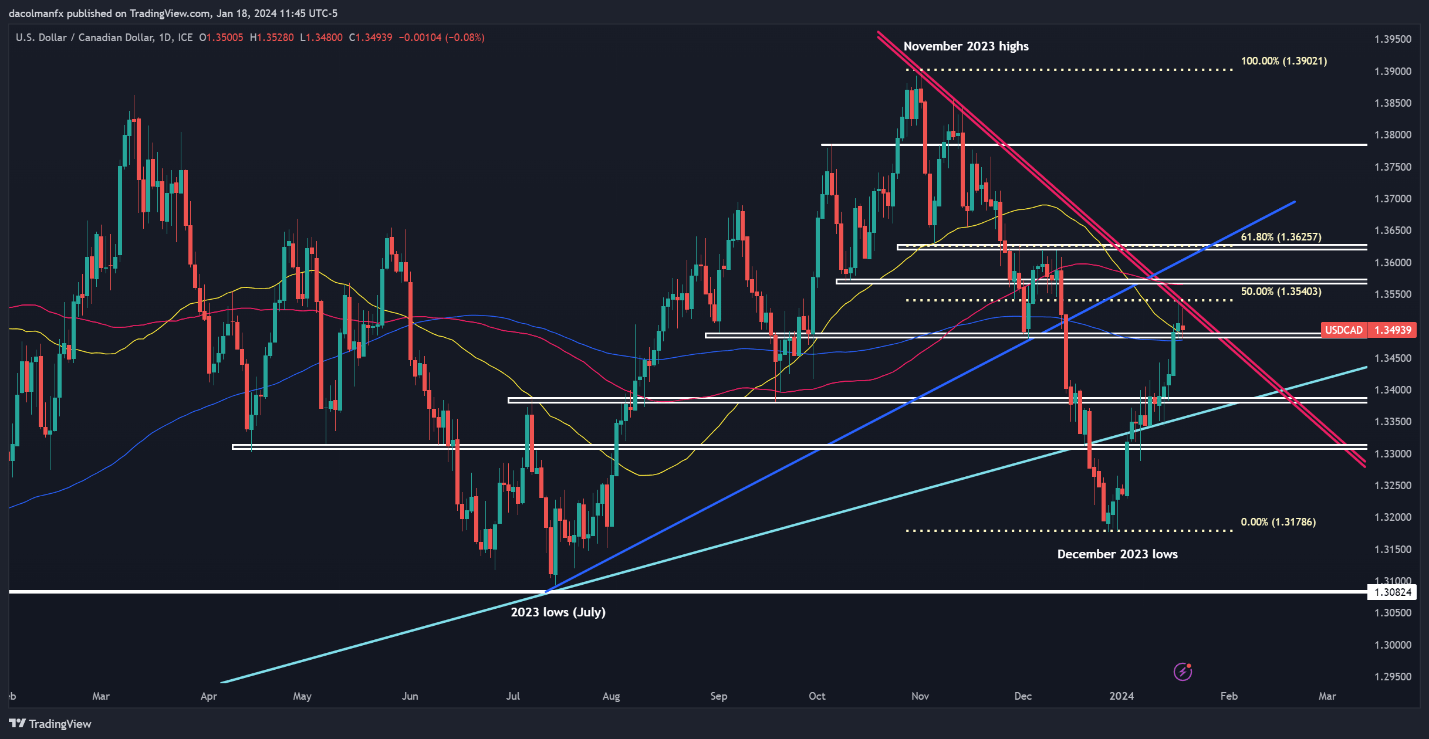
USD/CAD Chart Created Using TradingView
Unsure about the Australian dollar’s trend? Gain clarity with our complimentary Q1 trading forecast!
Recommended by Diego Colman
Get Your Free AUD Forecast
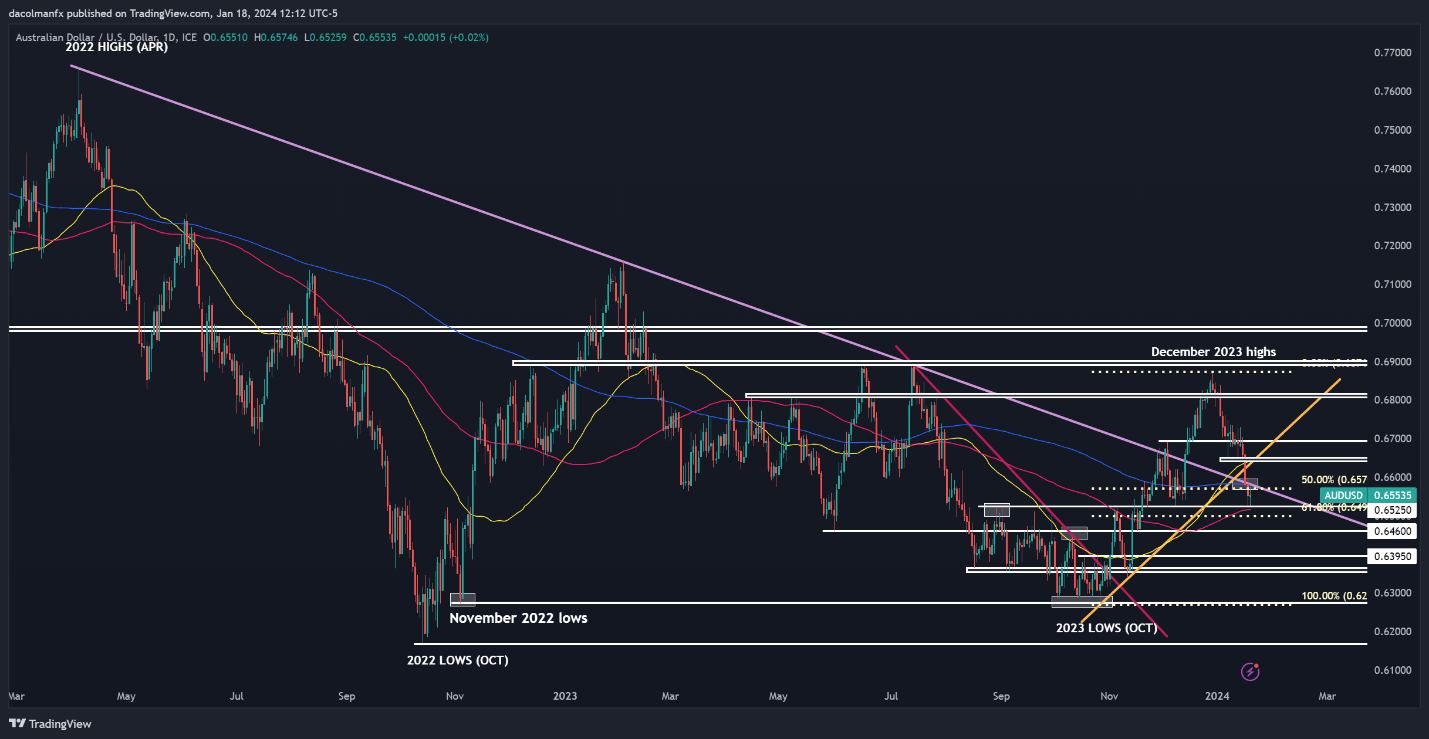
AUD/USD TECHNICAL ANALYSIS
AUD/USD sold off from late December through early this week, but has begun to stabilize after finding support near 0.6525, an important level slightly above the 100-day simple moving average. If the nascent rebound starts to gain traction, resistance emerges at 0.6570-0.6580, followed by 0.6650. On further strength, the bulls may launch an attack on the 0.6700 handle.
On the flip side, if sellers return and push prices below the 100-day SMA, the next line of defense against a bearish assault appears at 0.6500, which corresponds to the 61.8% Fibonacci retracement of the Oct/Dec rally. It is vital for this technical floor to hold, as a breakdown could usher in a descent towards 0.6460.
AUD/USD TECHNICAL CHART
Be the first to comment