

VIX INDEX PULLS BACK BUT FX VOLATILITY REMAINS ELEVATED AS US DOLLAR, S&P 500 INDEX SPIKE
- Cross-asset volatility measures remain extremely high as global markets weather turbulence from the brewing coronavirus pandemic
- The S&P 500 Index jumped 6% and the VIX fell from a near-record high as stocks rebounded from their recent rout amid promise of massive monetary and fiscal stimulus measures
- FX volatility continues to climb as USD price action and the broader US Dollar Index rip higher
A turbulent trading session left the S&P 500 Index 6% higher on Tuesday. Stocks rejoiced headlines that crossed the wires alluding to monumental fiscal stimulus plans from the Trump administration. The White House is reportedly seeking ‘$1 trillion or more’ in stimulus as the deepening coronavirus pandemic wreaks havoc on the US economy.

Recommended by Rich Dvorak
Discover our Top Trading Opportunities for 2020
CHART OF S&P 500 INDEX OVERLAID WITH VIX INDEX
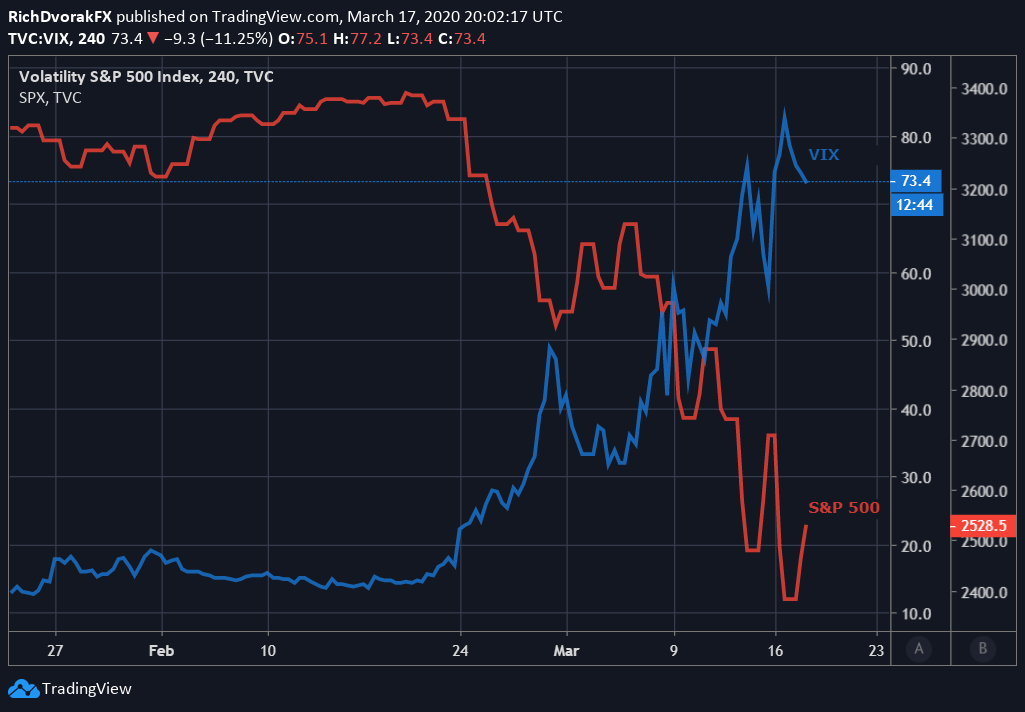
Chart created by @RichDvorakFX with TradingView
As the stock market and investor sentiment recovered, the VIX Index, which reflects expected volatility in the S&P 500 Index over the next 30-days, retreated from its highest close since October 2008 during the global financial crisis.
| Change in | Longs | Shorts | OI |
| Daily | 11% | 3% | 7% |
| Weekly | 9% | 7% | 8% |
A liquidity bazooka from the Federal Reserve could also explain part of the recovery in equities. This is seeing that the Fed is willing to pump up to $500 billion of cash into the financial system each day via overnight repo operations – even after slashing its benchmark interest rate to zero.
CHART OF CROSS-ASSET VOLATILITY BENCHMARKS: VIX INDEX, GVZ, OVX, VXEEM, TYVIX, FXVIX
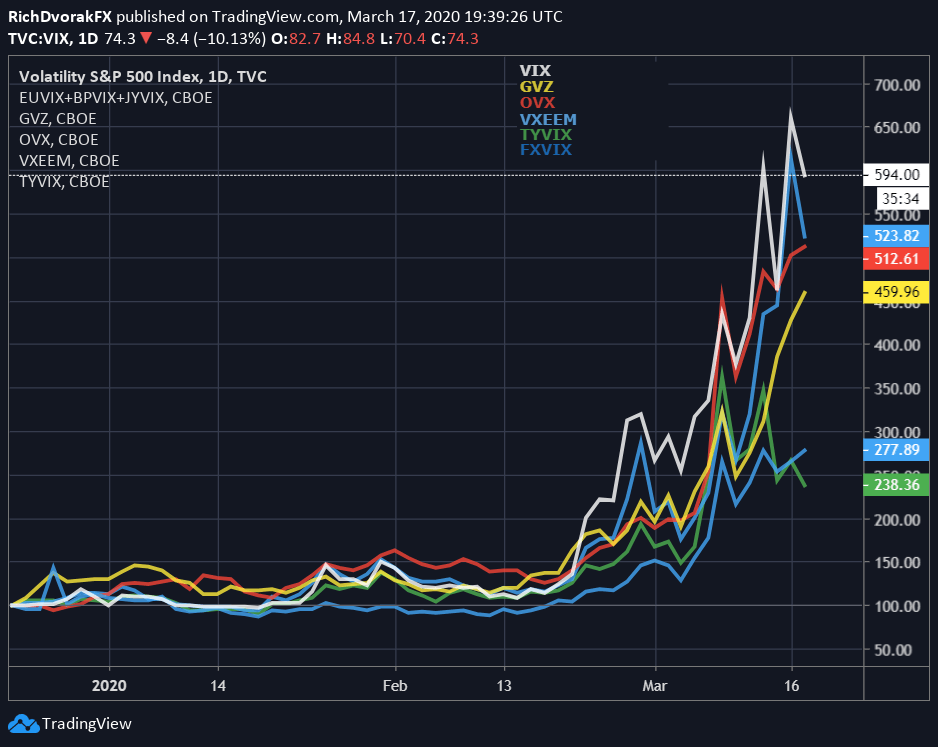
Chart created by @RichDvorakFX with TradingView
Despite the pullback in the VIX Index, or fear-gauge, cross-asset volatility measures remain extraordinarily elevated compared to three months ago. Also, other cross-asset volatility benchmarks like gold volatility (GVZ), oil volatility (OVX) and FX volatility (FXVIX) edged higher on the day.

Recommended by Rich Dvorak
Learn all about the FX market and forex trading
CHART OF US DOLLAR INDEX OVERLAID WITH FX VOLATILITY
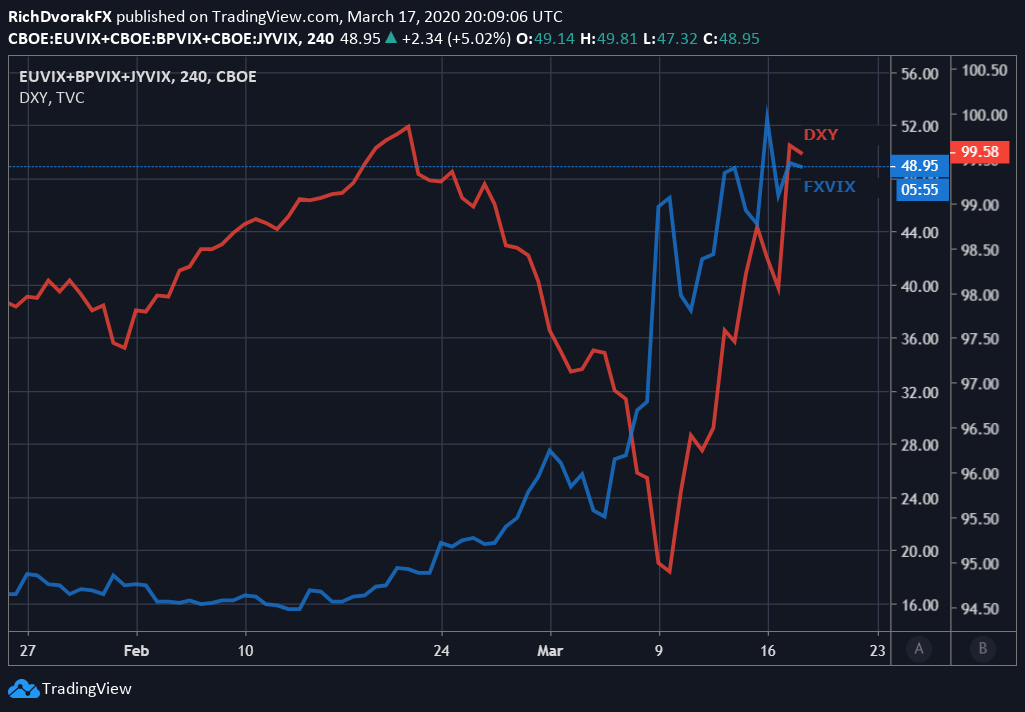
Chart created by @RichDvorakFX with TradingView
USD price action, measured by the US Dollar Index (DXY), surged alongside the S&P 500. The DXY Index now trades within reach of the 100.00 handle as the US Dollar soars and FX volatility runs rampant. Above-average readings of currency volatility might keep the US Dollar bid considering the generally positive relationship between FX volatility and the USD. This is likely given the Greenback’s posturing as a safe-haven currency.
Read More: VIX ‘Fear-Gauge’ Hits Crisis Highs Amid Cross-Asset Volatility Explosion
— Written by Rich Dvorak, Junior Analyst for DailyFX.com
Connect with @RichDvorakFX on Twitter for real-time market insight
Be the first to comment